| Param | Original file | Final file |
|---|---|---|
| Filename | modeM0/AS1A11_044T01_9000004732_32818cztM0_level2.evt | modeM0/AS1A11_044T01_9000004732_32818cztM0_level2_quad_clean.evt |
| Size (bytes) | 542,125,440 | 99,904,320 |
| Size | 517.0 MB | 95.3 MB |
| Events in quadrant A | 2,696,072 | 677,573 |
| Events in quadrant B | 3,840,704 | 664,839 |
| Events in quadrant C | 2,947,940 | 701,200 |
| Events in quadrant D | 6,579,728 | 615,526 |
| Mode M9 | |||
|---|---|---|---|
| Quadrant | BADHDUFLAG | Total packets | Discarded packets |
| A | 0 | 19 | 0 |
| B | 0 | 19 | 0 |
| C | 0 | 19 | 0 |
| D | 0 | 19 | 0 |
| Mode M0 | |||
|---|---|---|---|
| Quadrant | BADHDUFLAG | Total packets | Discarded packets |
| A | 0 | 11342 | 3 |
| B | 0 | 14709 | 2 |
| C | 0 | 12024 | 2 |
| D | 0 | 23281 | 2 |
| Mode SS | |||
|---|---|---|---|
| Quadrant | BADHDUFLAG | Total packets | Discarded packets |
| A | 0 | 106 | 0 |
| B | 0 | 106 | 0 |
| C | 0 | 106 | 0 |
| D | 0 | 106 | 0 |
| Quadrant | Total seconds | Saturated seconds | Saturation percentage |
|---|---|---|---|
| A | 5230 | 53 | 1.013384% |
| B | 5230 | 444 | 8.489484% |
| C | 5230 | 66 | 1.261950% |
| D | 5231 | 768 | 14.681705% |
Noise dominated data is calculated using 1-second bins in cleaned event files. If a bin has >2000 counts, and if more than 50% of those come from <1% of pixels, then it is considered to be noise-dominated and hence unusable.
| Quadrant | # 1 sec bins | Bins with >0 counts | Bins with >2000 counts | High rate bins dominated by noise | Noise dominated (total time) | Noise dominated (detector-on time) | Marked lightcurve |
|---|---|---|---|---|---|---|---|
| A | 7113 | 5231 | 35 | 35 | 0.49% | 0.67% | 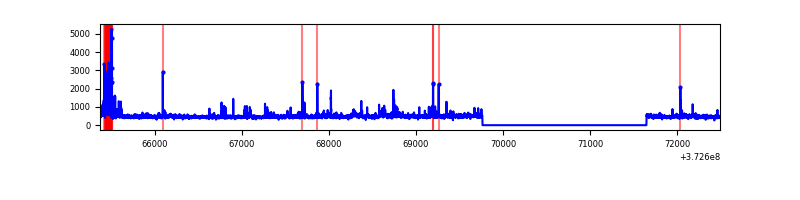 |
| B | 7113 | 5231 | 319 | 319 | 4.48% | 6.10% | 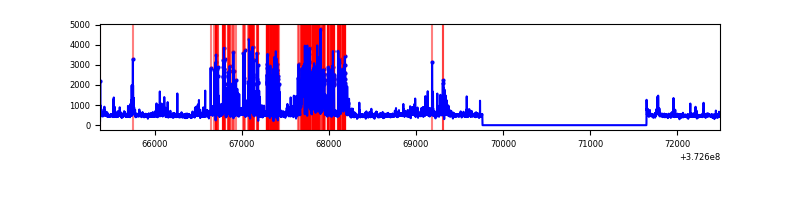 |
| C | 7113 | 5231 | 47 | 47 | 0.66% | 0.90% | 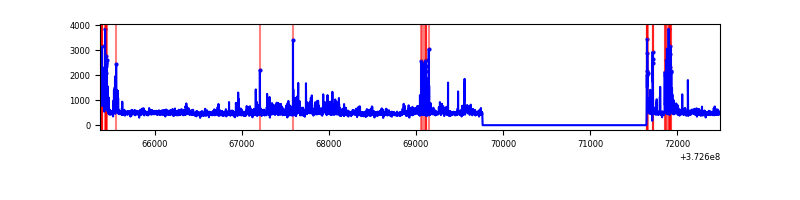 |
| D | 7114 | 5232 | 658 | 658 | 9.25% | 12.58% | 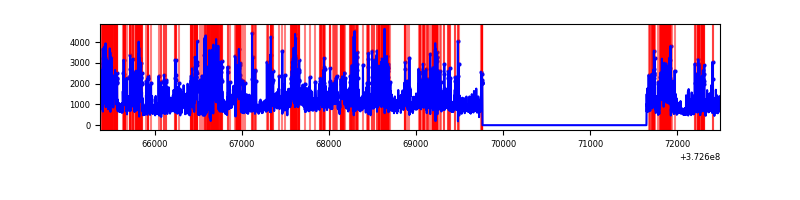 |
Top three noisy pixels from each quadrant. If the there are fewer than three noisy pixels in the level2.evt file, extra rows are filled as -1
| Pixel properties | Quadrant properties | ||||||
|---|---|---|---|---|---|---|---|
| Quadrant | DetID | PixID | Counts | Sigma | Mean | Median | Sigma |
| A | 15 | 17 | 175129 | 1440.66 | 609 | 598 | 121.1 |
| A | 9 | 143 | 84904 | 695.9 | 609 | 598 | 121.1 |
| A | 14 | 238 | 56241 | 459.3 | 609 | 598 | 121.1 |
| B | 5 | 172 | 1216819 | 10857.08 | 591 | 579 | 112.0 |
| B | 5 | 200 | 88145 | 781.68 | 591 | 579 | 112.0 |
| B | 0 | 219 | 61243 | 541.53 | 591 | 579 | 112.0 |
| C | 0 | 10 | 412995 | 2980.93 | 600 | 606 | 138.3 |
| C | 14 | 67 | 68061 | 487.59 | 600 | 606 | 138.3 |
| C | 3 | 233 | 48650 | 347.28 | 600 | 606 | 138.3 |
| D | 7 | 80 | 1280855 | 9049.53 | 570 | 556 | 141.5 |
| D | 8 | 195 | 997732 | 7048.33 | 570 | 556 | 141.5 |
| D | 10 | 203 | 500725 | 3535.34 | 570 | 556 | 141.5 |
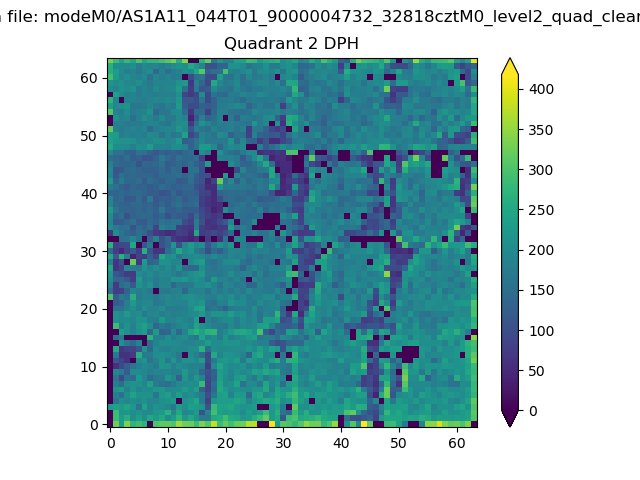
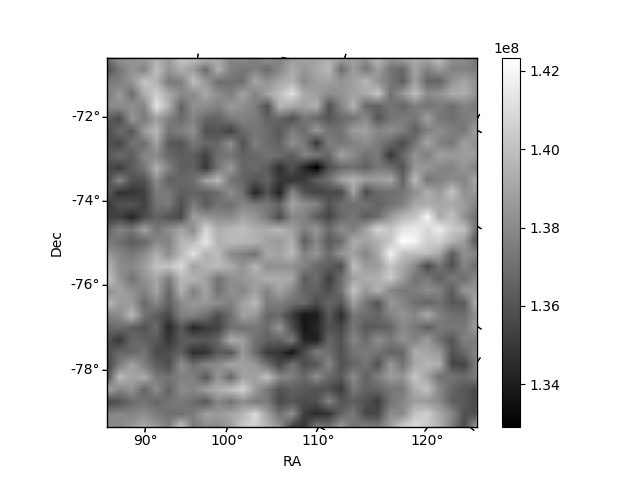
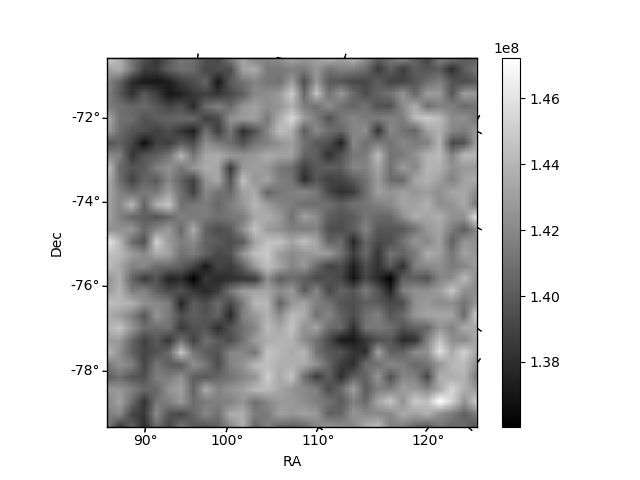
Histogram calculated using DETX and DETY for each event in the final _common_clean file
| Quadrant A | 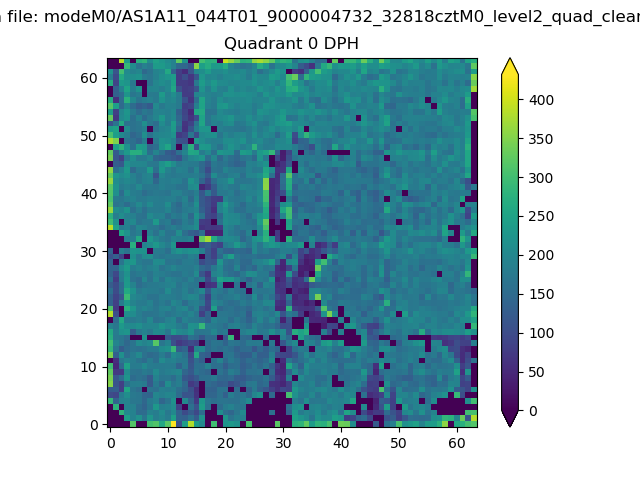 |
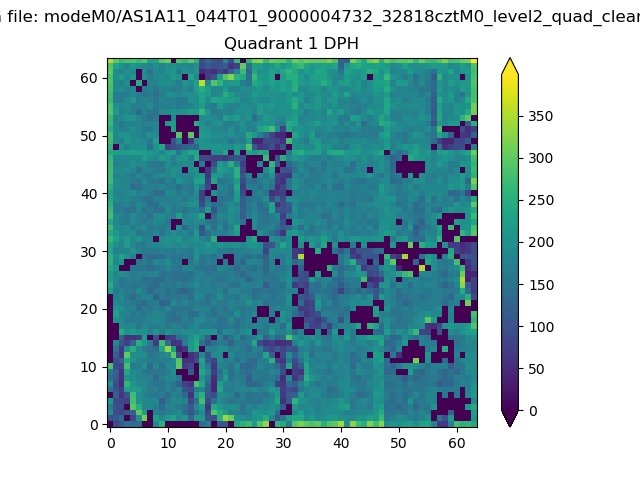 |
Quadrant B |
|---|---|---|---|
| Quadrant D | 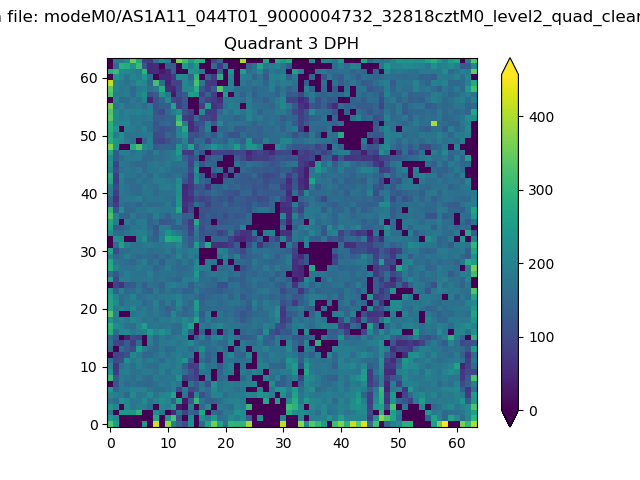 |
 |
Quadrant C |
| Plot type | Count rate plots | Images |
|---|---|---|
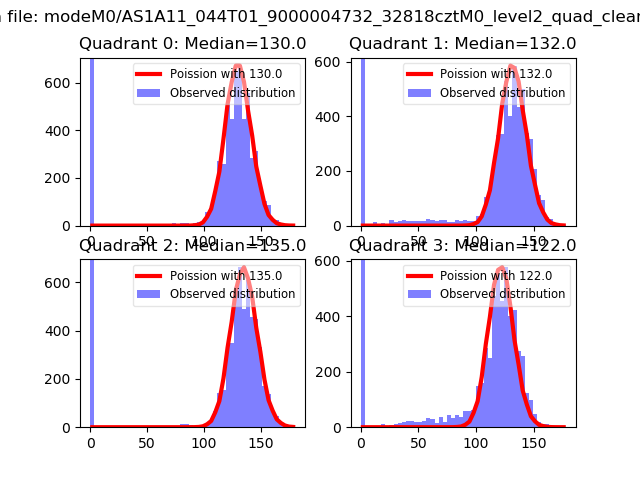
| Comparison with Poisson distribution Blue bars denote a histogram of data divided into 1 sec bins. Red curve is a Poisson curve with rate = median count rate of data. |
 |
 |
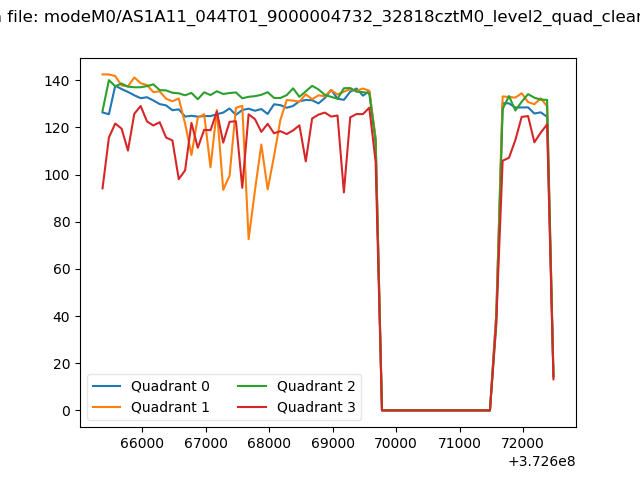
| Quadrant-wise count rates Data is divided into 100 sec bins |
 |
|
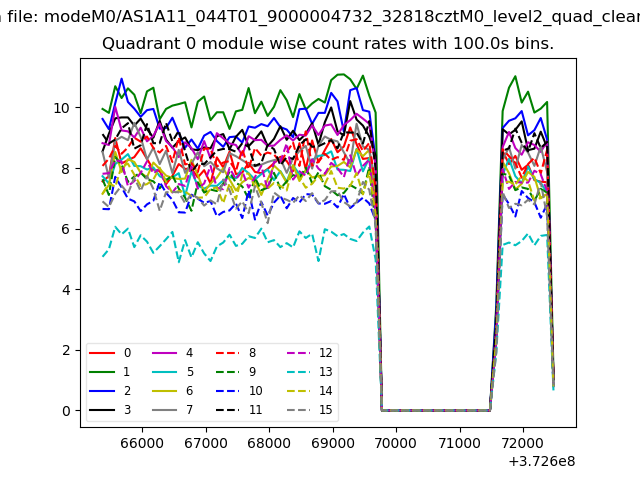
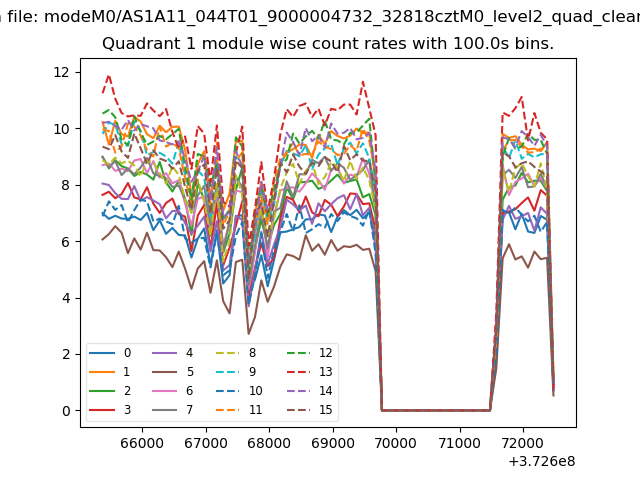
| Module-wise count rates for Quadrant A Data is divided into 100 sec bins |
 |
 |
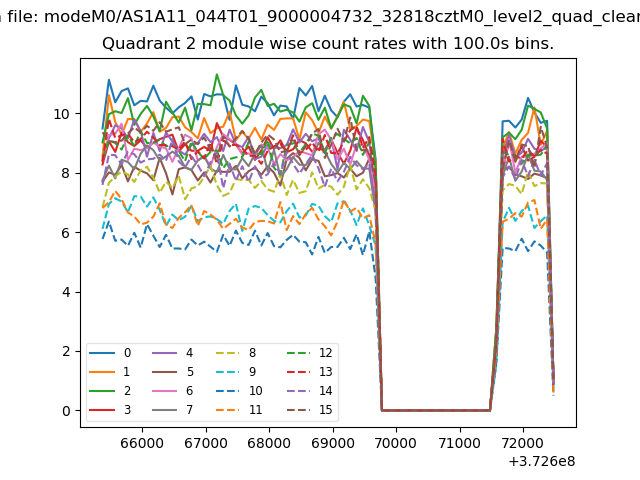
| Module-wise count rates for Quadrant B Data is divided into 100 sec bins |
 |
 |
| Module-wise count rates for Quadrant C Data is divided into 100 sec bins |
 |
 |
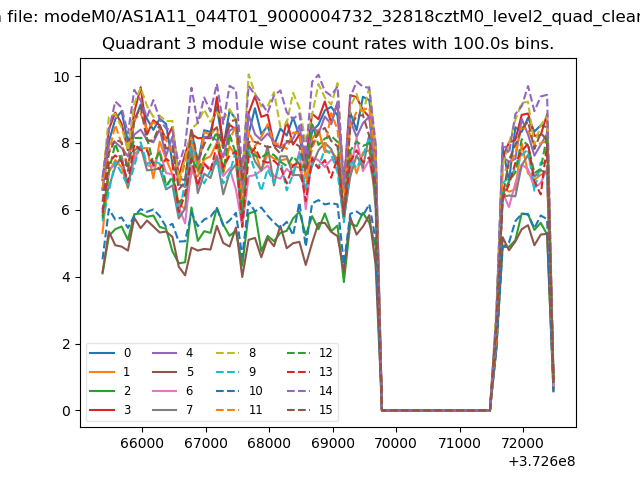
| Module-wise count rates for Quadrant D Data is divided into 100 sec bins |
 |
 |
| Parameter | Plot |
|---|---|
| CZT HV Monitor | 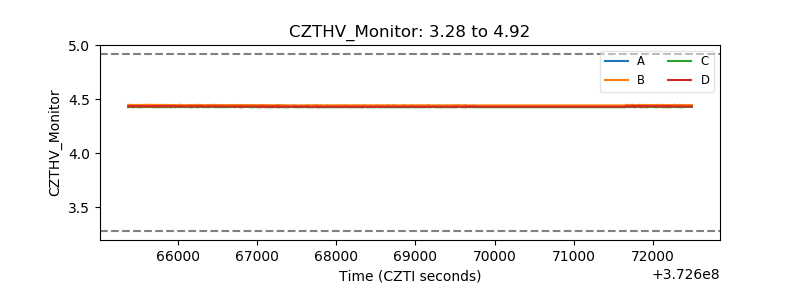 |
| D_VDD | 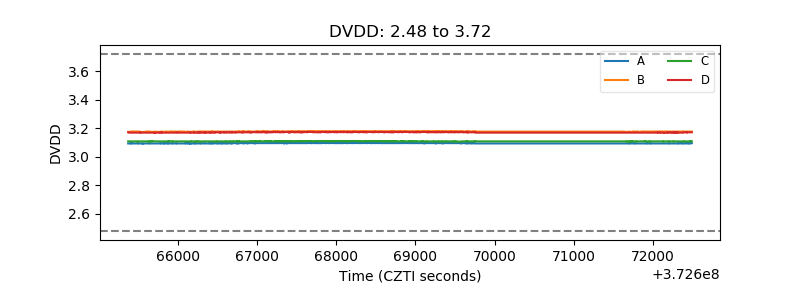 |
| Temperature 1 | 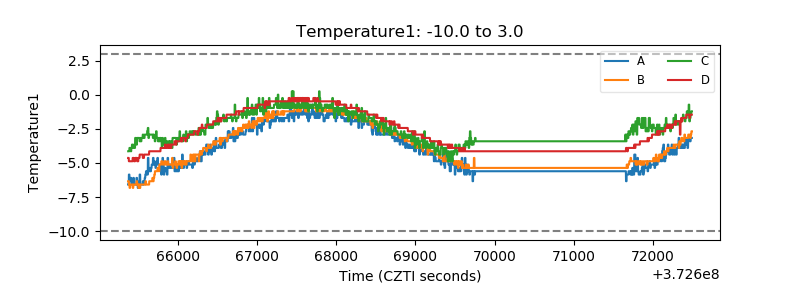 |
| Veto HV Monitor | 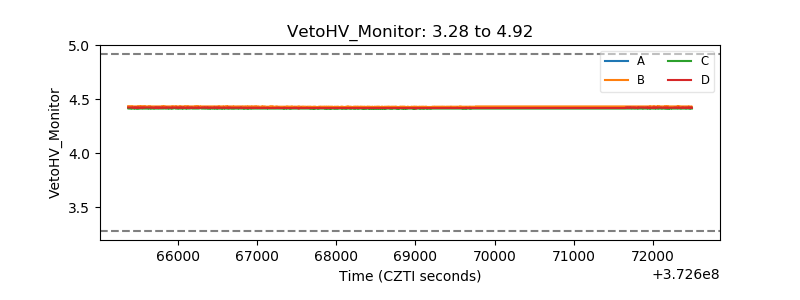 |
| Veto LLD |  |
| Alpha Counter | 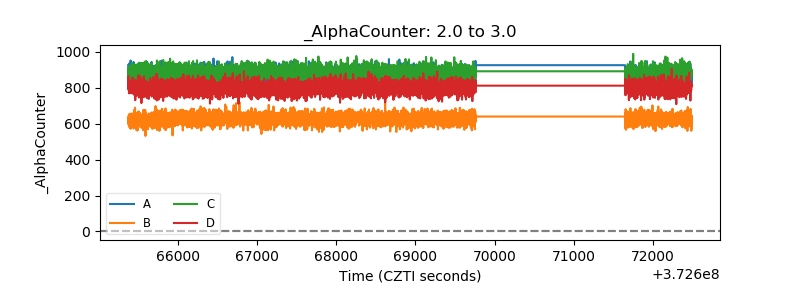 |
| _CPM_Rate | 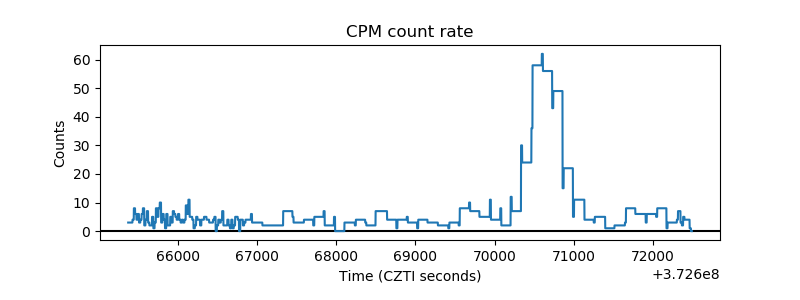 |
| CZT Counter | 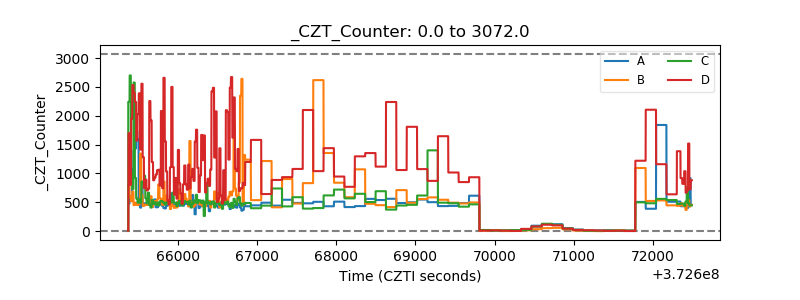 |
| +2.5 Volts monitor |  |
| +5 Volts monitor |  |
| _ROLL_ROT | 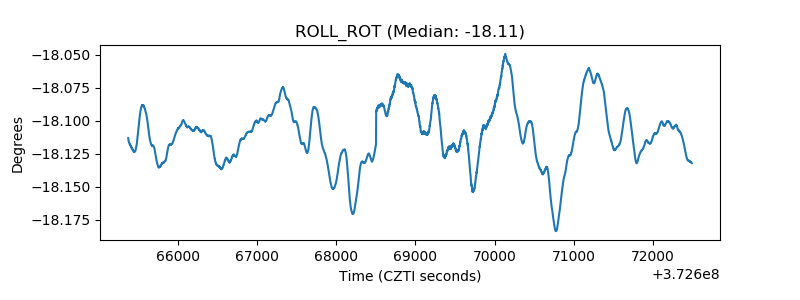 |
| _Roll_DEC | 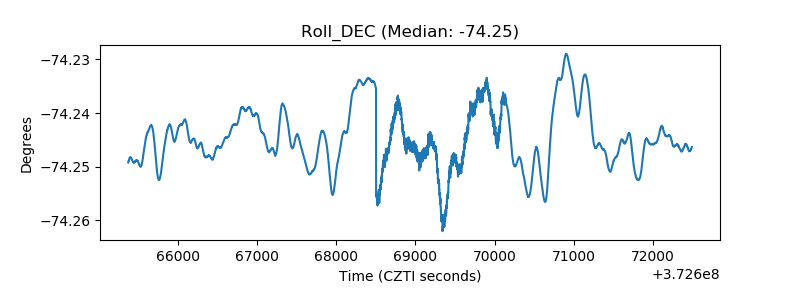 |
| _Roll_RA | 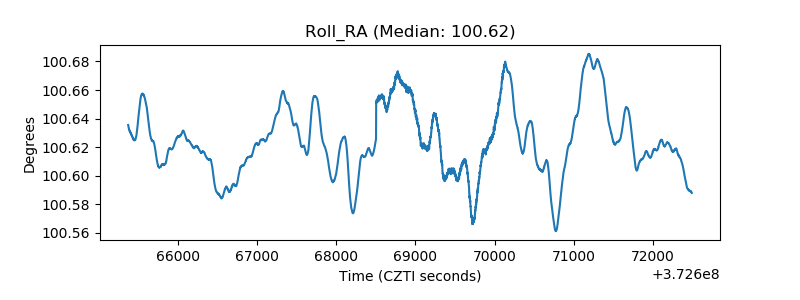 |
| Veto Counter | 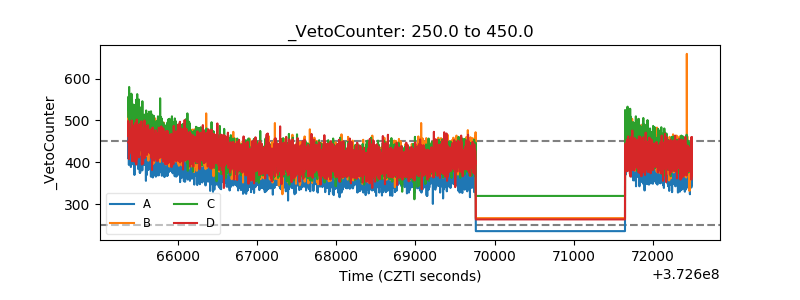 |