| Param | Original file | Final file |
|---|---|---|
| Filename | modeM0/AS1A11_044T01_9000004732_32819cztM0_level2.evt | modeM0/AS1A11_044T01_9000004732_32819cztM0_level2_quad_clean.evt |
| Size (bytes) | 553,006,080 | 103,368,960 |
| Size | 527.4 MB | 98.6 MB |
| Events in quadrant A | 2,729,520 | 696,295 |
| Events in quadrant B | 3,317,043 | 701,845 |
| Events in quadrant C | 3,033,486 | 716,337 |
| Events in quadrant D | 7,293,485 | 628,699 |
| Mode M9 | |||
|---|---|---|---|
| Quadrant | BADHDUFLAG | Total packets | Discarded packets |
| A | 0 | 20 | 0 |
| B | 0 | 20 | 0 |
| C | 0 | 20 | 0 |
| D | 0 | 21 | 0 |
| Mode M0 | |||
|---|---|---|---|
| Quadrant | BADHDUFLAG | Total packets | Discarded packets |
| A | 0 | 11657 | 3 |
| B | 0 | 13301 | 2 |
| C | 0 | 12532 | 2 |
| D | 0 | 25611 | 2 |
| Mode SS | |||
|---|---|---|---|
| Quadrant | BADHDUFLAG | Total packets | Discarded packets |
| A | 0 | 114 | 0 |
| B | 0 | 114 | 0 |
| C | 0 | 114 | 0 |
| D | 0 | 114 | 0 |
| Quadrant | Total seconds | Saturated seconds | Saturation percentage |
|---|---|---|---|
| A | 5528 | 13 | 0.235166% |
| B | 5528 | 148 | 2.677279% |
| C | 5528 | 57 | 1.031114% |
| D | 5528 | 833 | 15.068741% |
Noise dominated data is calculated using 1-second bins in cleaned event files. If a bin has >2000 counts, and if more than 50% of those come from <1% of pixels, then it is considered to be noise-dominated and hence unusable.
| Quadrant | # 1 sec bins | Bins with >0 counts | Bins with >2000 counts | High rate bins dominated by noise | Noise dominated (total time) | Noise dominated (detector-on time) | Marked lightcurve |
|---|---|---|---|---|---|---|---|
| A | 7080 | 5529 | 4 | 4 | 0.06% | 0.07% | 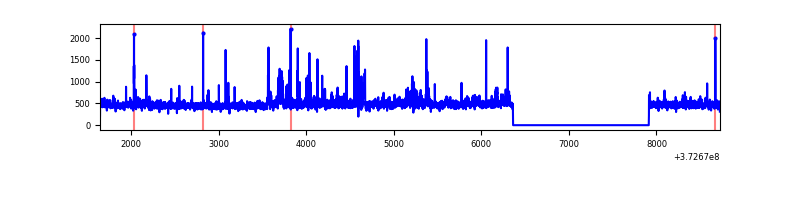 |
| B | 7080 | 5529 | 95 | 95 | 1.34% | 1.72% | 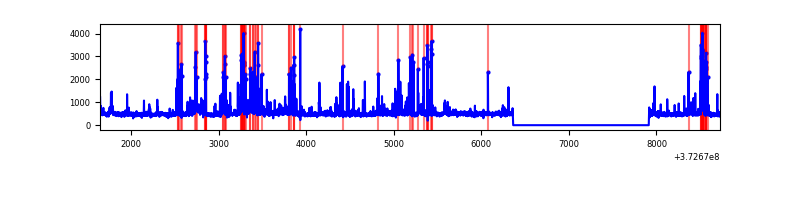 |
| C | 7080 | 5529 | 41 | 41 | 0.58% | 0.74% | 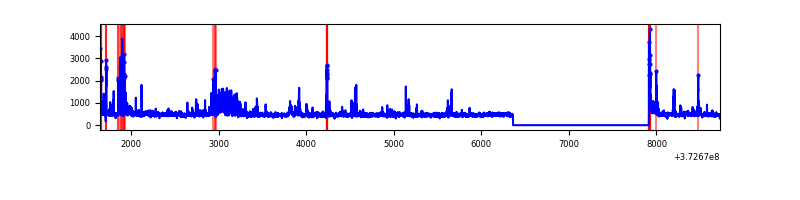 |
| D | 7080 | 5529 | 770 | 770 | 10.88% | 13.93% | 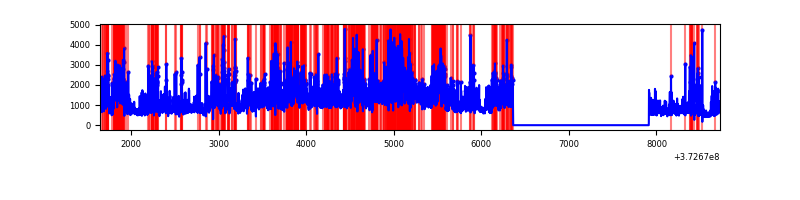 |
Top three noisy pixels from each quadrant. If the there are fewer than three noisy pixels in the level2.evt file, extra rows are filled as -1
| Pixel properties | Quadrant properties | ||||||
|---|---|---|---|---|---|---|---|
| Quadrant | DetID | PixID | Counts | Sigma | Mean | Median | Sigma |
| A | 14 | 238 | 86383 | 673.43 | 635 | 622 | 127.3 |
| A | 15 | 17 | 80762 | 629.29 | 635 | 622 | 127.3 |
| A | 9 | 143 | 64025 | 497.87 | 635 | 622 | 127.3 |
| B | 5 | 172 | 374405 | 3124.6 | 633 | 617 | 119.6 |
| B | 0 | 229 | 219296 | 1828.0 | 633 | 617 | 119.6 |
| B | 0 | 219 | 93688 | 778.01 | 633 | 617 | 119.6 |
| C | 0 | 10 | 342387 | 2385.27 | 622 | 626 | 143.3 |
| C | 3 | 233 | 89217 | 618.31 | 622 | 626 | 143.3 |
| C | 14 | 67 | 68927 | 476.7 | 622 | 626 | 143.3 |
| D | 7 | 80 | 1503054 | 10304.82 | 593 | 580 | 145.8 |
| D | 8 | 195 | 1105872 | 7580.72 | 593 | 580 | 145.8 |
| D | 10 | 203 | 704088 | 4825.06 | 593 | 580 | 145.8 |
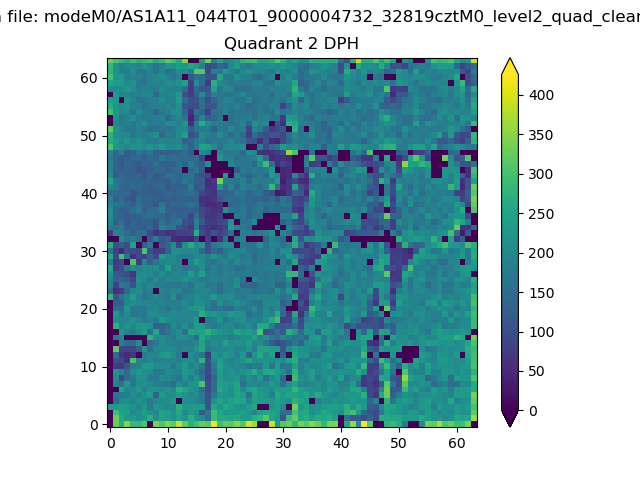
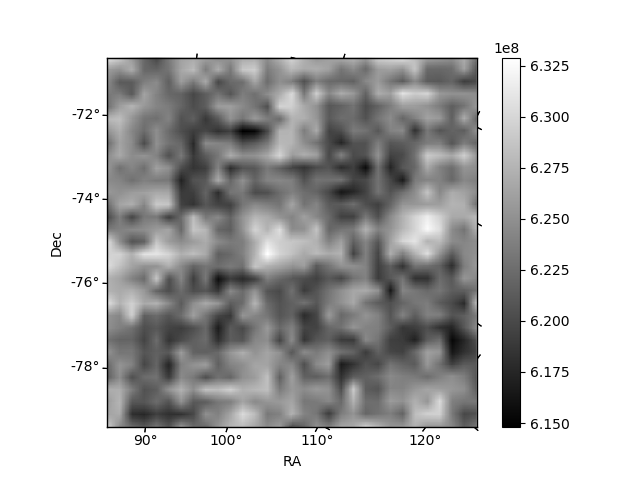
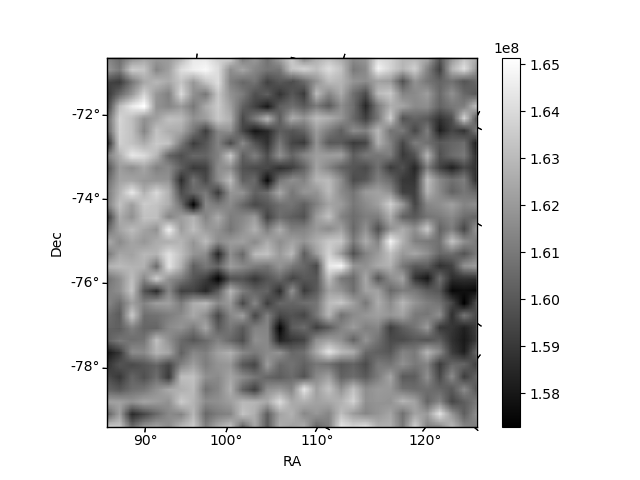
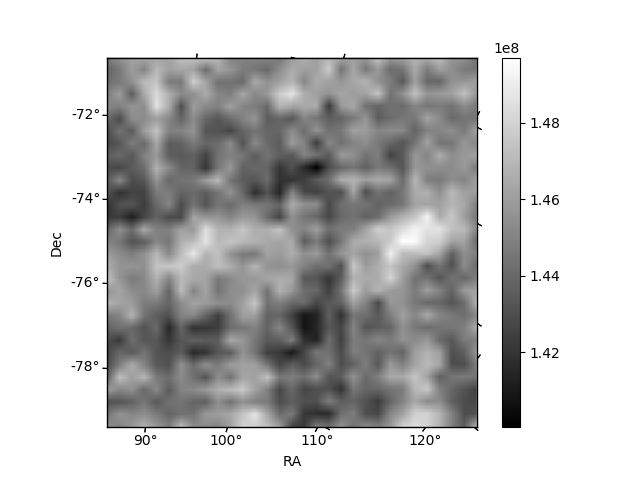
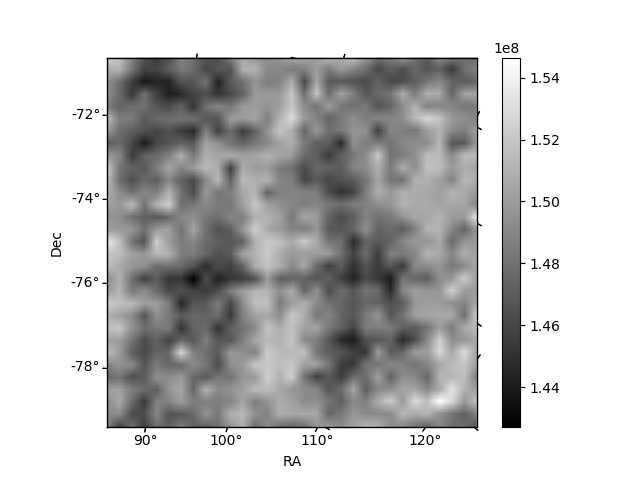
Histogram calculated using DETX and DETY for each event in the final _common_clean file
| Quadrant A | 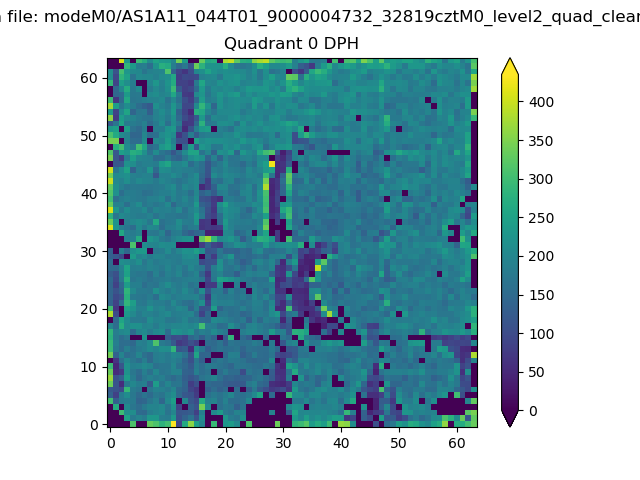 |
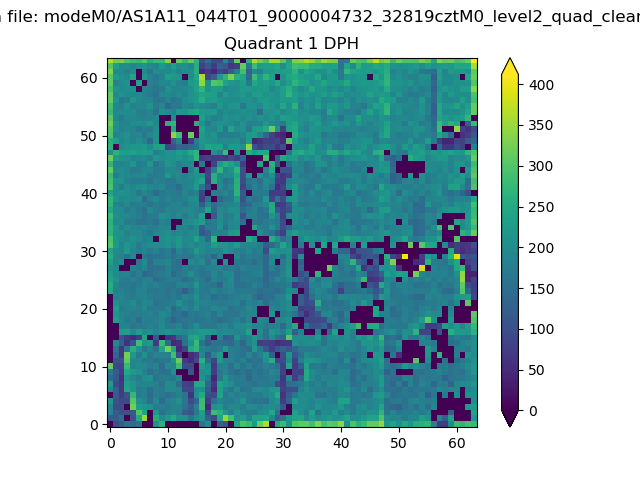 |
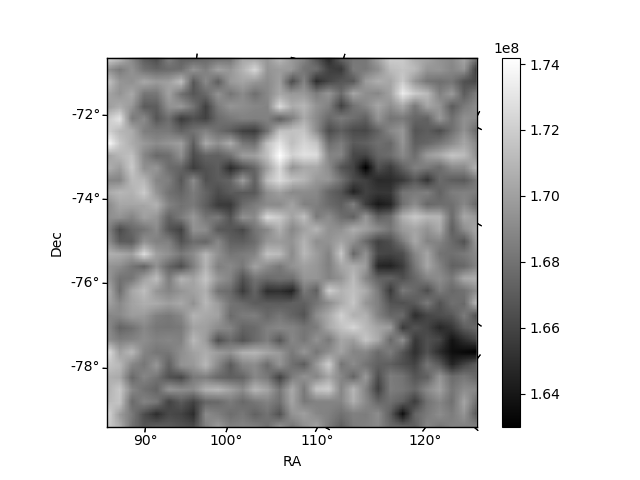
Quadrant B |
|---|---|---|---|
| Quadrant D | 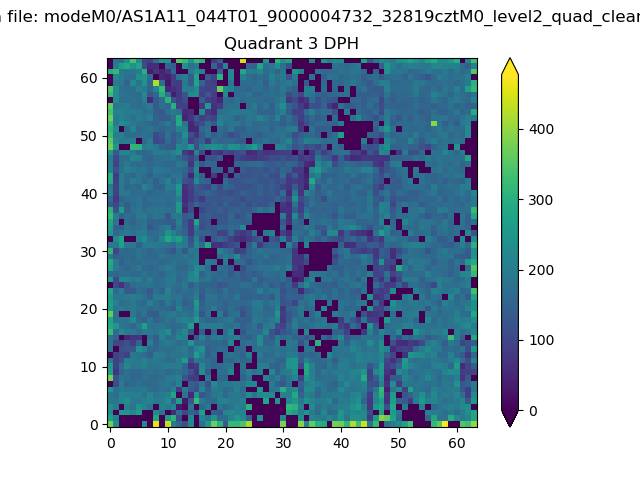 |
 |
Quadrant C |
| Plot type | Count rate plots | Images |
|---|---|---|
| Comparison with Poisson distribution Blue bars denote a histogram of data divided into 1 sec bins. Red curve is a Poisson curve with rate = median count rate of data. |
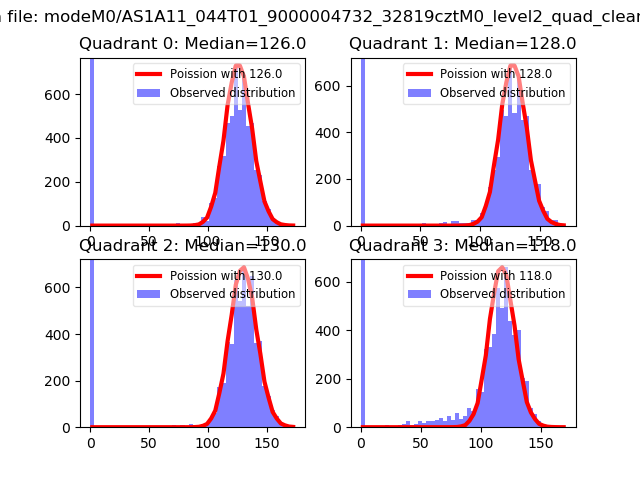 |
 |
| Quadrant-wise count rates Data is divided into 100 sec bins |
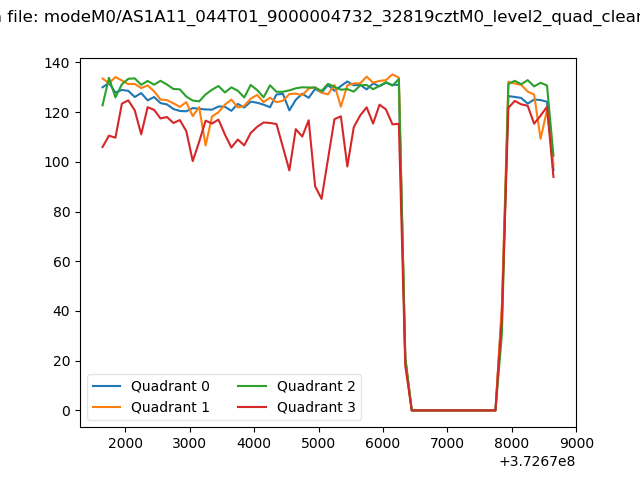 |
|
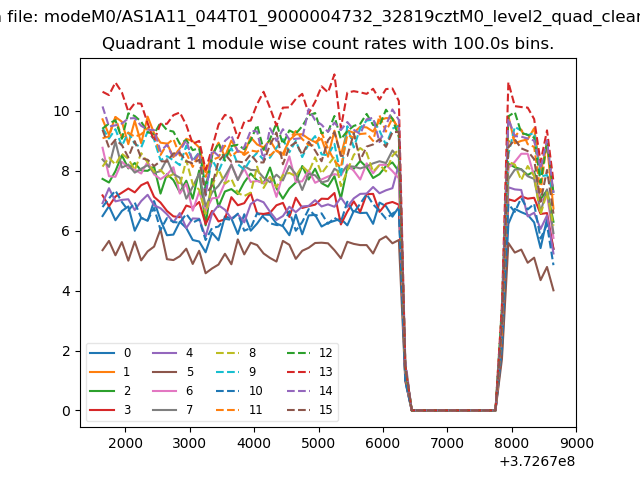
| Module-wise count rates for Quadrant A Data is divided into 100 sec bins |
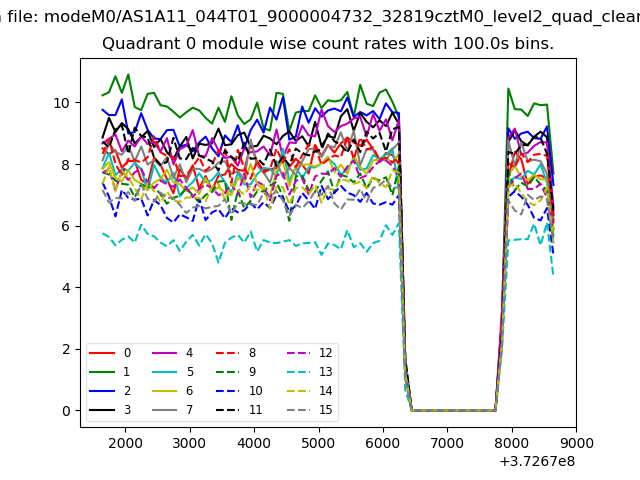 |
 |
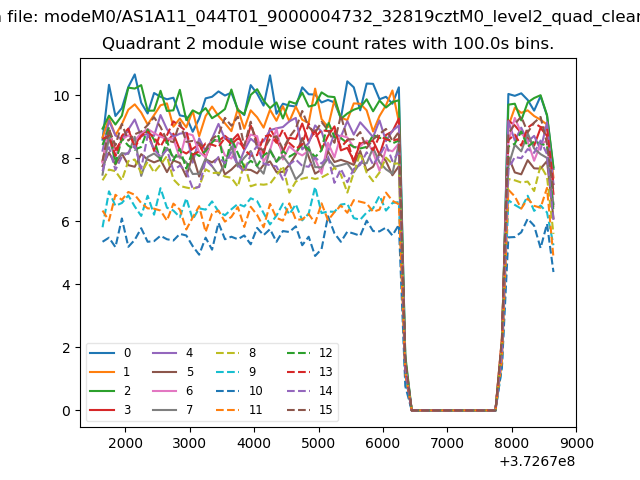
| Module-wise count rates for Quadrant B Data is divided into 100 sec bins |
 |
 |
| Module-wise count rates for Quadrant C Data is divided into 100 sec bins |
 |
 |
| Module-wise count rates for Quadrant D Data is divided into 100 sec bins |
 |
 |
| Parameter | Plot |
|---|---|
| CZT HV Monitor | 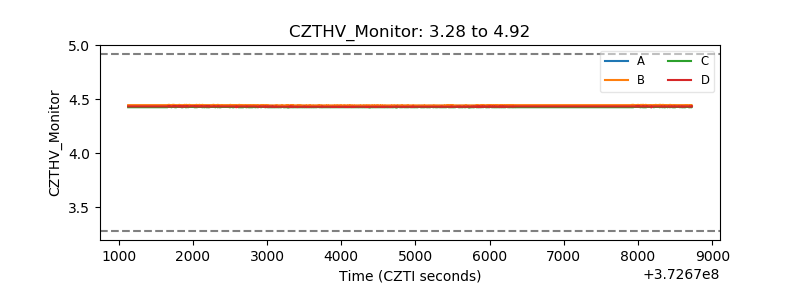 |
| D_VDD | 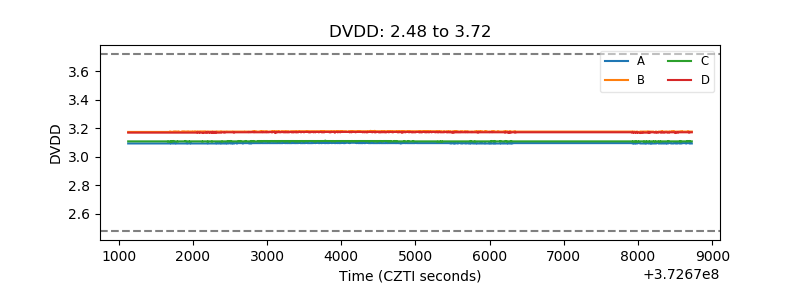 |
| Temperature 1 |  |
| Veto HV Monitor | 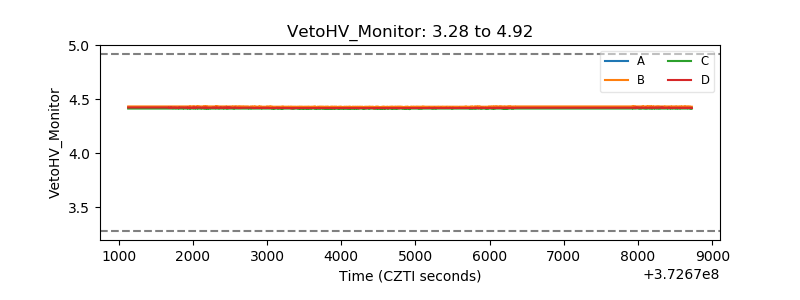 |
| Veto LLD | 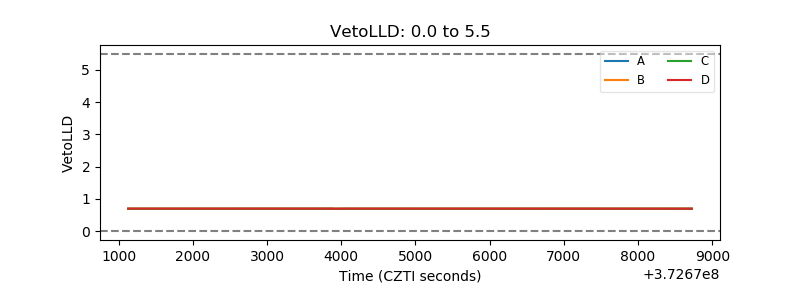 |
| Alpha Counter | 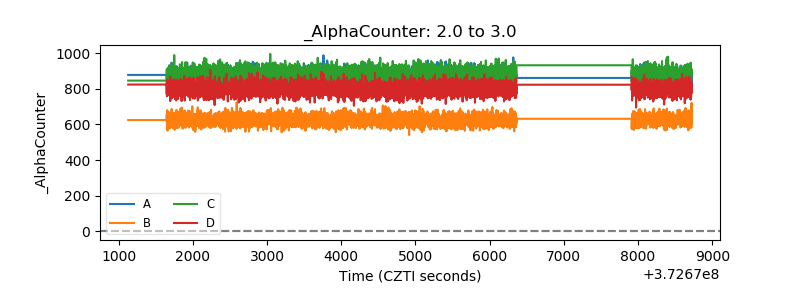 |
| _CPM_Rate | 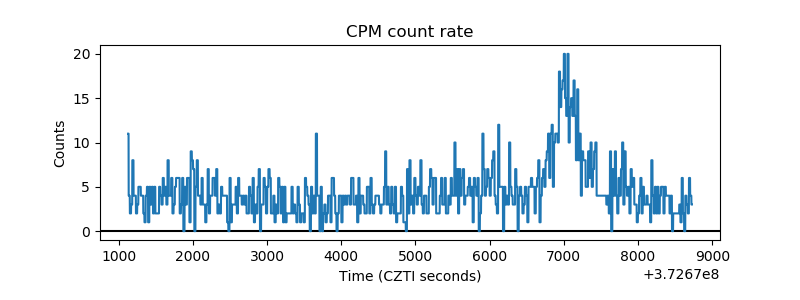 |
| CZT Counter | 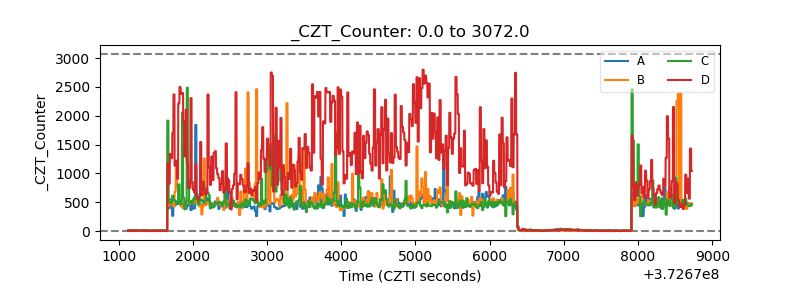 |
| +2.5 Volts monitor |  |
| +5 Volts monitor |  |
| _ROLL_ROT |  |
| _Roll_DEC | 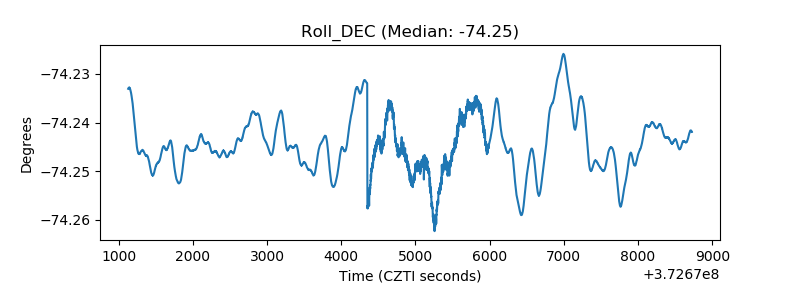 |
| _Roll_RA | 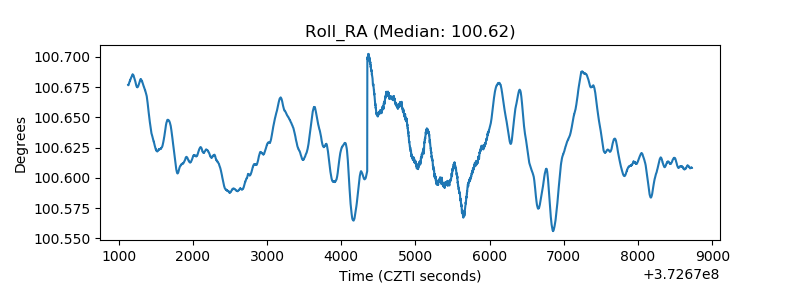 |
| Veto Counter | 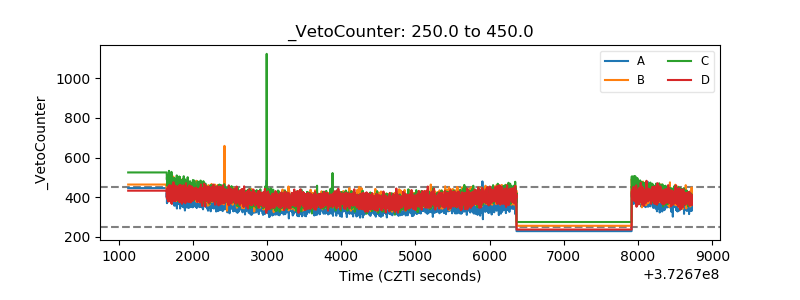 |