| Param | Original file | Final file |
|---|---|---|
| Filename | modeM0/AS1A11_044T01_9000004732_32820cztM0_level2.evt | modeM0/AS1A11_044T01_9000004732_32820cztM0_level2_quad_clean.evt |
| Size (bytes) | 565,692,480 | 102,303,360 |
| Size | 539.5 MB | 97.6 MB |
| Events in quadrant A | 2,940,900 | 688,098 |
| Events in quadrant B | 3,281,672 | 694,542 |
| Events in quadrant C | 2,777,009 | 707,308 |
| Events in quadrant D | 7,757,259 | 619,873 |
| Mode M9 | |||
|---|---|---|---|
| Quadrant | BADHDUFLAG | Total packets | Discarded packets |
| A | 0 | 15 | 0 |
| B | 0 | 15 | 0 |
| C | 0 | 15 | 0 |
| D | 0 | 16 | 0 |
| Mode M0 | |||
|---|---|---|---|
| Quadrant | BADHDUFLAG | Total packets | Discarded packets |
| A | 0 | 12313 | 3 |
| B | 0 | 13175 | 2 |
| C | 0 | 11844 | 2 |
| D | 0 | 26952 | 2 |
| Mode SS | |||
|---|---|---|---|
| Quadrant | BADHDUFLAG | Total packets | Discarded packets |
| A | 0 | 114 | 0 |
| B | 0 | 114 | 0 |
| C | 0 | 114 | 0 |
| D | 0 | 114 | 0 |
| Quadrant | Total seconds | Saturated seconds | Saturation percentage |
|---|---|---|---|
| A | 5543 | 56 | 1.010283% |
| B | 5543 | 171 | 3.084972% |
| C | 5543 | 46 | 0.829876% |
| D | 5543 | 925 | 16.687714% |
Noise dominated data is calculated using 1-second bins in cleaned event files. If a bin has >2000 counts, and if more than 50% of those come from <1% of pixels, then it is considered to be noise-dominated and hence unusable.
| Quadrant | # 1 sec bins | Bins with >0 counts | Bins with >2000 counts | High rate bins dominated by noise | Noise dominated (total time) | Noise dominated (detector-on time) | Marked lightcurve |
|---|---|---|---|---|---|---|---|
| A | 6886 | 5544 | 35 | 35 | 0.51% | 0.63% | 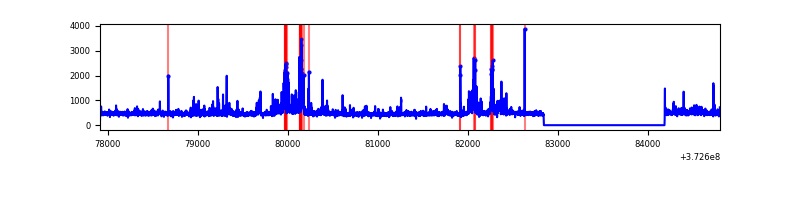 |
| B | 6886 | 5544 | 109 | 109 | 1.58% | 1.97% | 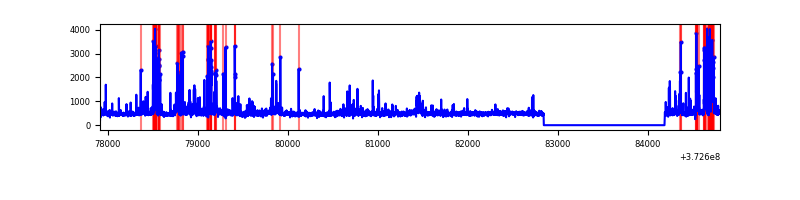 |
| C | 6886 | 5544 | 31 | 31 | 0.45% | 0.56% | 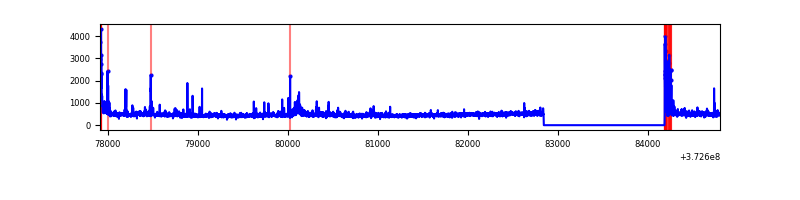 |
| D | 6886 | 5544 | 824 | 824 | 11.97% | 14.86% | 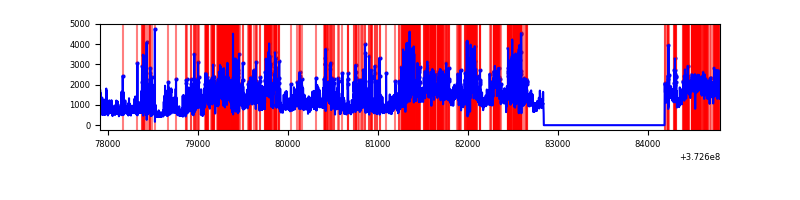 |
Top three noisy pixels from each quadrant. If the there are fewer than three noisy pixels in the level2.evt file, extra rows are filled as -1
| Pixel properties | Quadrant properties | ||||||
|---|---|---|---|---|---|---|---|
| Quadrant | DetID | PixID | Counts | Sigma | Mean | Median | Sigma |
| A | 14 | 238 | 401606 | 3167.37 | 633 | 619 | 126.6 |
| A | 7 | 16 | 26230 | 202.3 | 633 | 619 | 126.6 |
| A | 9 | 143 | 23754 | 182.74 | 633 | 619 | 126.6 |
| B | 5 | 172 | 477598 | 3986.77 | 632 | 618 | 119.6 |
| B | 0 | 219 | 137805 | 1146.66 | 632 | 618 | 119.6 |
| B | 0 | 229 | 56249 | 464.98 | 632 | 618 | 119.6 |
| C | 0 | 10 | 125753 | 869.82 | 621 | 627 | 143.9 |
| C | 3 | 233 | 99821 | 689.56 | 621 | 627 | 143.9 |
| C | 14 | 67 | 38452 | 262.94 | 621 | 627 | 143.9 |
| D | 8 | 195 | 2965515 | 20279.44 | 590 | 577 | 146.2 |
| D | 2 | 250 | 570098 | 3895.38 | 590 | 577 | 146.2 |
| D | 10 | 203 | 522558 | 3570.22 | 590 | 577 | 146.2 |
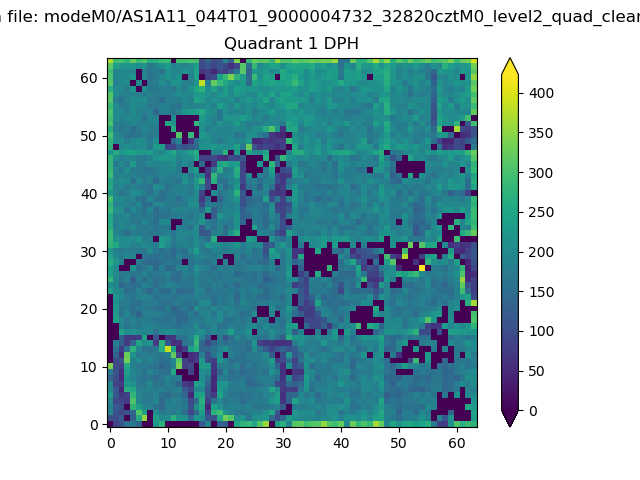
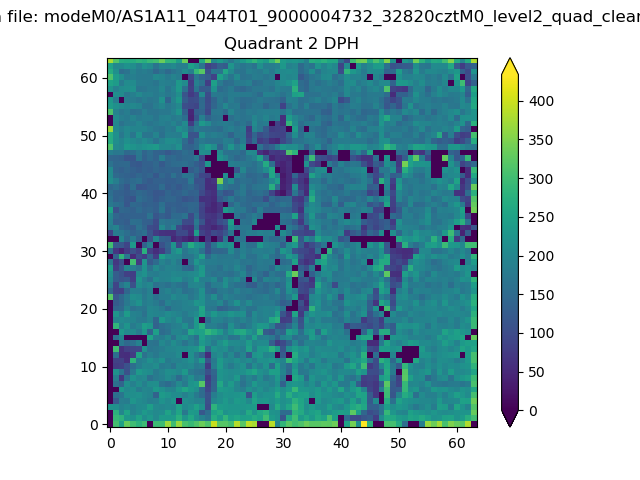
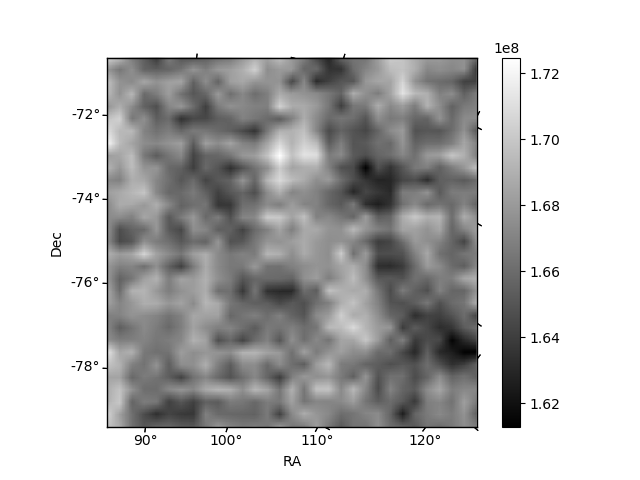
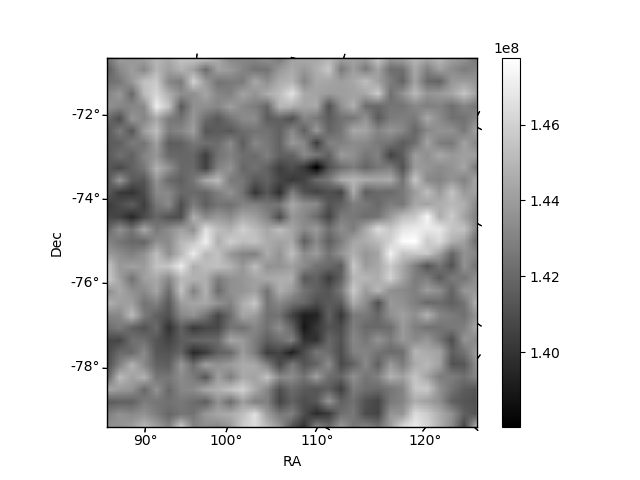
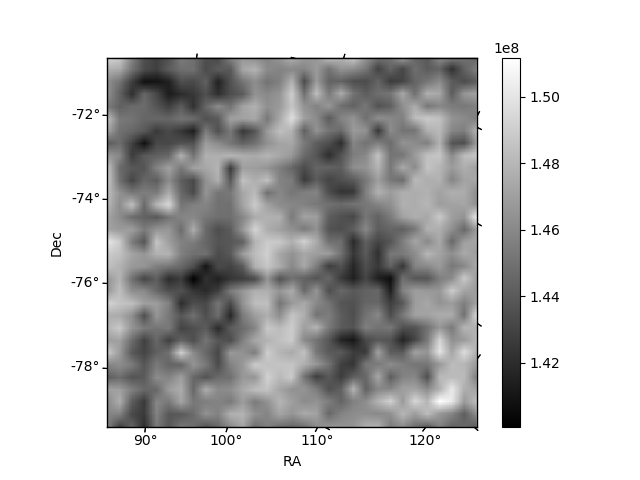
Histogram calculated using DETX and DETY for each event in the final _common_clean file
| Quadrant A |  |
 |
Quadrant B |
|---|---|---|---|
| Quadrant D |  |
 |
Quadrant C |
| Plot type | Count rate plots | Images |
|---|---|---|
| Comparison with Poisson distribution Blue bars denote a histogram of data divided into 1 sec bins. Red curve is a Poisson curve with rate = median count rate of data. |
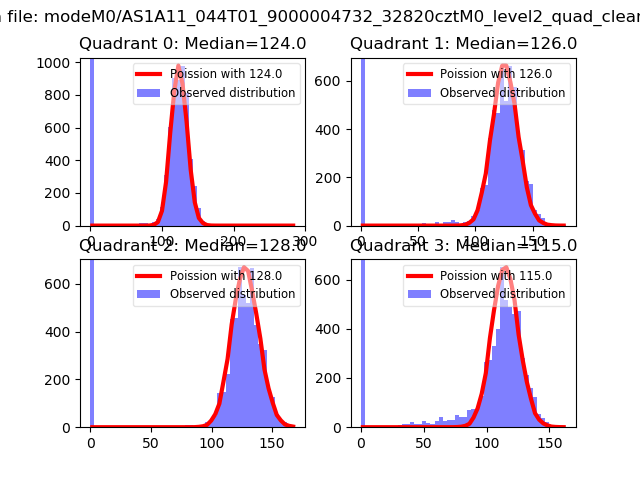 |
 |
| Quadrant-wise count rates Data is divided into 100 sec bins |
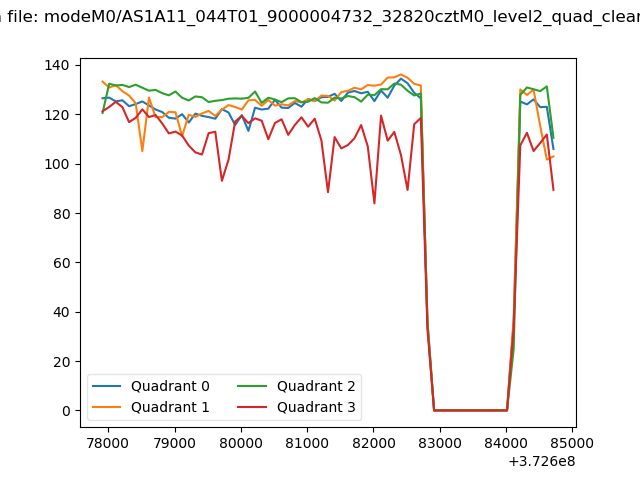 |
|
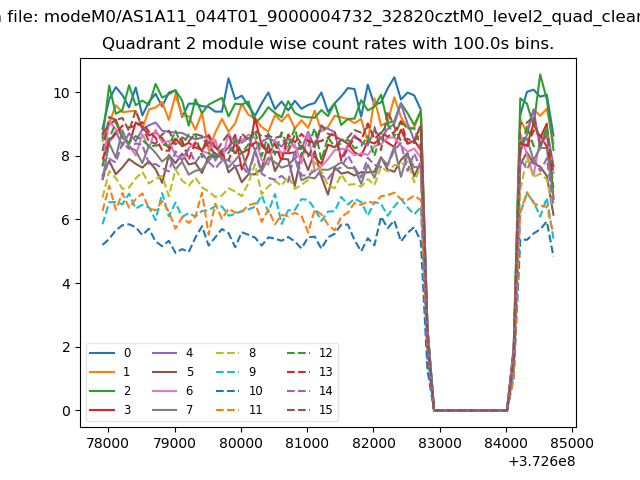
| Module-wise count rates for Quadrant A Data is divided into 100 sec bins |
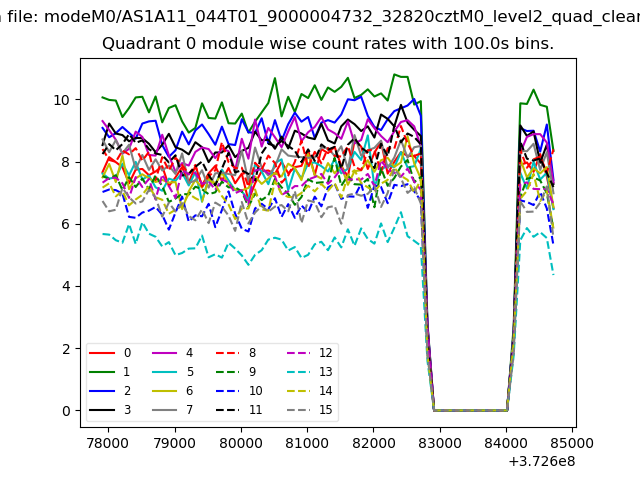 |
 |
| Module-wise count rates for Quadrant B Data is divided into 100 sec bins |
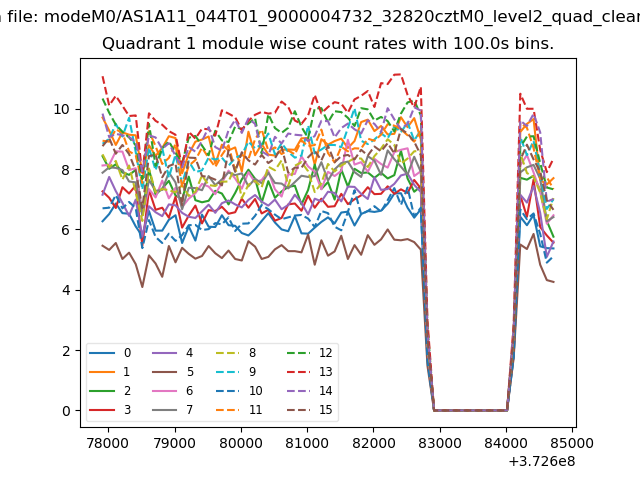 |
 |
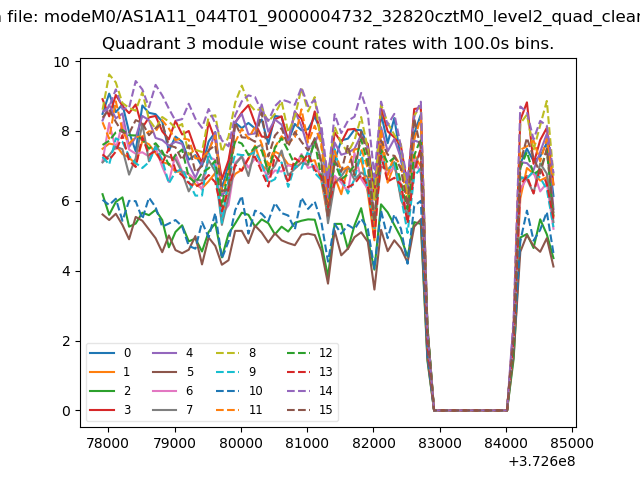
| Module-wise count rates for Quadrant C Data is divided into 100 sec bins |
 |
 |
| Module-wise count rates for Quadrant D Data is divided into 100 sec bins |
 |
 |
| Parameter | Plot |
|---|---|
| CZT HV Monitor | 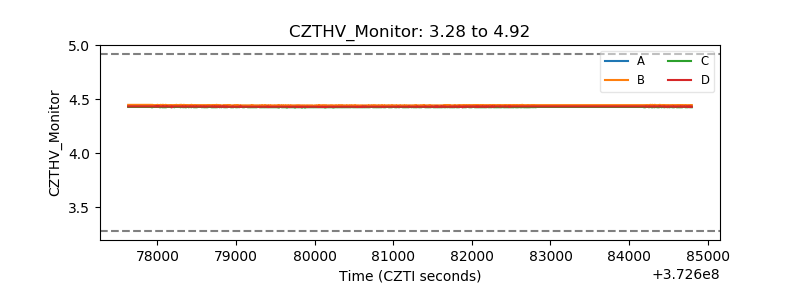 |
| D_VDD | 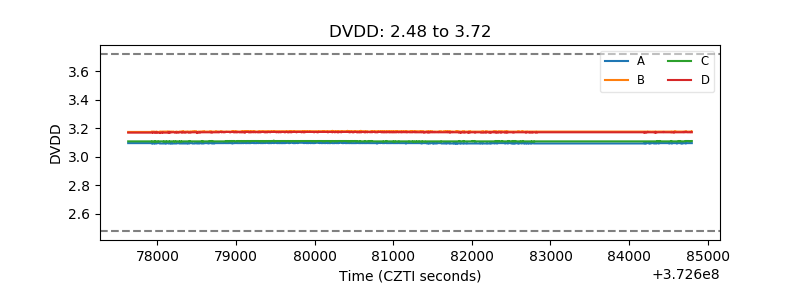 |
| Temperature 1 | 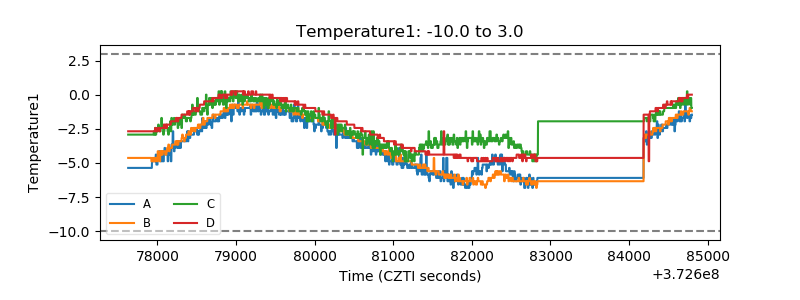 |
| Veto HV Monitor | 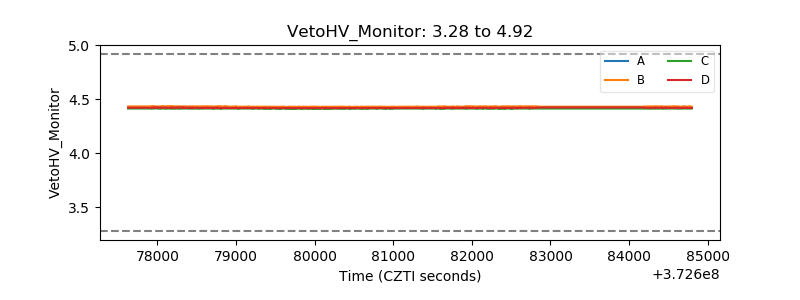 |
| Veto LLD | 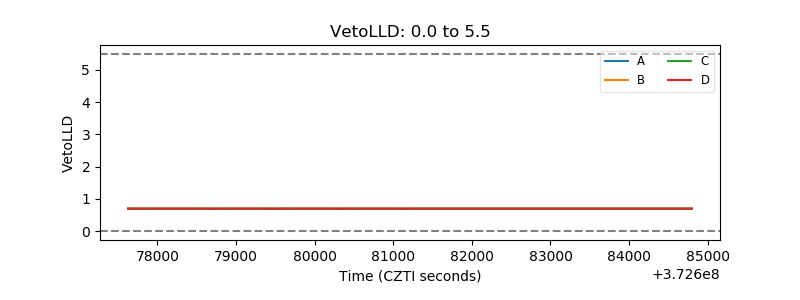 |
| Alpha Counter | 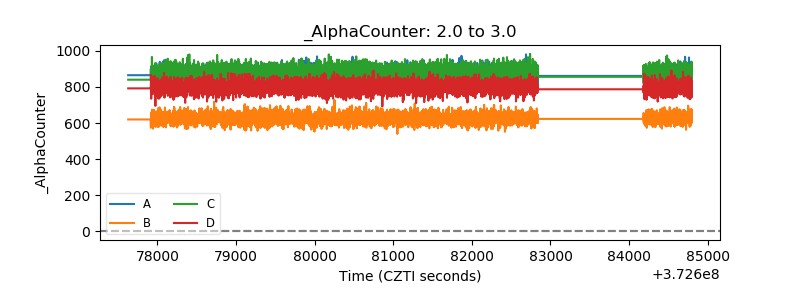 |
| _CPM_Rate | 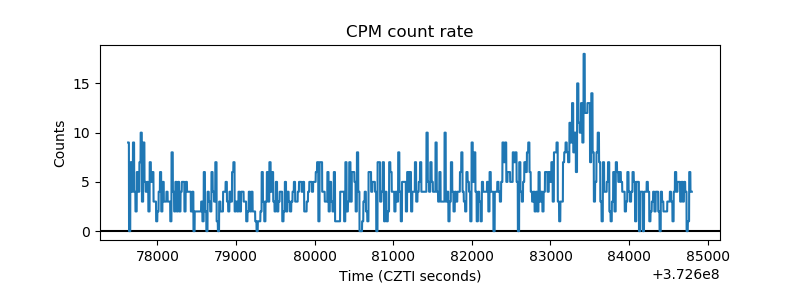 |
| CZT Counter | 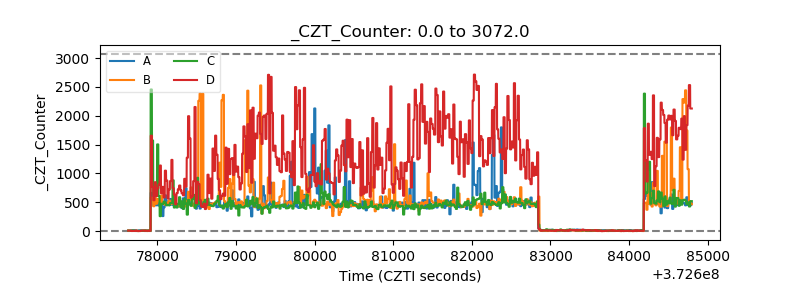 |
| +2.5 Volts monitor |  |
| +5 Volts monitor | 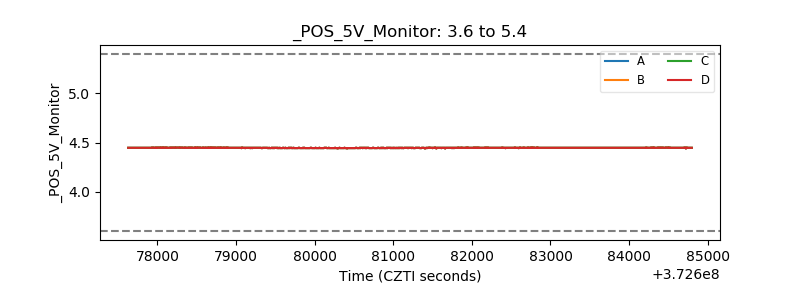 |
| _ROLL_ROT | 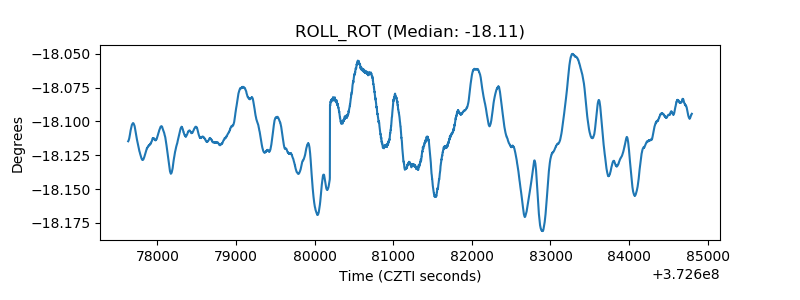 |
| _Roll_DEC | 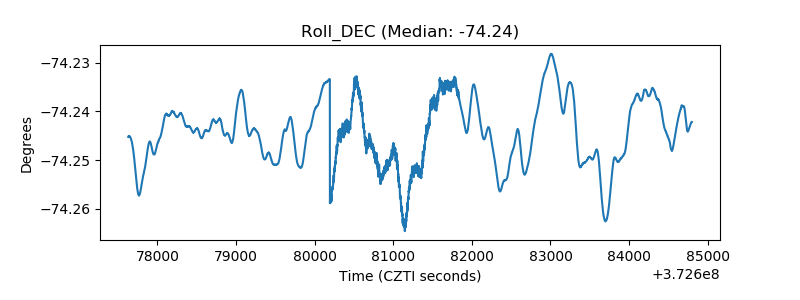 |
| _Roll_RA | 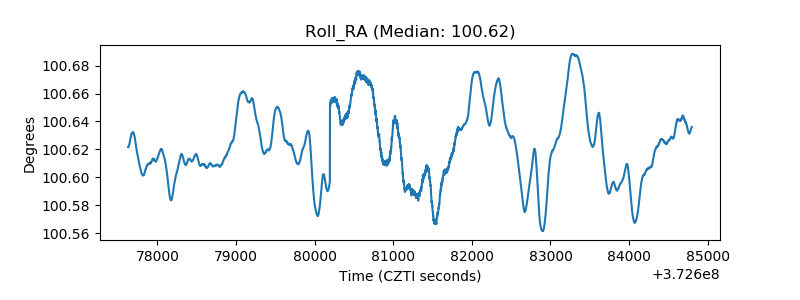 |
| Veto Counter | 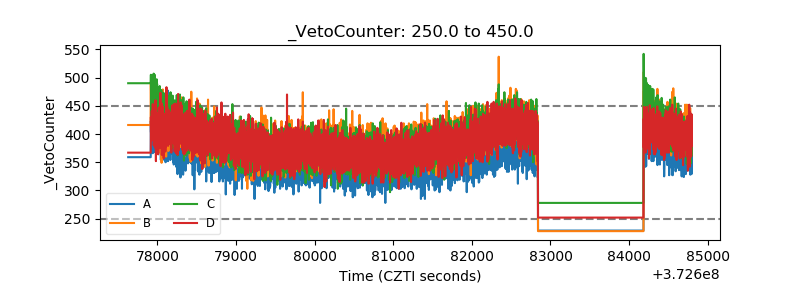 |