| Param | Original file | Final file |
|---|---|---|
| Filename | modeM0/AS1A11_044T01_9000004732_32823cztM0_level2.evt | modeM0/AS1A11_044T01_9000004732_32823cztM0_level2_quad_clean.evt |
| Size (bytes) | 1,049,149,440 | 176,613,120 |
| Size | 1000.5 MB | 168.4 MB |
| Events in quadrant A | 5,795,874 | 1,189,555 |
| Events in quadrant B | 6,312,860 | 1,195,350 |
| Events in quadrant C | 5,028,558 | 1,219,429 |
| Events in quadrant D | 13,980,551 | 1,068,690 |
| Mode M9 | |||
|---|---|---|---|
| Quadrant | BADHDUFLAG | Total packets | Discarded packets |
| A | 0 | 13 | 0 |
| B | 0 | 13 | 0 |
| C | 0 | 13 | 0 |
| D | 0 | 13 | 0 |
| Mode M0 | |||
|---|---|---|---|
| Quadrant | BADHDUFLAG | Total packets | Discarded packets |
| A | 0 | 23574 | 3 |
| B | 0 | 24929 | 2 |
| C | 0 | 21307 | 2 |
| D | 0 | 48442 | 2 |
| Mode SS | |||
|---|---|---|---|
| Quadrant | BADHDUFLAG | Total packets | Discarded packets |
| A | 0 | 198 | 0 |
| B | 0 | 198 | 0 |
| C | 0 | 198 | 0 |
| D | 0 | 198 | 0 |
| Quadrant | Total seconds | Saturated seconds | Saturation percentage |
|---|---|---|---|
| A | 9740 | 204 | 2.094456% |
| B | 9740 | 422 | 4.332649% |
| C | 9740 | 105 | 1.078029% |
| D | 9741 | 1831 | 18.796838% |
Noise dominated data is calculated using 1-second bins in cleaned event files. If a bin has >2000 counts, and if more than 50% of those come from <1% of pixels, then it is considered to be noise-dominated and hence unusable.
| Quadrant | # 1 sec bins | Bins with >0 counts | Bins with >2000 counts | High rate bins dominated by noise | Noise dominated (total time) | Noise dominated (detector-on time) | Marked lightcurve |
|---|---|---|---|---|---|---|---|
| A | 11052 | 9741 | 134 | 134 | 1.21% | 1.38% | 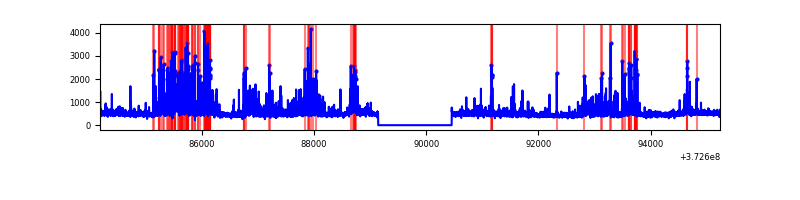 |
| B | 11052 | 9741 | 276 | 276 | 2.50% | 2.83% | 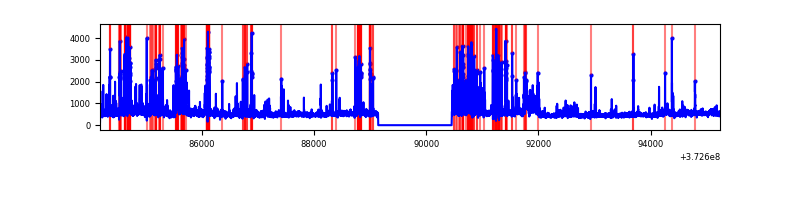 |
| C | 11052 | 9741 | 96 | 96 | 0.87% | 0.99% | 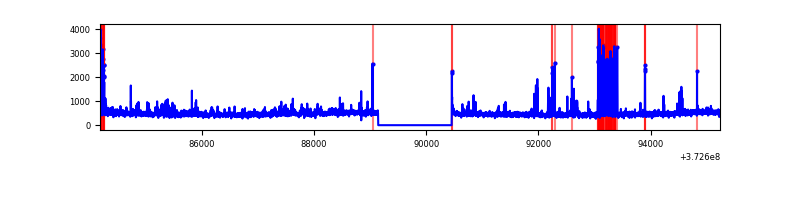 |
| D | 11053 | 9742 | 1865 | 1865 | 16.87% | 19.14% | 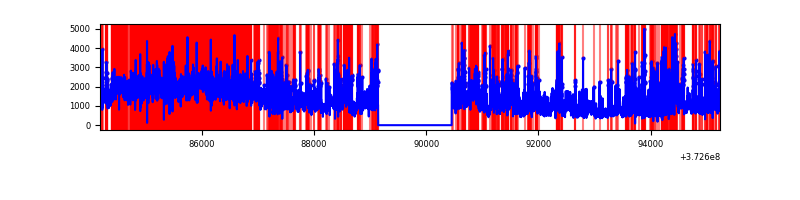 |
Top three noisy pixels from each quadrant. If the there are fewer than three noisy pixels in the level2.evt file, extra rows are filled as -1
| Pixel properties | Quadrant properties | ||||||
|---|---|---|---|---|---|---|---|
| Quadrant | DetID | PixID | Counts | Sigma | Mean | Median | Sigma |
| A | 14 | 238 | 1310995 | 5931.66 | 1102 | 1078 | 220.8 |
| A | 15 | 17 | 95432 | 427.26 | 1102 | 1078 | 220.8 |
| A | 9 | 143 | 52106 | 231.07 | 1102 | 1078 | 220.8 |
| B | 5 | 172 | 1075473 | 5195.86 | 1100 | 1071 | 206.8 |
| B | 0 | 219 | 337920 | 1629.02 | 1100 | 1071 | 206.8 |
| B | 5 | 200 | 190556 | 916.36 | 1100 | 1071 | 206.8 |
| C | 0 | 10 | 488540 | 1933.57 | 1087 | 1094 | 252.1 |
| C | 3 | 233 | 139787 | 550.16 | 1087 | 1094 | 252.1 |
| C | 14 | 67 | 95835 | 375.81 | 1087 | 1094 | 252.1 |
| D | 8 | 195 | 6486314 | 25835.26 | 1025 | 1001 | 251.0 |
| D | 2 | 250 | 929045 | 3697.01 | 1025 | 1001 | 251.0 |
| D | 12 | 6 | 878932 | 3497.38 | 1025 | 1001 | 251.0 |
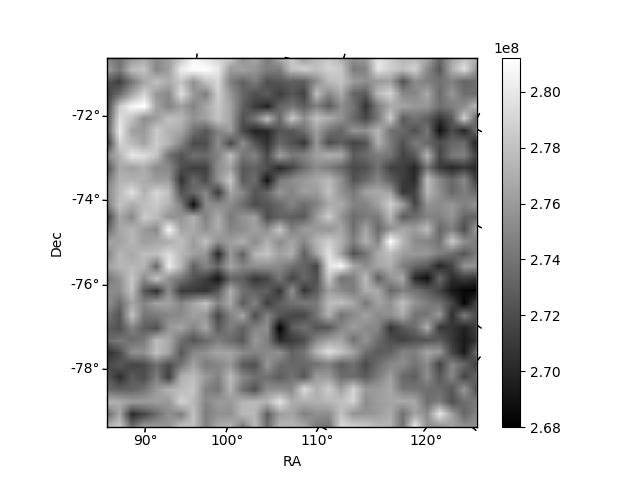
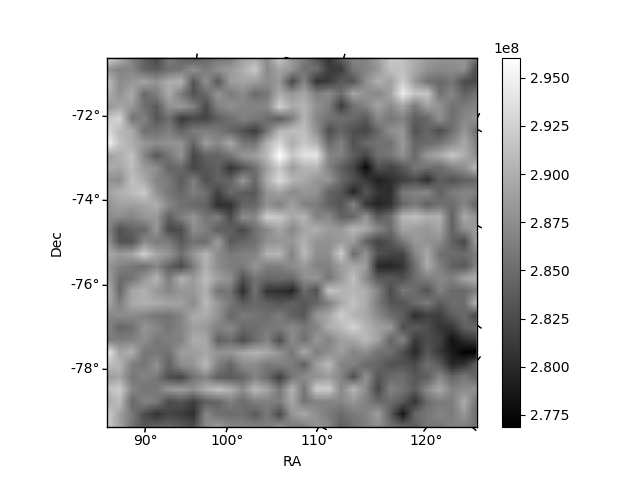
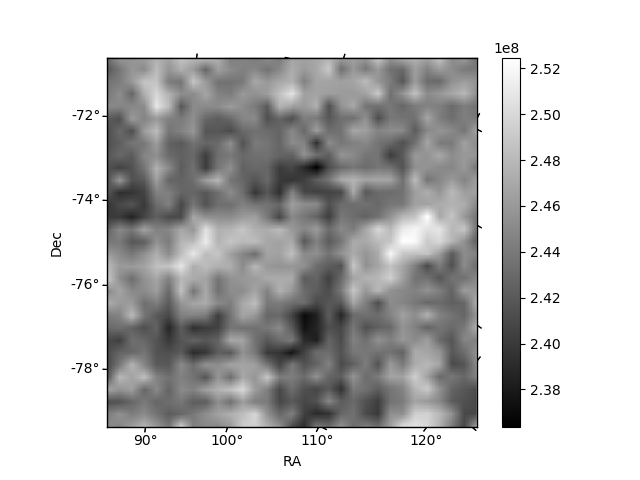
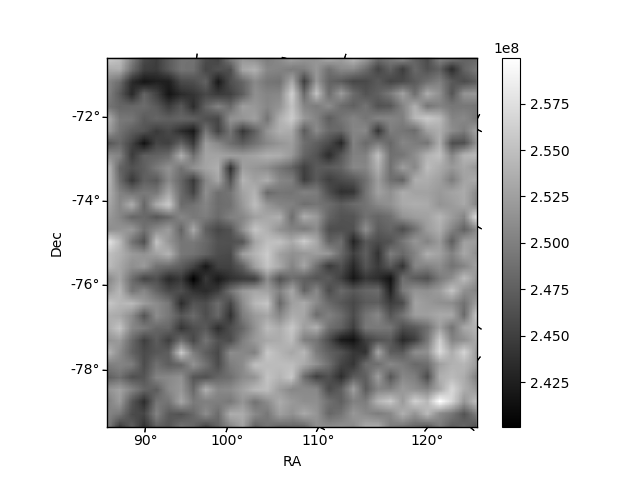
Histogram calculated using DETX and DETY for each event in the final _common_clean file
| Quadrant A | 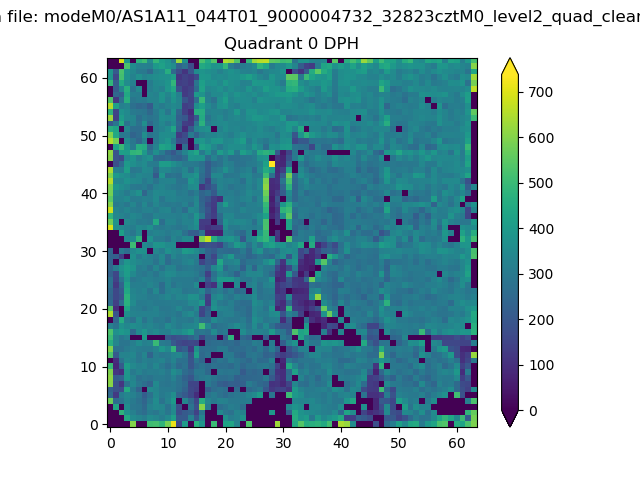 |
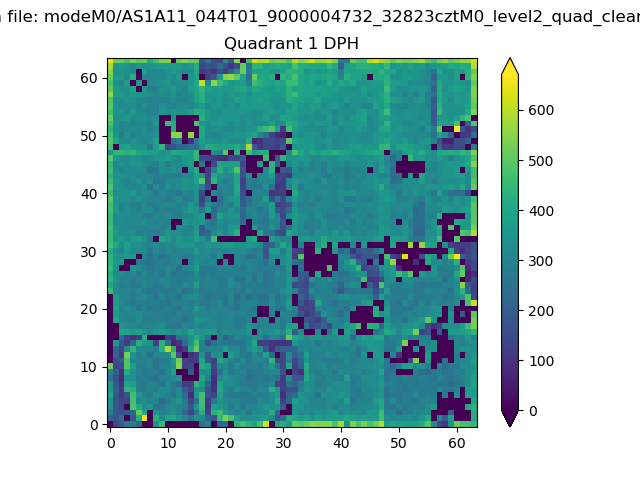 |
Quadrant B |
|---|---|---|---|
| Quadrant D | 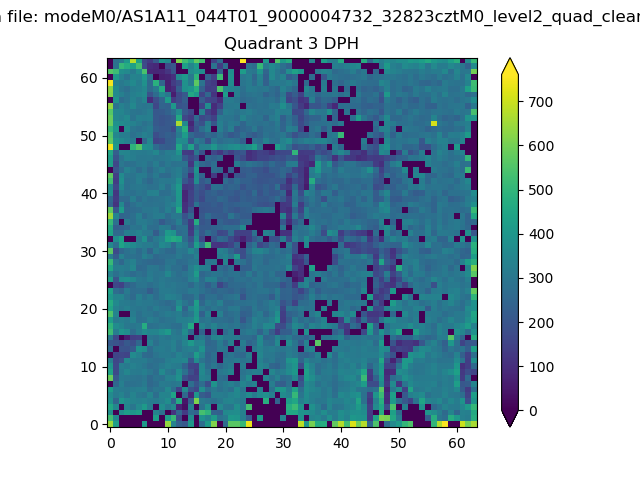 |
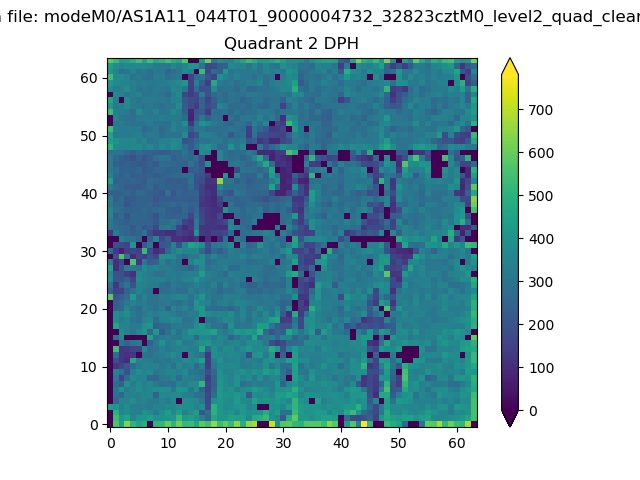 |
Quadrant C |
| Plot type | Count rate plots | Images |
|---|---|---|
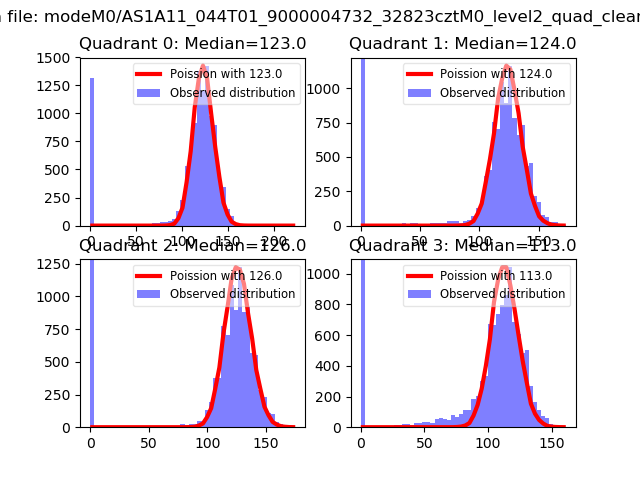
| Comparison with Poisson distribution Blue bars denote a histogram of data divided into 1 sec bins. Red curve is a Poisson curve with rate = median count rate of data. |
 |
 |
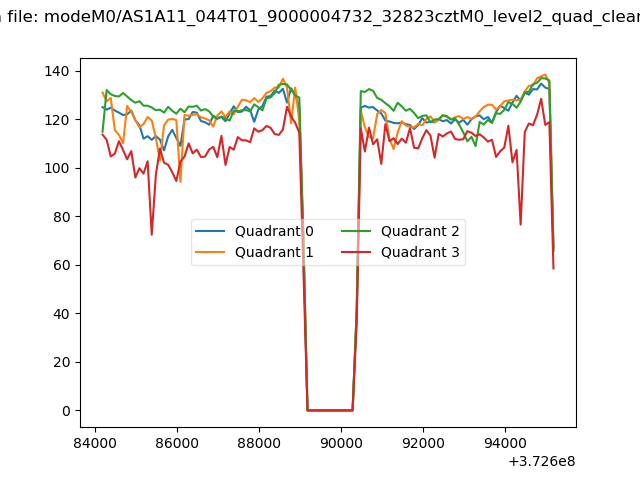
| Quadrant-wise count rates Data is divided into 100 sec bins |
 |
|
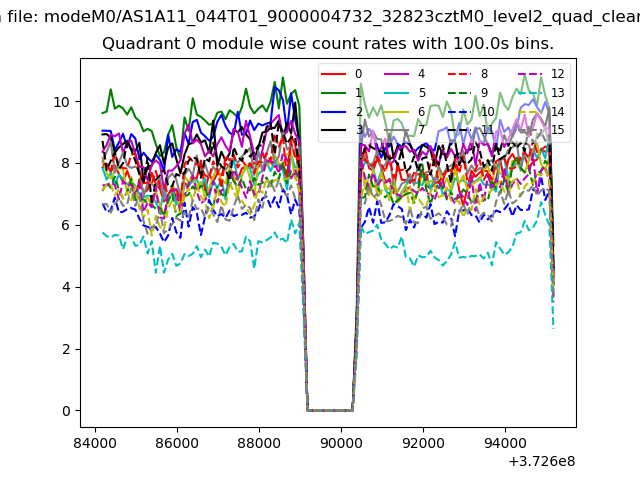
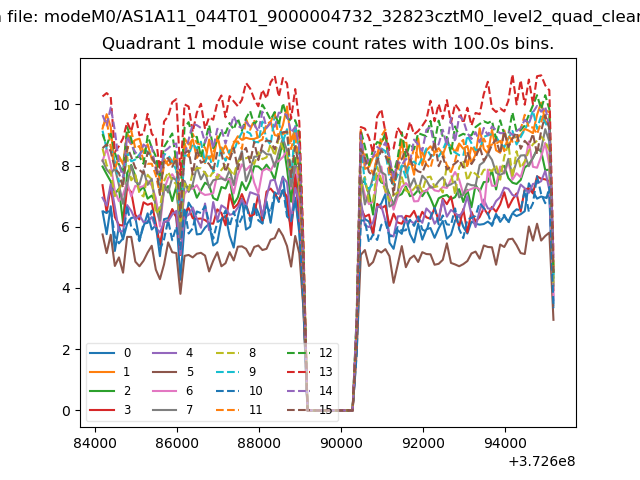
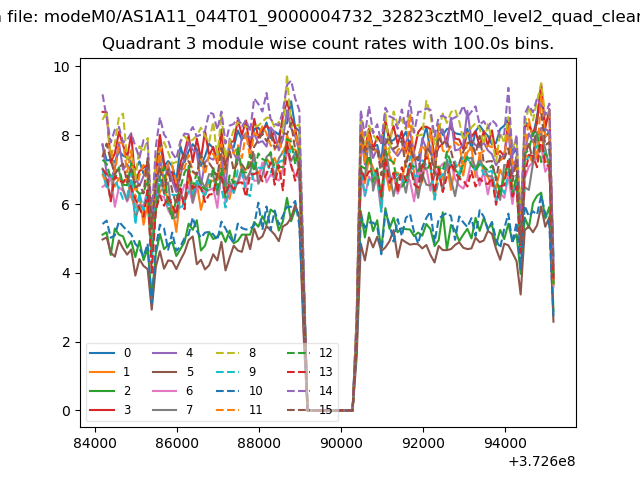
| Module-wise count rates for Quadrant A Data is divided into 100 sec bins |
 |
 |
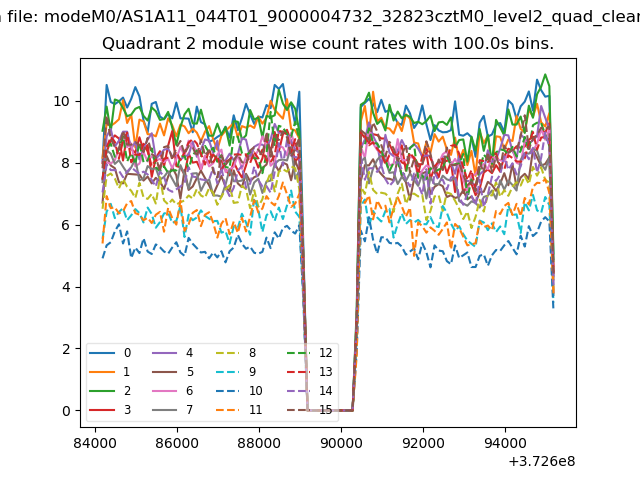
| Module-wise count rates for Quadrant B Data is divided into 100 sec bins |
 |
 |
| Module-wise count rates for Quadrant C Data is divided into 100 sec bins |
 |
 |
| Module-wise count rates for Quadrant D Data is divided into 100 sec bins |
 |
 |
| Parameter | Plot |
|---|---|
| CZT HV Monitor | 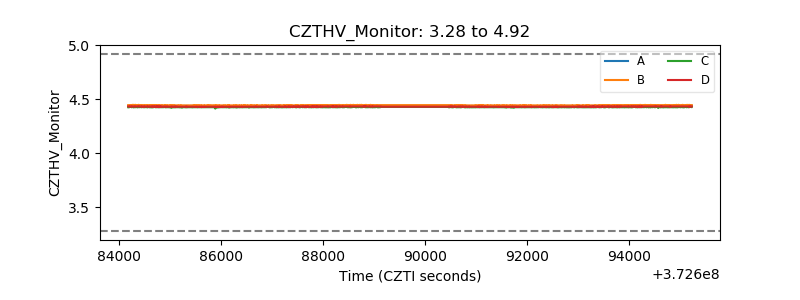 |
| D_VDD | 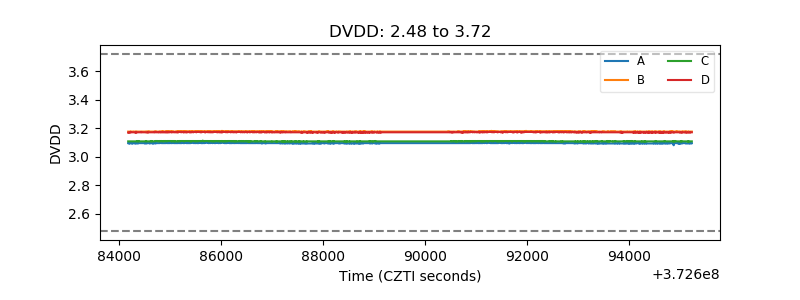 |
| Temperature 1 | 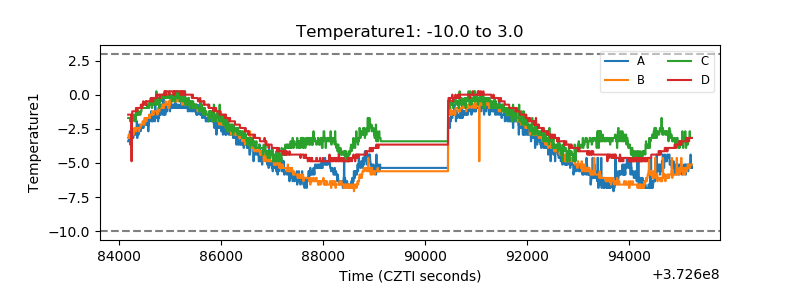 |
| Veto HV Monitor | 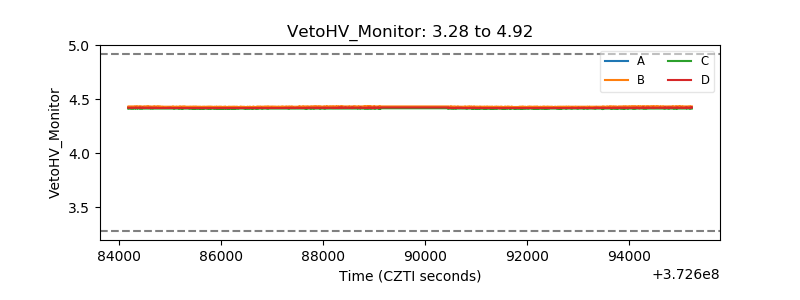 |
| Veto LLD | 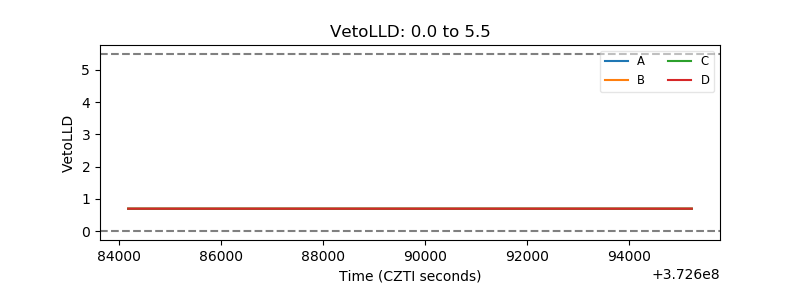 |
| Alpha Counter | 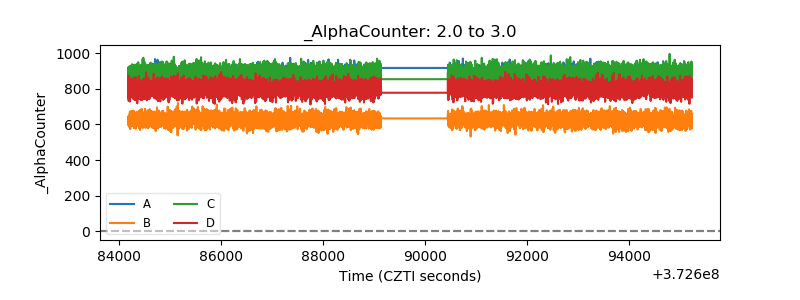 |
| _CPM_Rate | 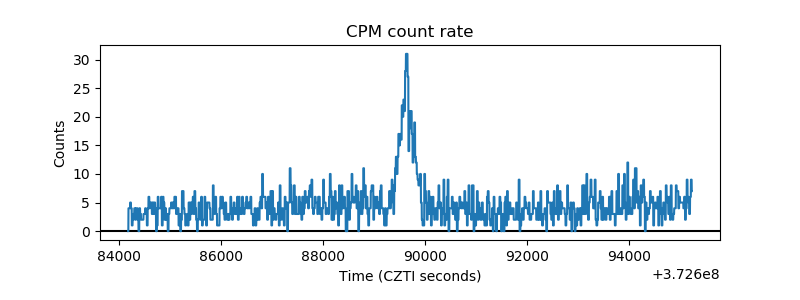 |
| CZT Counter | 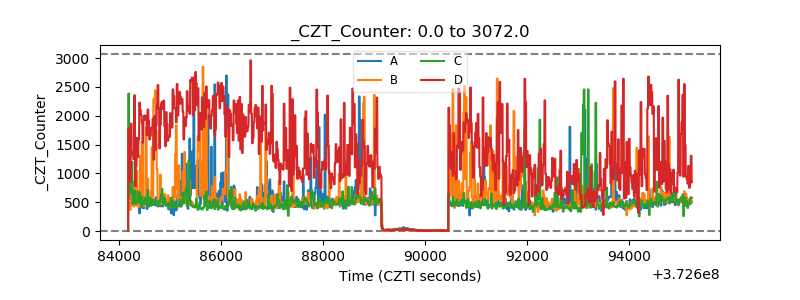 |
| +2.5 Volts monitor |  |
| +5 Volts monitor |  |
| _ROLL_ROT | 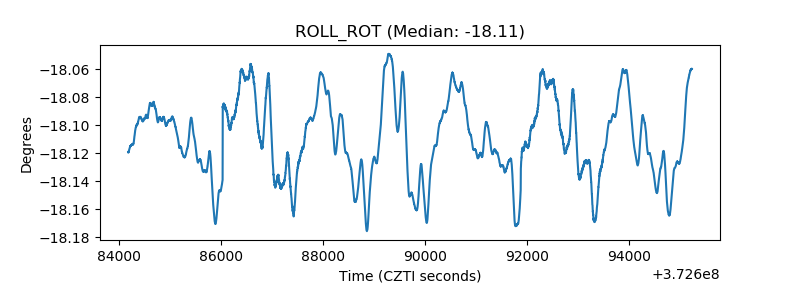 |
| _Roll_DEC | 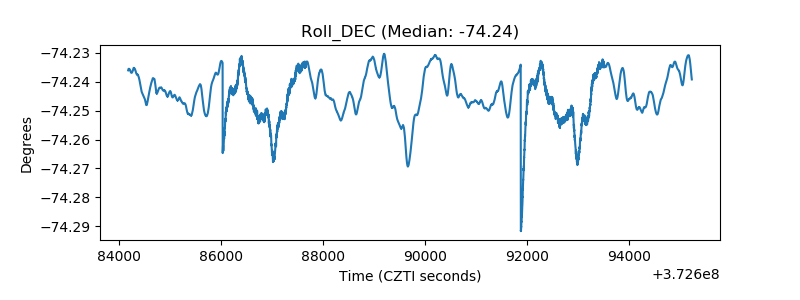 |
| _Roll_RA | 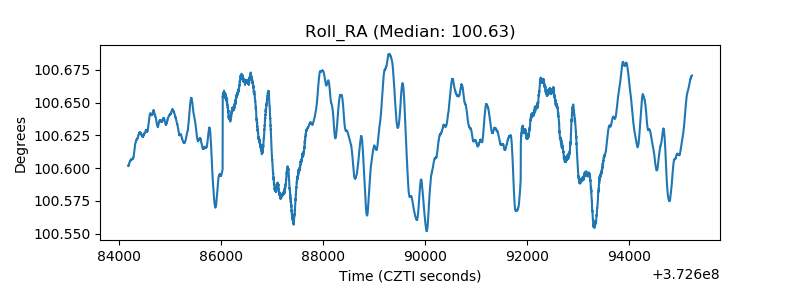 |
| Veto Counter |  |