| Param | Original file | Final file |
|---|---|---|
| Filename | modeM0/AS1C06_002T09_9000004734_32825cztM0_level2.evt | modeM0/AS1C06_002T09_9000004734_32825cztM0_level2_quad_clean.evt |
| Size (bytes) | 283,435,200 | 54,408,960 |
| Size | 270.3 MB | 51.9 MB |
| Events in quadrant A | 1,629,412 | 364,226 |
| Events in quadrant B | 1,633,970 | 367,937 |
| Events in quadrant C | 1,590,312 | 364,179 |
| Events in quadrant D | 3,516,342 | 328,346 |
| Mode M9 | |||
|---|---|---|---|
| Quadrant | BADHDUFLAG | Total packets | Discarded packets |
| A | 0 | 17 | 0 |
| B | 0 | 17 | 0 |
| C | 0 | 17 | 0 |
| D | 0 | 17 | 0 |
| Mode M0 | |||
|---|---|---|---|
| Quadrant | BADHDUFLAG | Total packets | Discarded packets |
| A | 0 | 6847 | 2 |
| B | 0 | 6879 | 1 |
| C | 0 | 6732 | 1 |
| D | 0 | 12719 | 1 |
| Mode SS | |||
|---|---|---|---|
| Quadrant | BADHDUFLAG | Total packets | Discarded packets |
| A | 0 | 64 | 0 |
| B | 0 | 64 | 0 |
| C | 0 | 64 | 0 |
| D | 0 | 64 | 0 |
| Quadrant | Total seconds | Saturated seconds | Saturation percentage |
|---|---|---|---|
| A | 3133 | 14 | 0.446856% |
| B | 3133 | 18 | 0.574529% |
| C | 3133 | 21 | 0.670284% |
| D | 3133 | 306 | 9.766996% |
Noise dominated data is calculated using 1-second bins in cleaned event files. If a bin has >2000 counts, and if more than 50% of those come from <1% of pixels, then it is considered to be noise-dominated and hence unusable.
| Quadrant | # 1 sec bins | Bins with >0 counts | Bins with >2000 counts | High rate bins dominated by noise | Noise dominated (total time) | Noise dominated (detector-on time) | Marked lightcurve |
|---|---|---|---|---|---|---|---|
| A | 4835 | 3134 | 10 | 10 | 0.21% | 0.32% | 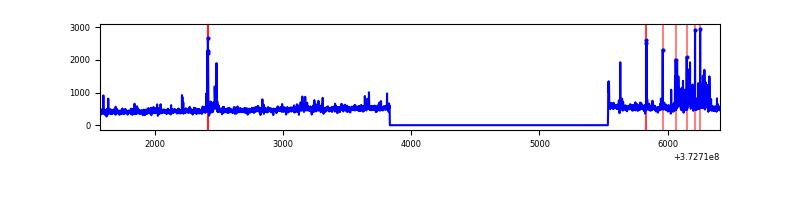 |
| B | 4835 | 3134 | 10 | 10 | 0.21% | 0.32% | 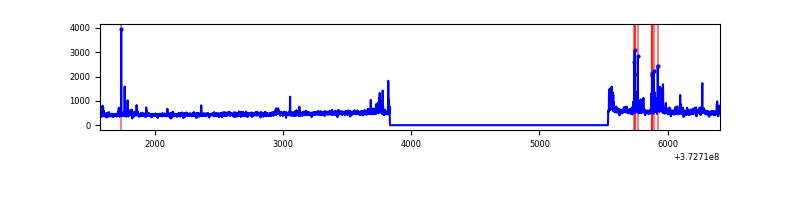 |
| C | 4835 | 3134 | 15 | 15 | 0.31% | 0.48% | 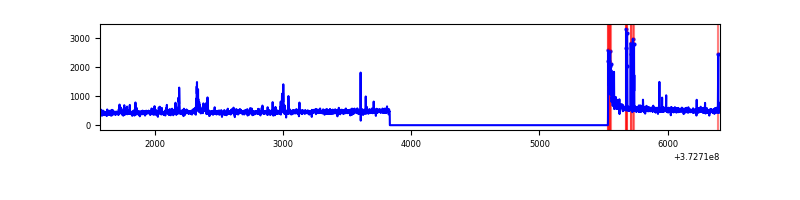 |
| D | 4835 | 3134 | 262 | 262 | 5.42% | 8.36% | 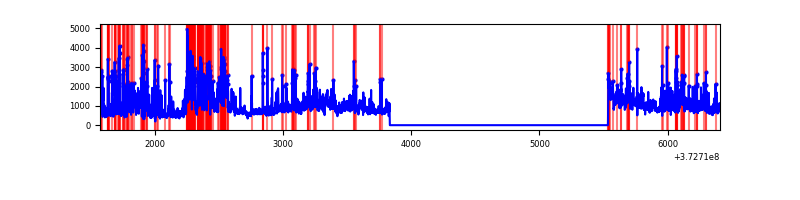 |
Top three noisy pixels from each quadrant. If the there are fewer than three noisy pixels in the level2.evt file, extra rows are filled as -1
| Pixel properties | Quadrant properties | ||||||
|---|---|---|---|---|---|---|---|
| Quadrant | DetID | PixID | Counts | Sigma | Mean | Median | Sigma |
| A | 14 | 238 | 75639 | 974.63 | 376 | 368 | 77.2 |
| A | 14 | 63 | 66097 | 851.08 | 376 | 368 | 77.2 |
| A | 15 | 17 | 20865 | 265.4 | 376 | 368 | 77.2 |
| B | 15 | 54 | 42136 | 579.85 | 375 | 366 | 72.0 |
| B | 0 | 219 | 36957 | 507.96 | 375 | 366 | 72.0 |
| B | 5 | 172 | 23941 | 327.27 | 375 | 366 | 72.0 |
| C | 0 | 10 | 82229 | 969.79 | 361 | 363 | 84.4 |
| C | 3 | 233 | 30396 | 355.77 | 361 | 363 | 84.4 |
| C | 14 | 67 | 21167 | 246.45 | 361 | 363 | 84.4 |
| D | 8 | 195 | 770301 | 9201.02 | 347 | 339 | 83.7 |
| D | 12 | 6 | 677187 | 8088.31 | 347 | 339 | 83.7 |
| D | 2 | 250 | 200200 | 2388.33 | 347 | 339 | 83.7 |
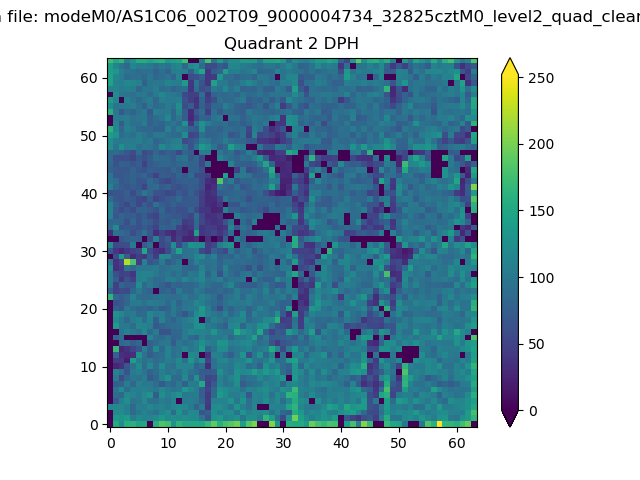
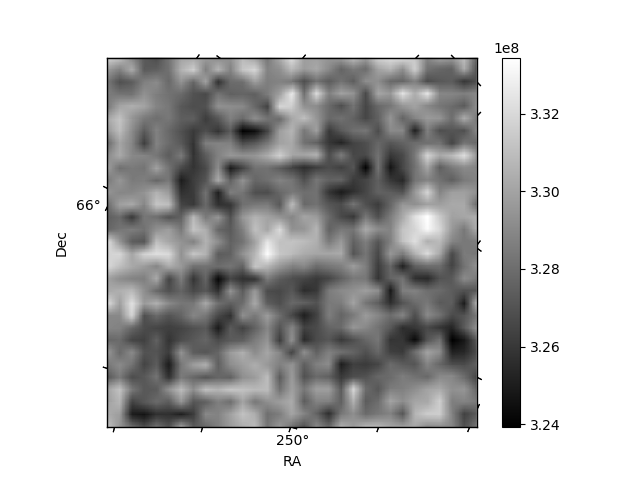
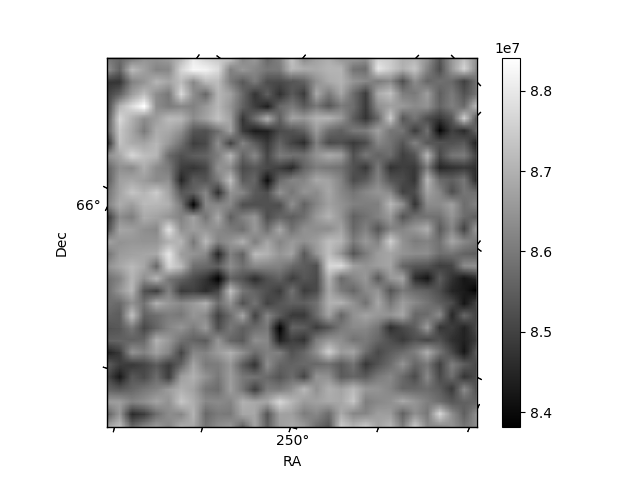
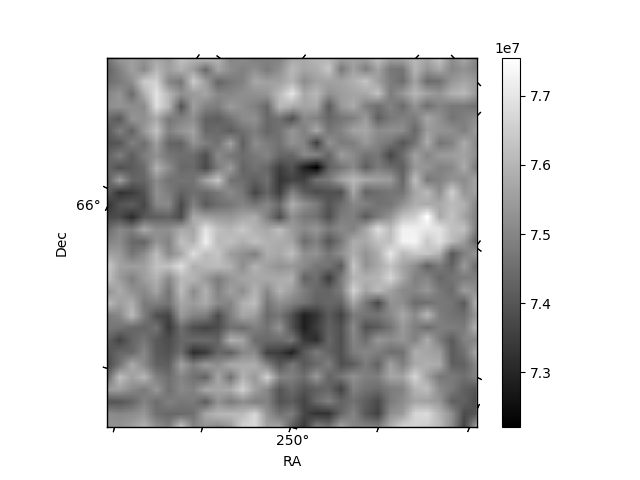
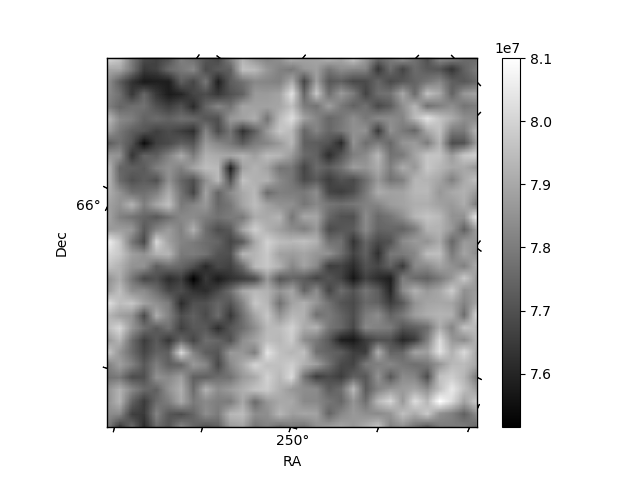
Histogram calculated using DETX and DETY for each event in the final _common_clean file
| Quadrant A | 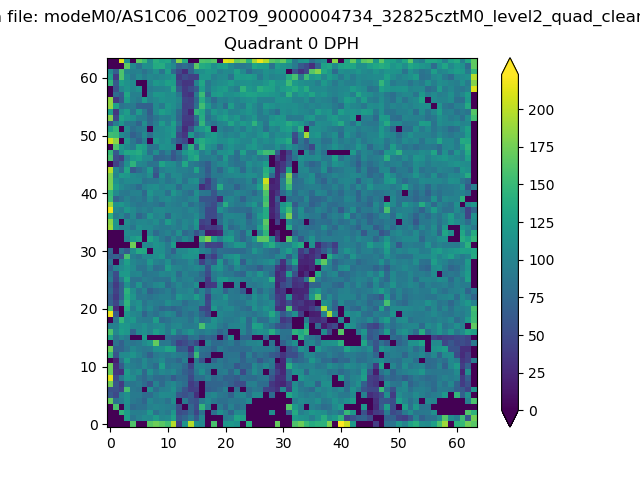 |
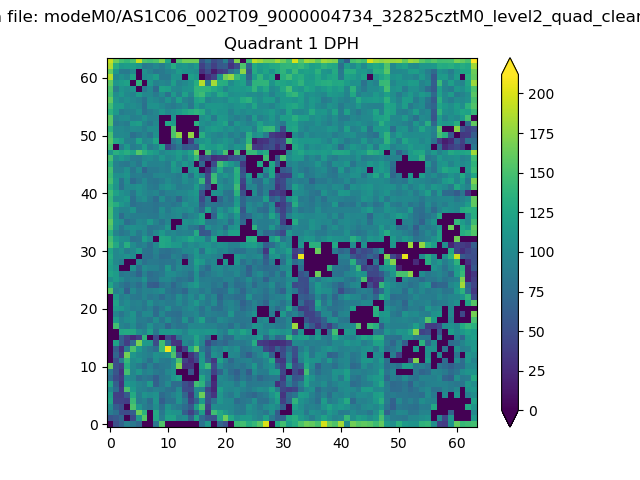 |
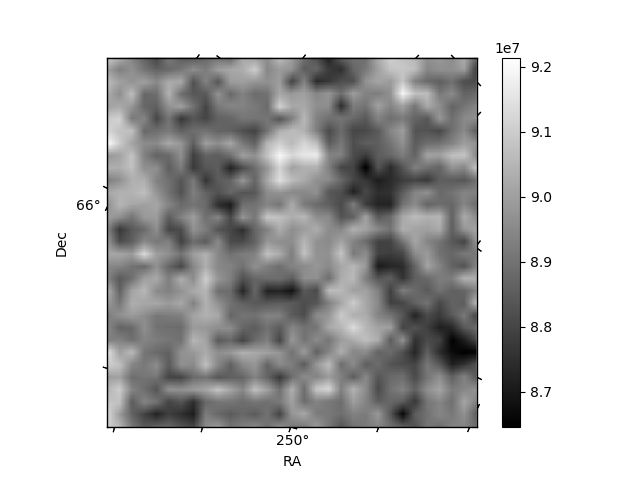
Quadrant B |
|---|---|---|---|
| Quadrant D | 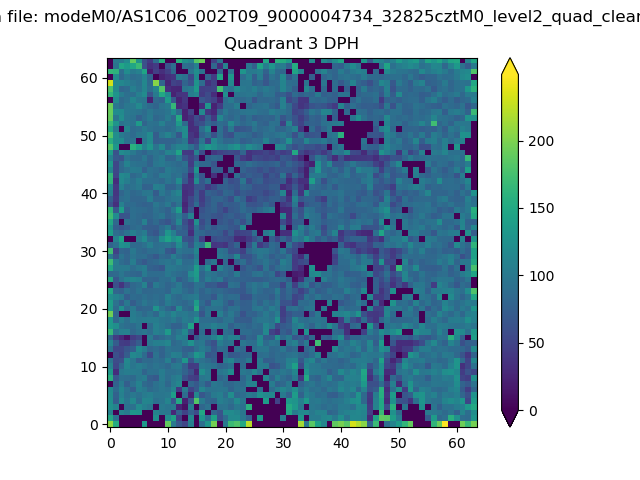 |
 |
Quadrant C |
| Plot type | Count rate plots | Images |
|---|---|---|
| Comparison with Poisson distribution Blue bars denote a histogram of data divided into 1 sec bins. Red curve is a Poisson curve with rate = median count rate of data. |
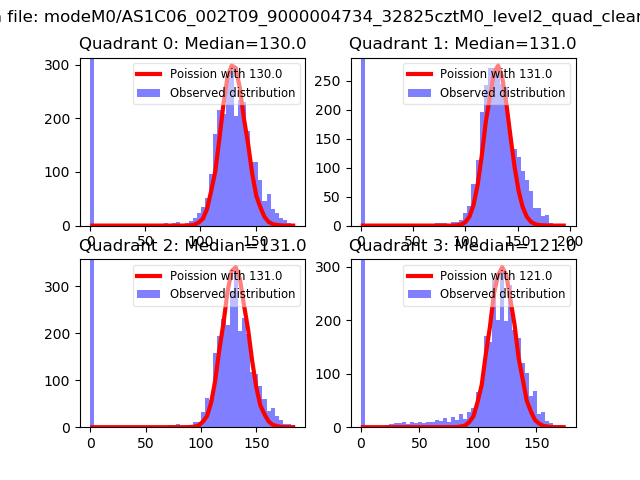 |
 |
| Quadrant-wise count rates Data is divided into 100 sec bins |
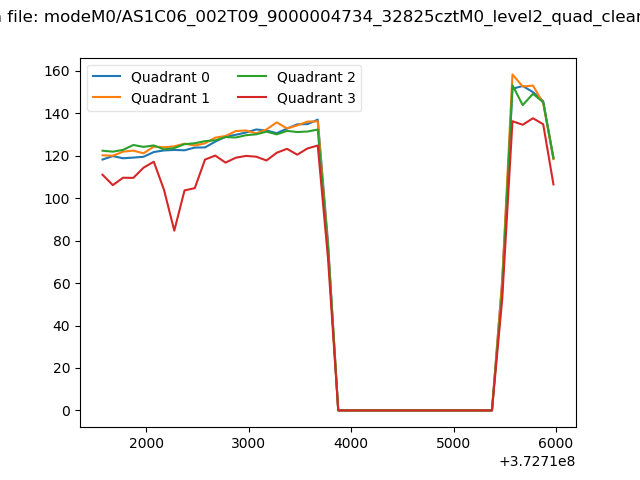 |
|
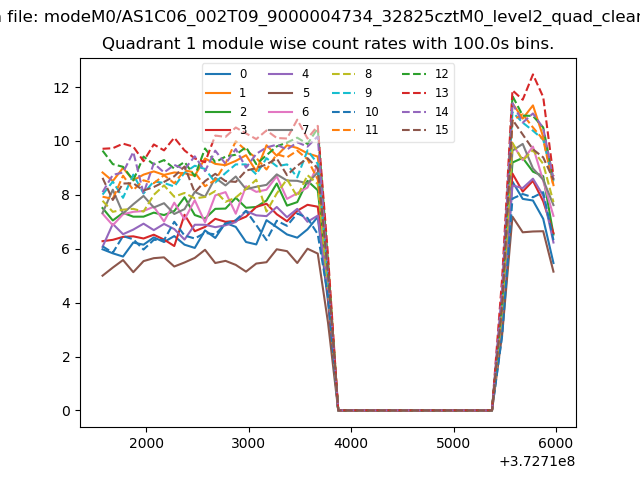
| Module-wise count rates for Quadrant A Data is divided into 100 sec bins |
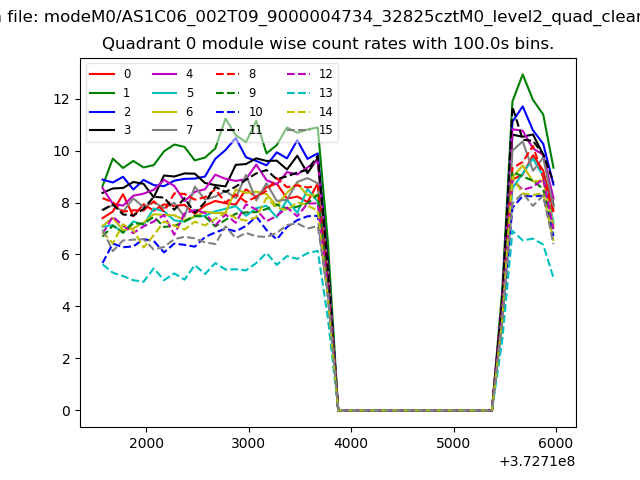 |
 |
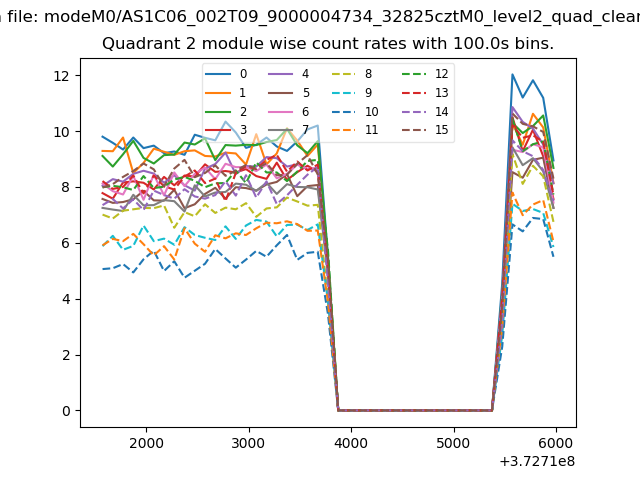
| Module-wise count rates for Quadrant B Data is divided into 100 sec bins |
 |
 |
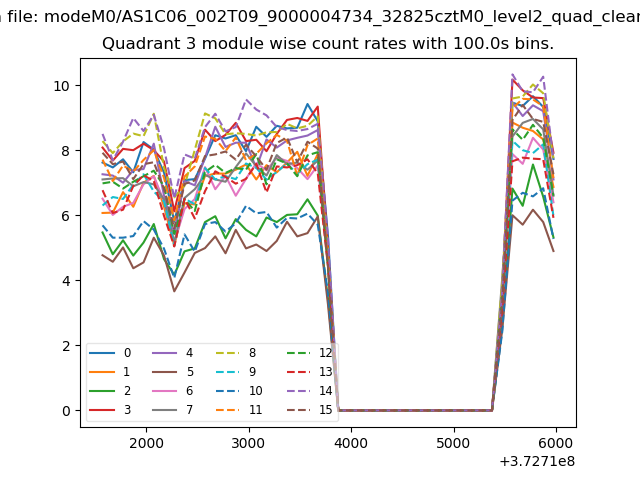
| Module-wise count rates for Quadrant C Data is divided into 100 sec bins |
 |
 |
| Module-wise count rates for Quadrant D Data is divided into 100 sec bins |
 |
 |
| Parameter | Plot |
|---|---|
| CZT HV Monitor |  |
| D_VDD | 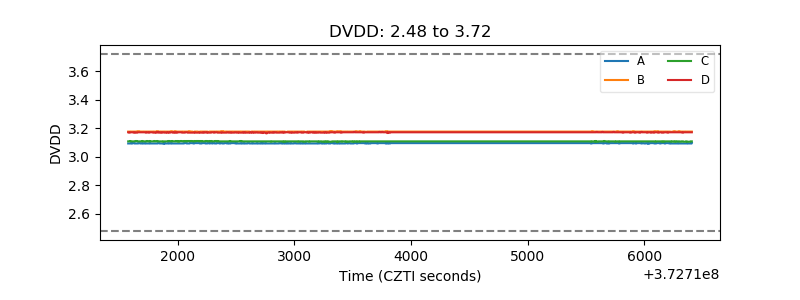 |
| Temperature 1 |  |
| Veto HV Monitor | 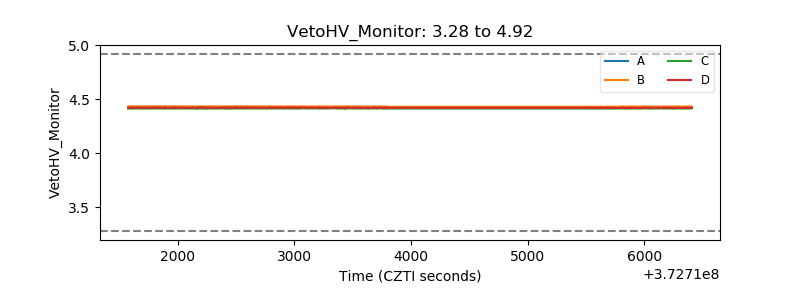 |
| Veto LLD |  |
| Alpha Counter | 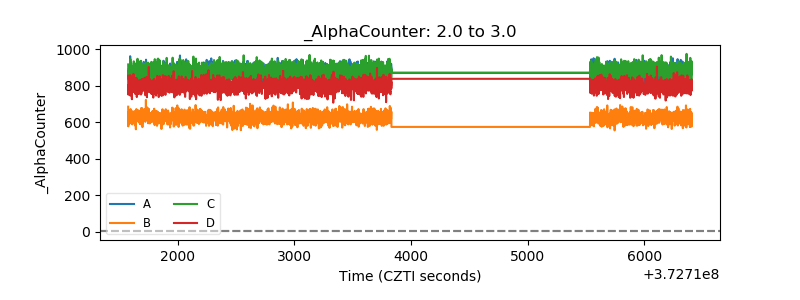 |
| _CPM_Rate | 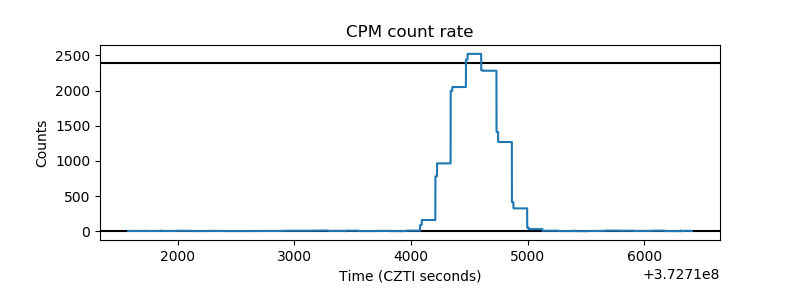 |
| CZT Counter | 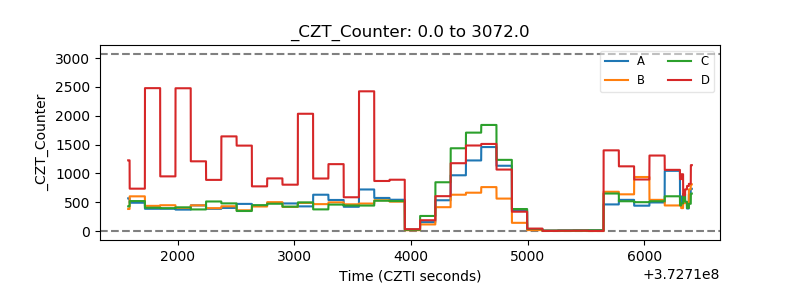 |
| +2.5 Volts monitor |  |
| +5 Volts monitor |  |
| _ROLL_ROT | 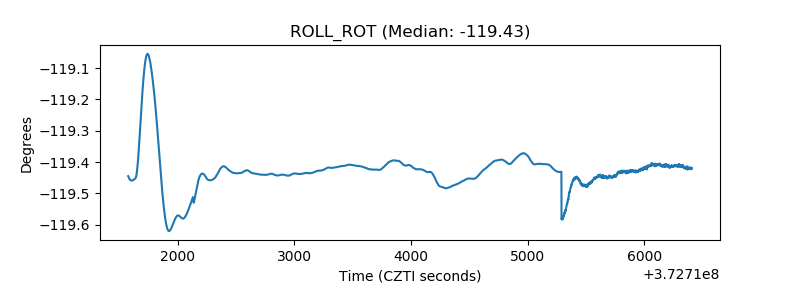 |
| _Roll_DEC | 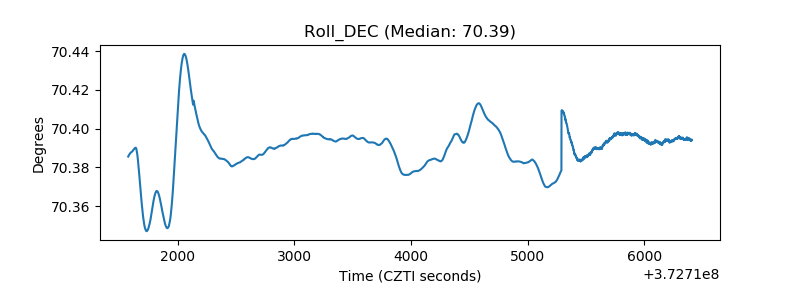 |
| _Roll_RA | 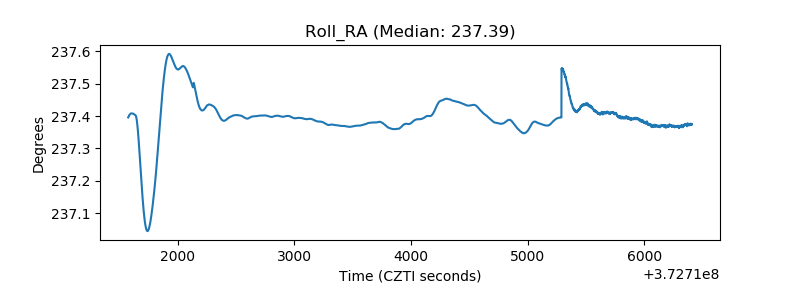 |
| Veto Counter | 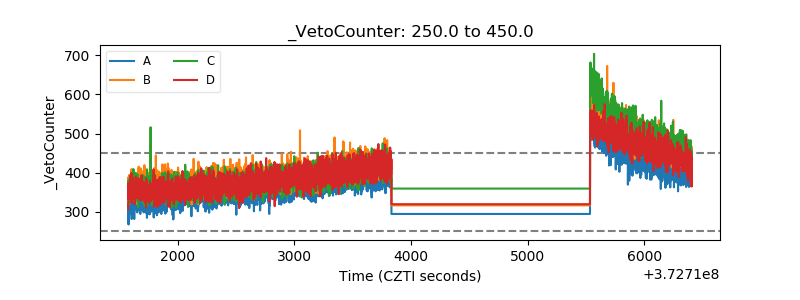 |