| Param | Original file | Final file |
|---|---|---|
| Filename | modeM0/AS1C06_002T09_9000004734_32827cztM0_level2.evt | modeM0/AS1C06_002T09_9000004734_32827cztM0_level2_quad_clean.evt |
| Size (bytes) | 496,537,920 | 80,550,720 |
| Size | 473.5 MB | 76.8 MB |
| Events in quadrant A | 3,045,226 | 522,705 |
| Events in quadrant B | 3,138,322 | 526,997 |
| Events in quadrant C | 2,716,742 | 530,949 |
| Events in quadrant D | 5,768,552 | 477,322 |
| Mode M9 | |||
|---|---|---|---|
| Quadrant | BADHDUFLAG | Total packets | Discarded packets |
| A | 0 | 32 | 0 |
| B | 0 | 32 | 0 |
| C | 0 | 32 | 0 |
| D | 0 | 33 | 0 |
| Mode M0 | |||
|---|---|---|---|
| Quadrant | BADHDUFLAG | Total packets | Discarded packets |
| A | 0 | 12606 | 3 |
| B | 0 | 12838 | 2 |
| C | 0 | 11567 | 2 |
| D | 0 | 21029 | 2 |
| Mode SS | |||
|---|---|---|---|
| Quadrant | BADHDUFLAG | Total packets | Discarded packets |
| A | 0 | 110 | 0 |
| B | 0 | 110 | 0 |
| C | 0 | 110 | 0 |
| D | 0 | 110 | 0 |
| Quadrant | Total seconds | Saturated seconds | Saturation percentage |
|---|---|---|---|
| A | 5447 | 74 | 1.358546% |
| B | 5447 | 114 | 2.092895% |
| C | 5447 | 32 | 0.587479% |
| D | 5447 | 478 | 8.775473% |
Noise dominated data is calculated using 1-second bins in cleaned event files. If a bin has >2000 counts, and if more than 50% of those come from <1% of pixels, then it is considered to be noise-dominated and hence unusable.
| Quadrant | # 1 sec bins | Bins with >0 counts | Bins with >2000 counts | High rate bins dominated by noise | Noise dominated (total time) | Noise dominated (detector-on time) | Marked lightcurve |
|---|---|---|---|---|---|---|---|
| A | 7270 | 5448 | 48 | 48 | 0.66% | 0.88% | 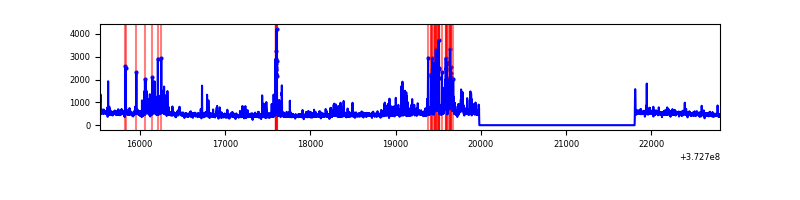 |
| B | 7270 | 5448 | 68 | 68 | 0.94% | 1.25% | 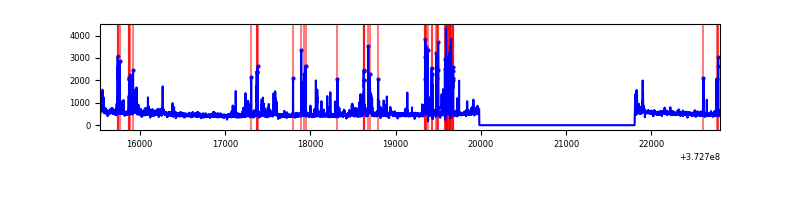 |
| C | 7270 | 5448 | 21 | 21 | 0.29% | 0.39% | 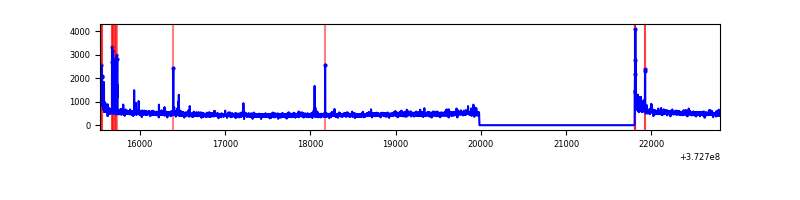 |
| D | 7270 | 5448 | 413 | 413 | 5.68% | 7.58% | 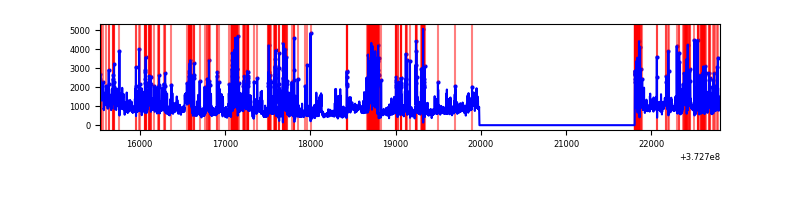 |
Top three noisy pixels from each quadrant. If the there are fewer than three noisy pixels in the level2.evt file, extra rows are filled as -1
| Pixel properties | Quadrant properties | ||||||
|---|---|---|---|---|---|---|---|
| Quadrant | DetID | PixID | Counts | Sigma | Mean | Median | Sigma |
| A | 14 | 238 | 348979 | 2729.91 | 643 | 633 | 127.6 |
| A | 12 | 16 | 70977 | 551.27 | 643 | 633 | 127.6 |
| A | 14 | 63 | 66713 | 517.85 | 643 | 633 | 127.6 |
| B | 5 | 172 | 376293 | 3084.79 | 648 | 633 | 121.8 |
| B | 0 | 219 | 61481 | 499.66 | 648 | 633 | 121.8 |
| B | 15 | 54 | 49536 | 401.57 | 648 | 633 | 121.8 |
| C | 0 | 10 | 124756 | 835.05 | 638 | 643 | 148.6 |
| C | 14 | 67 | 41523 | 275.05 | 638 | 643 | 148.6 |
| C | 1 | 23 | 28077 | 184.58 | 638 | 643 | 148.6 |
| D | 8 | 195 | 1287800 | 8881.69 | 604 | 592 | 144.9 |
| D | 12 | 6 | 823889 | 5680.72 | 604 | 592 | 144.9 |
| D | 2 | 250 | 456442 | 3145.35 | 604 | 592 | 144.9 |
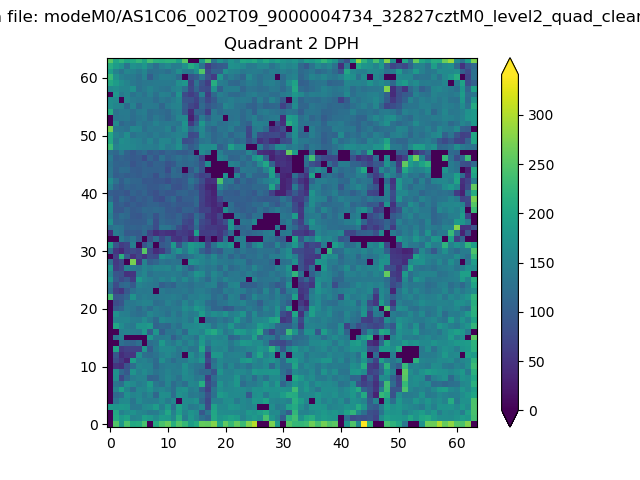
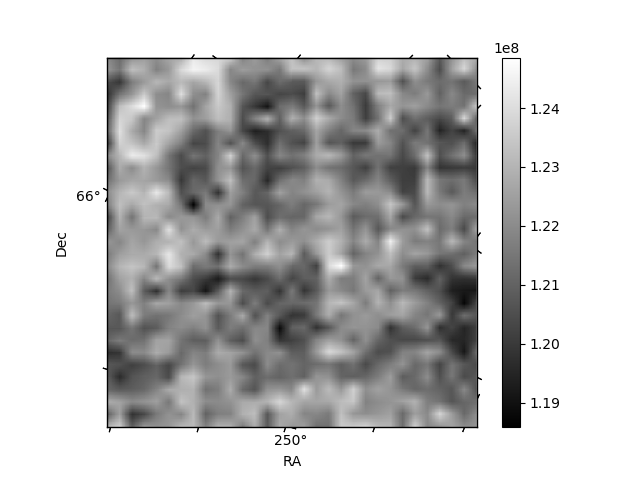
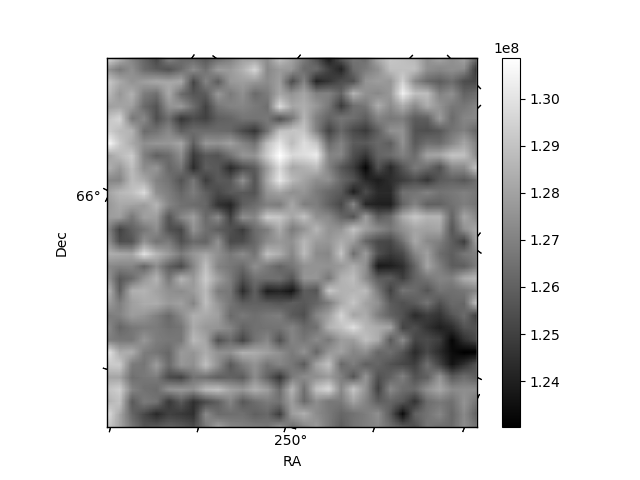
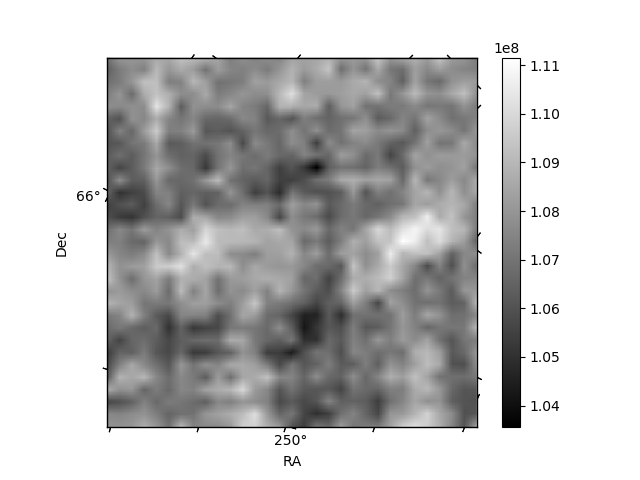
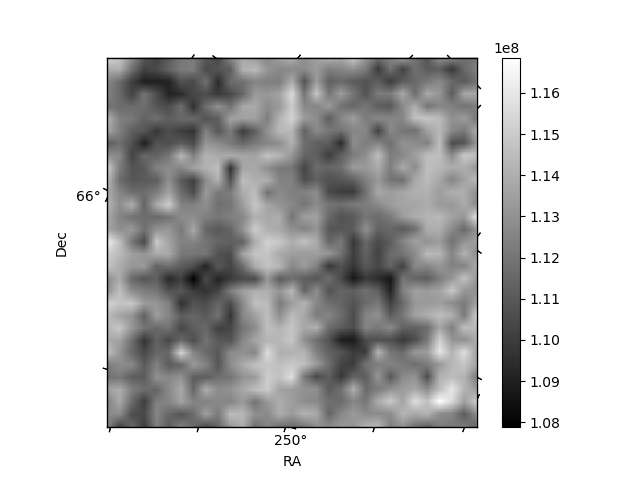
Histogram calculated using DETX and DETY for each event in the final _common_clean file
| Quadrant A | 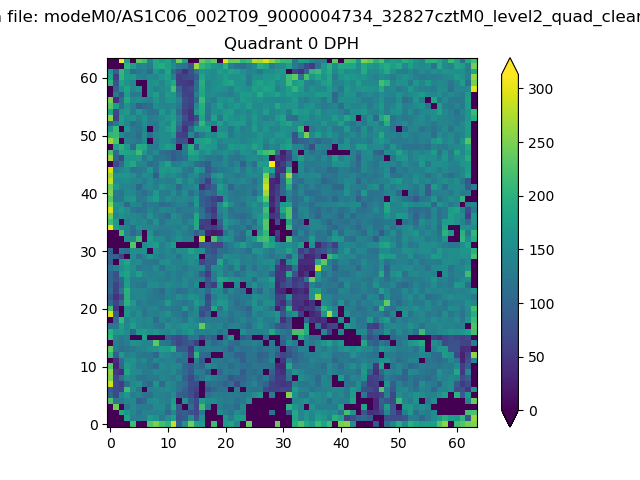 |
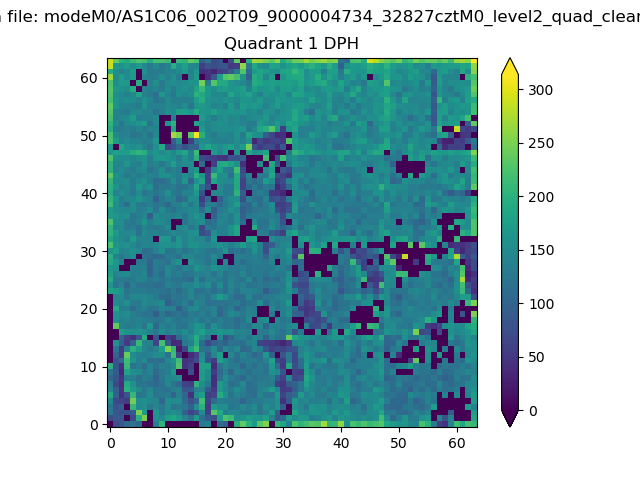 |
Quadrant B |
|---|---|---|---|
| Quadrant D | 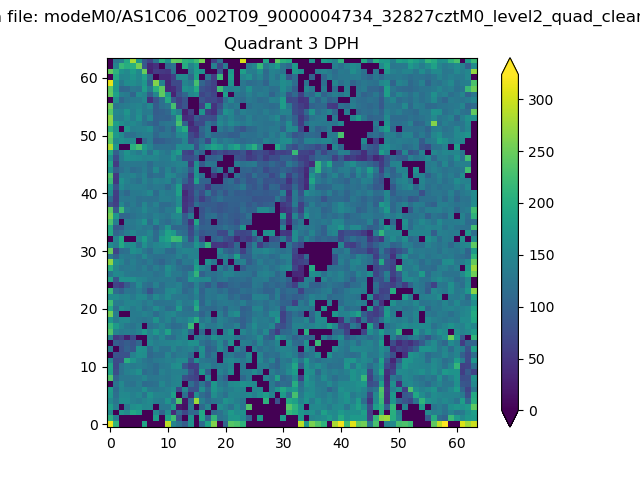 |
 |
Quadrant C |
| Plot type | Count rate plots | Images |
|---|---|---|
| Comparison with Poisson distribution Blue bars denote a histogram of data divided into 1 sec bins. Red curve is a Poisson curve with rate = median count rate of data. |
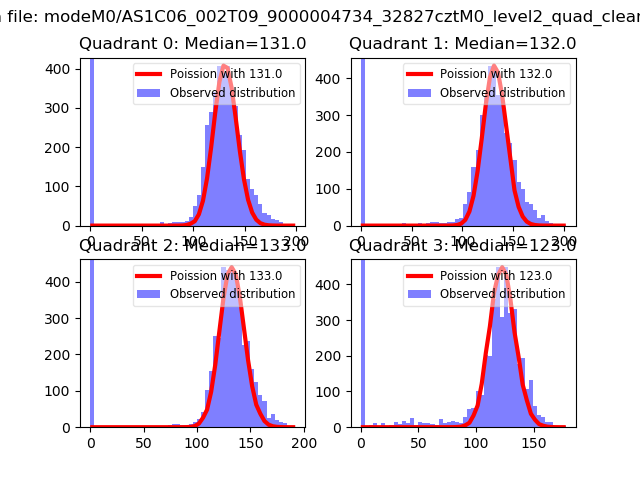 |
 |
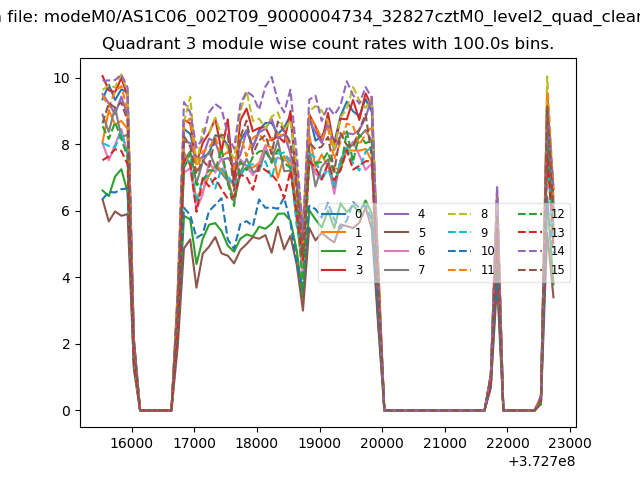
| Quadrant-wise count rates Data is divided into 100 sec bins |
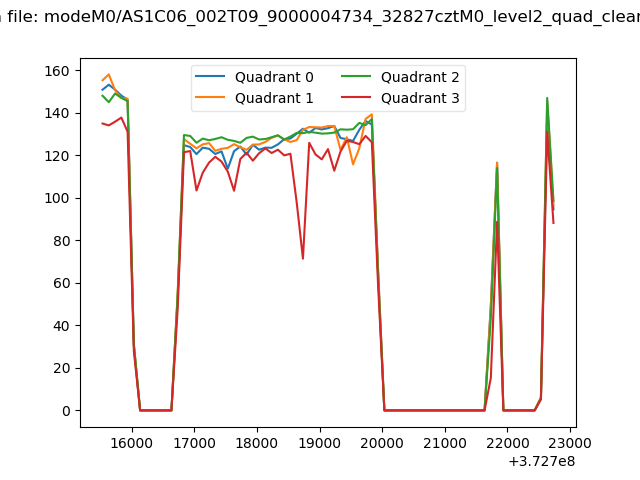 |
|
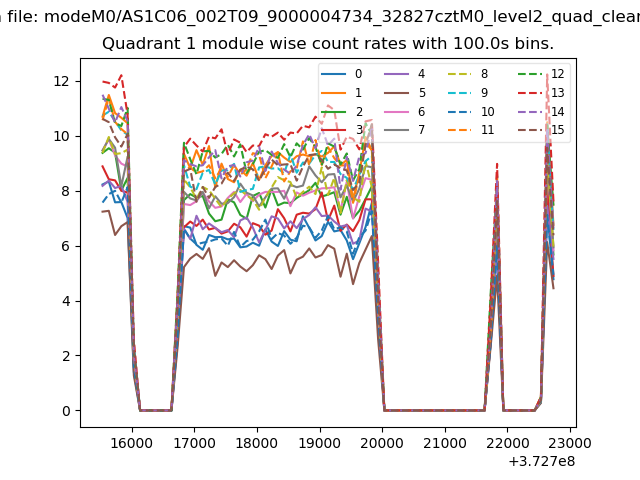
| Module-wise count rates for Quadrant A Data is divided into 100 sec bins |
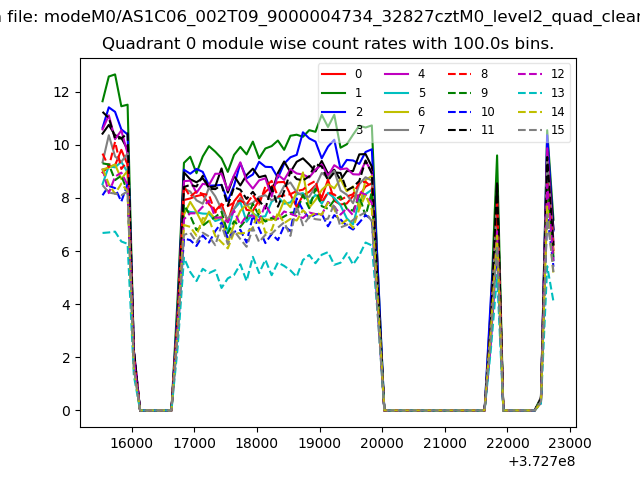 |
 |
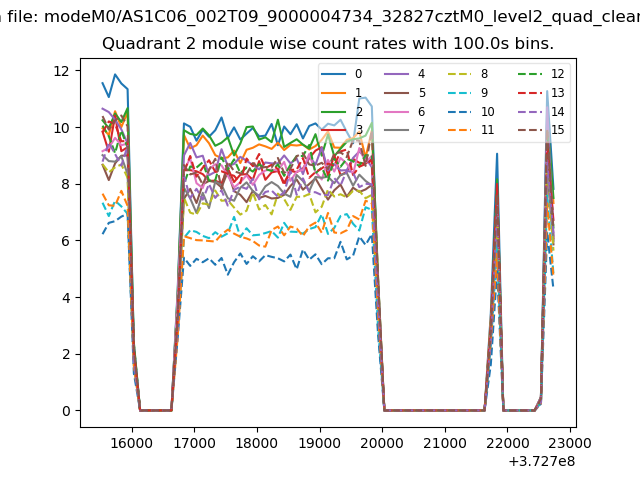
| Module-wise count rates for Quadrant B Data is divided into 100 sec bins |
 |
 |
| Module-wise count rates for Quadrant C Data is divided into 100 sec bins |
 |
 |
| Module-wise count rates for Quadrant D Data is divided into 100 sec bins |
 |
 |
| Parameter | Plot |
|---|---|
| CZT HV Monitor | 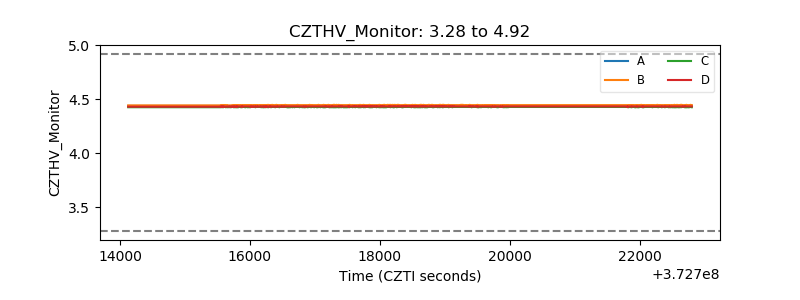 |
| D_VDD | 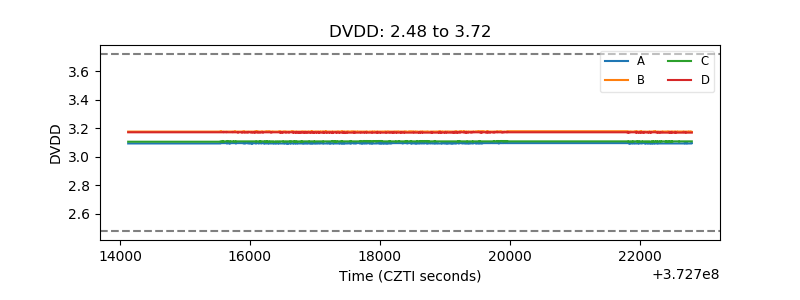 |
| Temperature 1 | 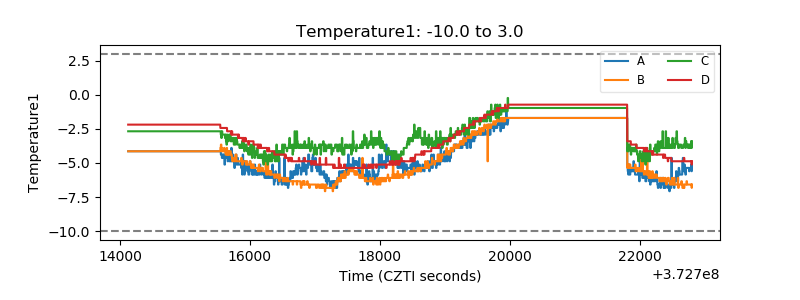 |
| Veto HV Monitor | 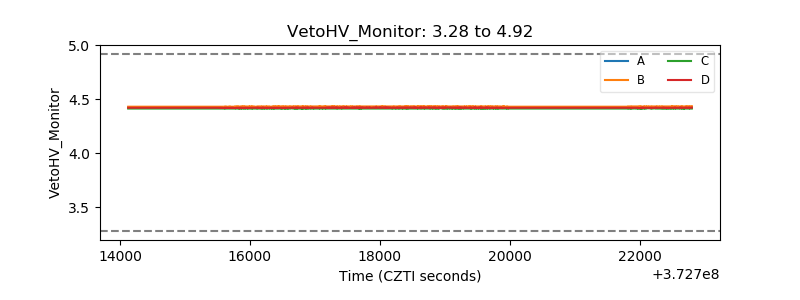 |
| Veto LLD |  |
| Alpha Counter | 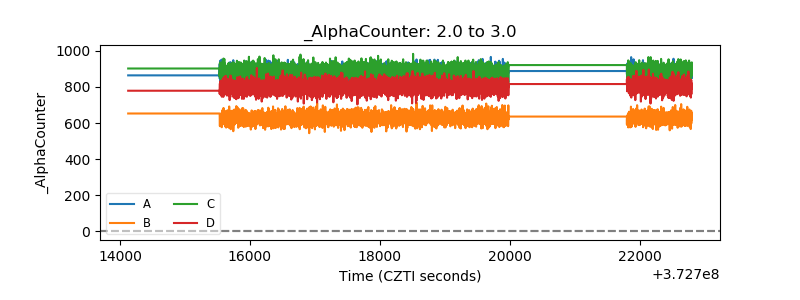 |
| _CPM_Rate | 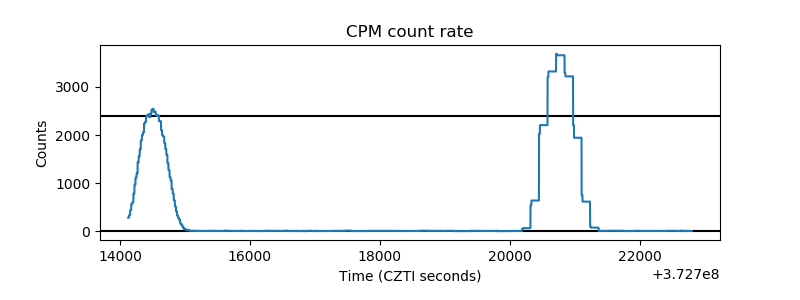 |
| CZT Counter | 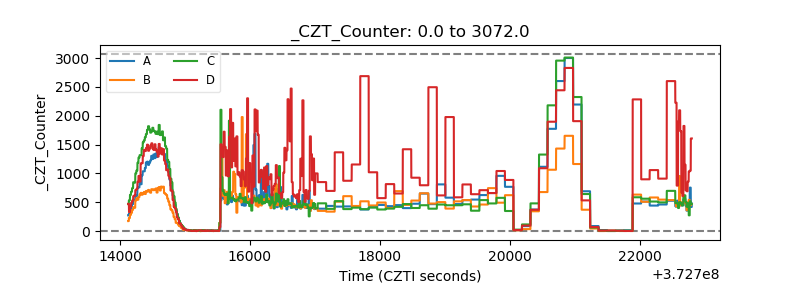 |
| +2.5 Volts monitor |  |
| +5 Volts monitor | 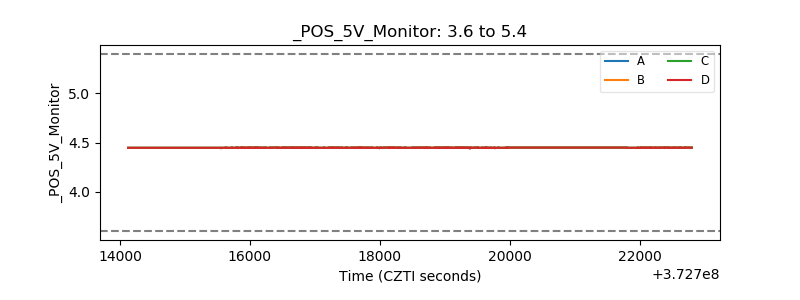 |
| _ROLL_ROT | 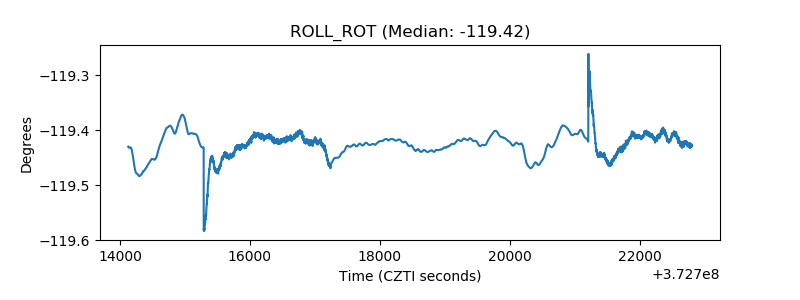 |
| _Roll_DEC | 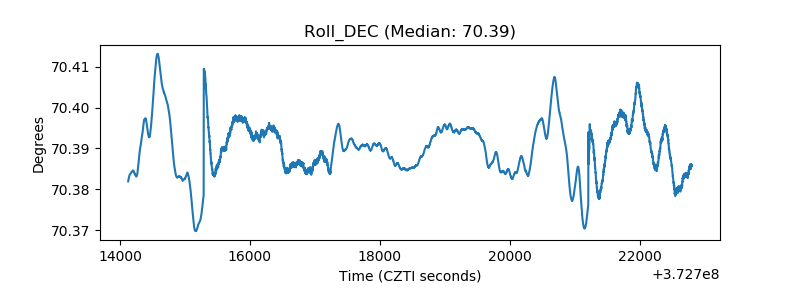 |
| _Roll_RA | 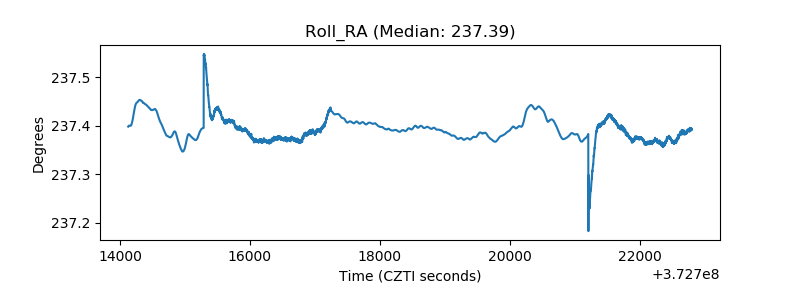 |
| Veto Counter | 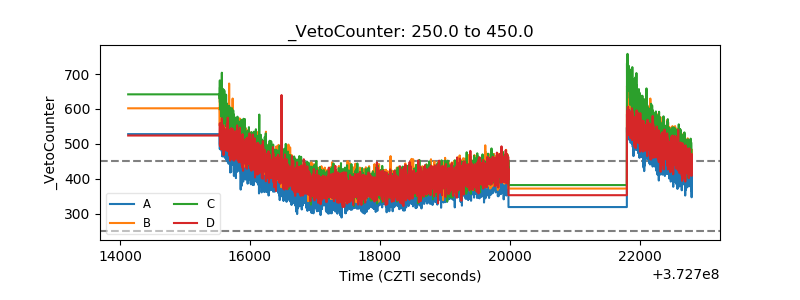 |