| Param | Original file | Final file |
|---|---|---|
| Filename | modeM0/AS1C06_002T09_9000004734_32830cztM0_level2.evt | modeM0/AS1C06_002T09_9000004734_32830cztM0_level2_quad_clean.evt |
| Size (bytes) | 584,778,240 | 102,104,640 |
| Size | 557.7 MB | 97.4 MB |
| Events in quadrant A | 2,852,585 | 731,620 |
| Events in quadrant B | 3,593,588 | 733,482 |
| Events in quadrant C | 2,659,398 | 729,484 |
| Events in quadrant D | 8,260,212 | 540,325 |
| Mode M9 | |||
|---|---|---|---|
| Quadrant | BADHDUFLAG | Total packets | Discarded packets |
| A | 0 | 29 | 0 |
| B | 0 | 29 | 0 |
| C | 0 | 29 | 0 |
| D | 0 | 30 | 0 |
| Mode M0 | |||
|---|---|---|---|
| Quadrant | BADHDUFLAG | Total packets | Discarded packets |
| A | 0 | 11572 | 3 |
| B | 0 | 13924 | 2 |
| C | 0 | 11074 | 2 |
| D | 0 | 28102 | 2 |
| Mode SS | |||
|---|---|---|---|
| Quadrant | BADHDUFLAG | Total packets | Discarded packets |
| A | 0 | 104 | 0 |
| B | 0 | 104 | 0 |
| C | 0 | 104 | 0 |
| D | 0 | 104 | 0 |
| Quadrant | Total seconds | Saturated seconds | Saturation percentage |
|---|---|---|---|
| A | 5086 | 92 | 1.808887% |
| B | 5086 | 274 | 5.387338% |
| C | 5086 | 57 | 1.120724% |
| D | 5086 | 1917 | 37.691703% |
Noise dominated data is calculated using 1-second bins in cleaned event files. If a bin has >2000 counts, and if more than 50% of those come from <1% of pixels, then it is considered to be noise-dominated and hence unusable.
| Quadrant | # 1 sec bins | Bins with >0 counts | Bins with >2000 counts | High rate bins dominated by noise | Noise dominated (total time) | Noise dominated (detector-on time) | Marked lightcurve |
|---|---|---|---|---|---|---|---|
| A | 7210 | 5087 | 55 | 55 | 0.76% | 1.08% |  |
| B | 7210 | 5087 | 172 | 172 | 2.39% | 3.38% |  |
| C | 7210 | 5087 | 34 | 34 | 0.47% | 0.67% | 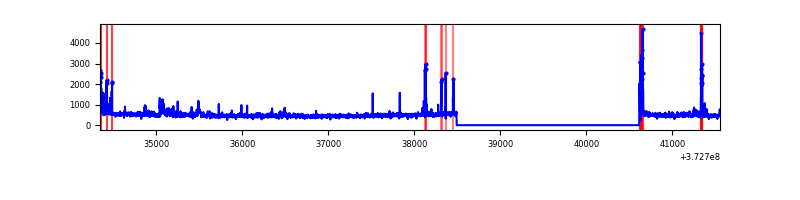 |
| D | 7210 | 5087 | 1818 | 1818 | 25.21% | 35.74% |  |
Top three noisy pixels from each quadrant. If the there are fewer than three noisy pixels in the level2.evt file, extra rows are filled as -1
| Pixel properties | Quadrant properties | ||||||
|---|---|---|---|---|---|---|---|
| Quadrant | DetID | PixID | Counts | Sigma | Mean | Median | Sigma |
| A | 14 | 238 | 295031 | 2391.39 | 622 | 612 | 123.1 |
| A | 14 | 239 | 106803 | 862.53 | 622 | 612 | 123.1 |
| A | 9 | 143 | 19203 | 151.0 | 622 | 612 | 123.1 |
| B | 5 | 172 | 755054 | 6523.93 | 616 | 601 | 115.6 |
| B | 0 | 219 | 236839 | 2042.8 | 616 | 601 | 115.6 |
| B | 0 | 229 | 59000 | 504.99 | 616 | 601 | 115.6 |
| C | 0 | 10 | 150378 | 1103.58 | 598 | 604 | 135.7 |
| C | 9 | 160 | 99767 | 730.66 | 598 | 604 | 135.7 |
| C | 1 | 241 | 38356 | 278.17 | 598 | 604 | 135.7 |
| D | 7 | 80 | 4605559 | 38723.51 | 494 | 482 | 118.9 |
| D | 8 | 195 | 810592 | 6812.11 | 494 | 482 | 118.9 |
| D | 2 | 250 | 387044 | 3250.55 | 494 | 482 | 118.9 |
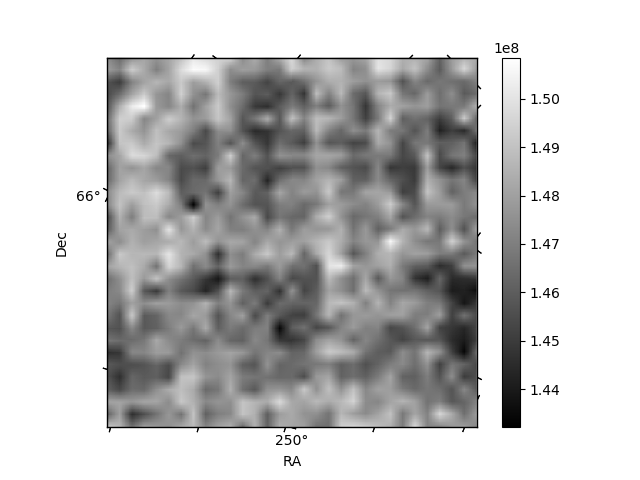
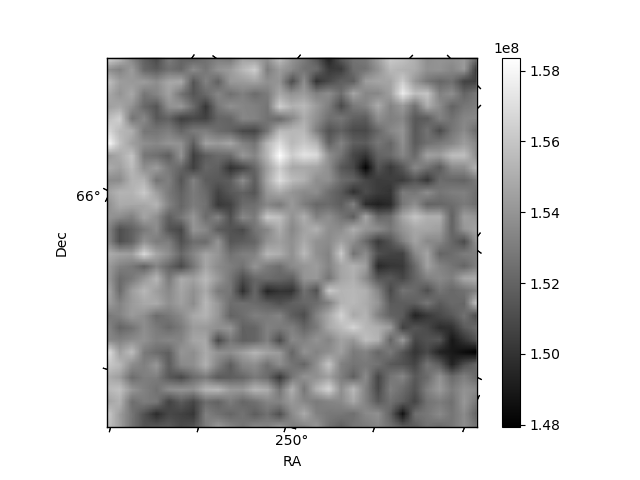
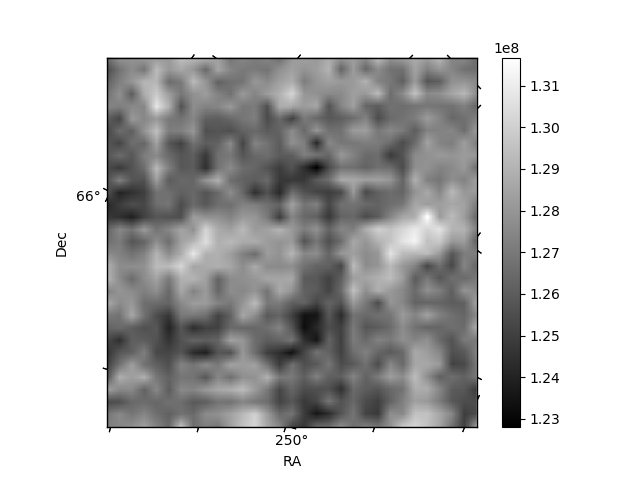
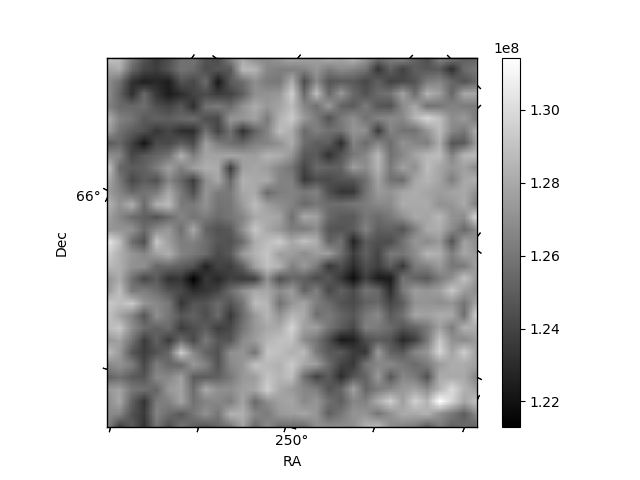
Histogram calculated using DETX and DETY for each event in the final _common_clean file
| Quadrant A | 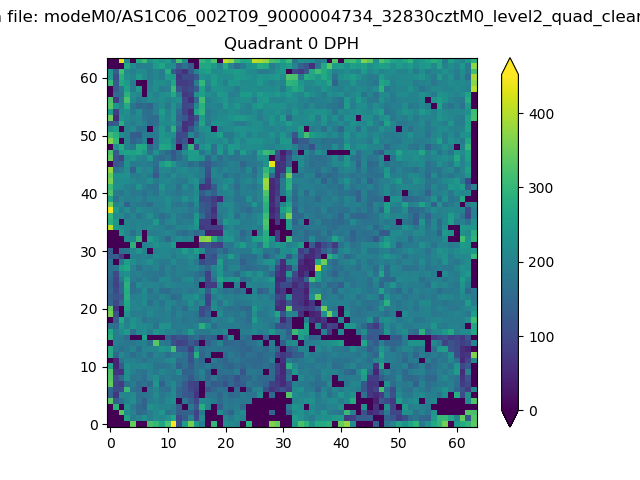 |
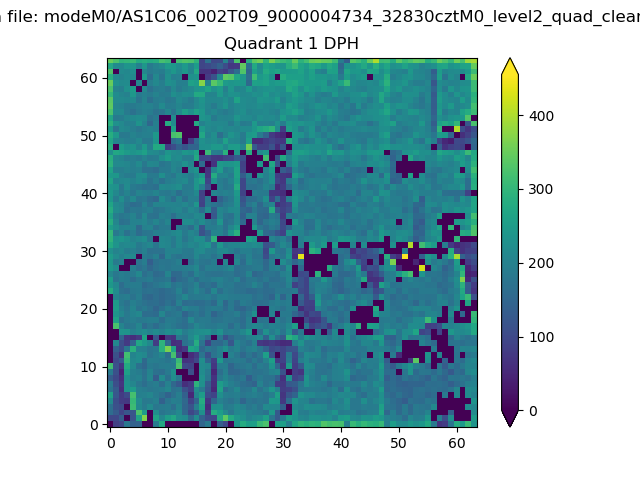 |
Quadrant B |
|---|---|---|---|
| Quadrant D | 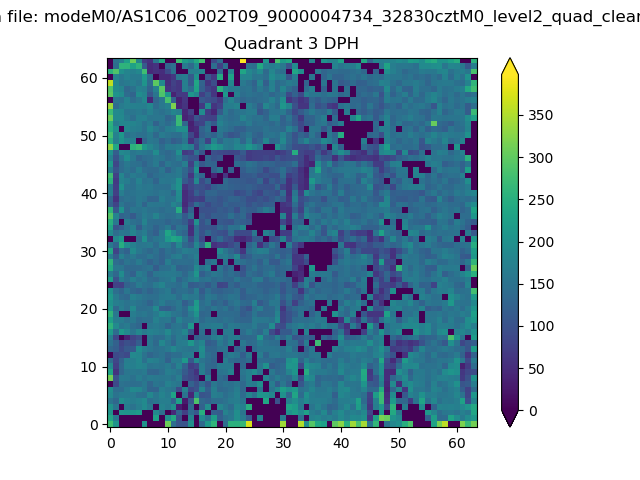 |
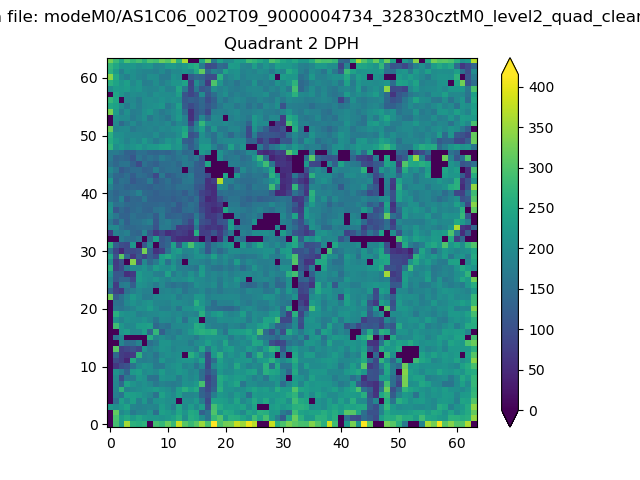 |
Quadrant C |
| Plot type | Count rate plots | Images |
|---|---|---|
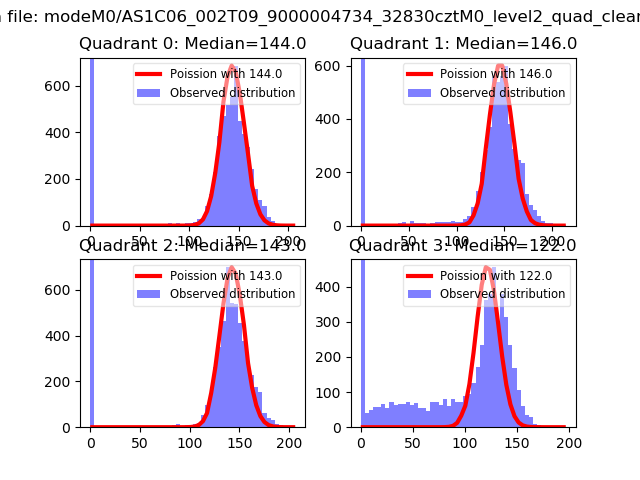
| Comparison with Poisson distribution Blue bars denote a histogram of data divided into 1 sec bins. Red curve is a Poisson curve with rate = median count rate of data. |
 |
 |
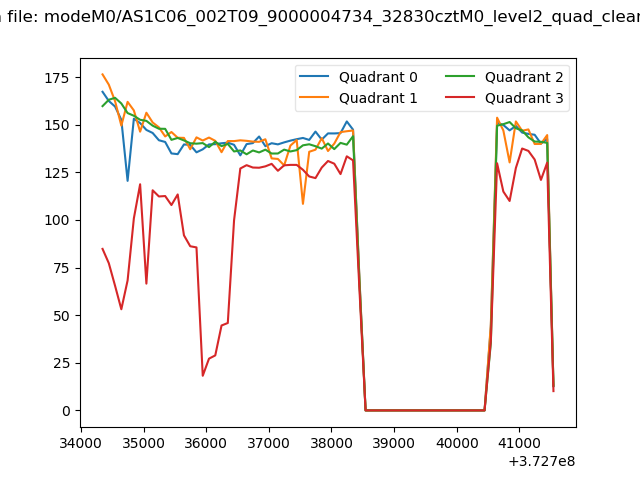
| Quadrant-wise count rates Data is divided into 100 sec bins |
 |
|
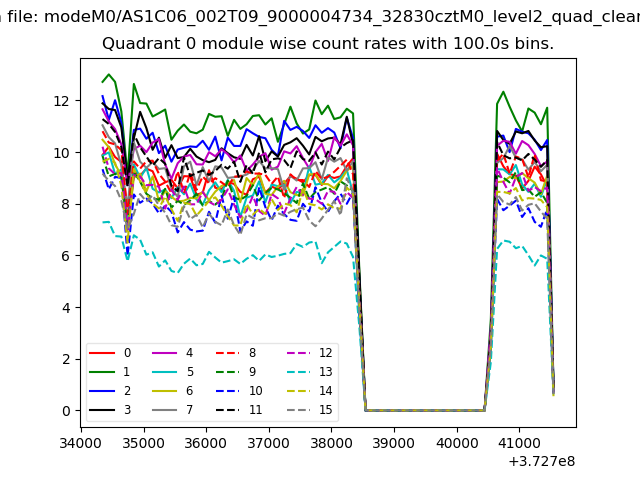
| Module-wise count rates for Quadrant A Data is divided into 100 sec bins |
 |
 |
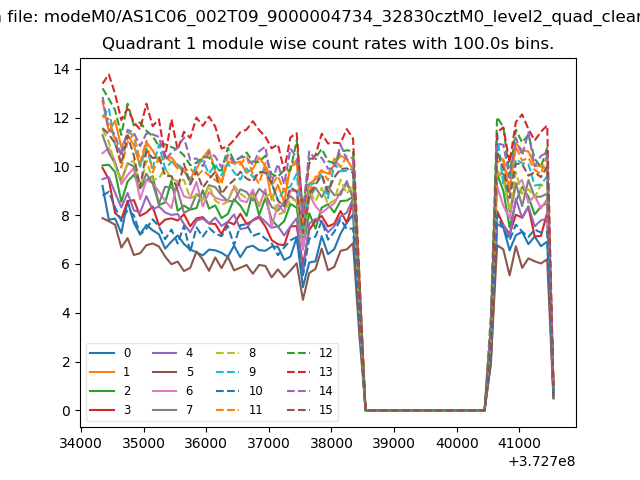
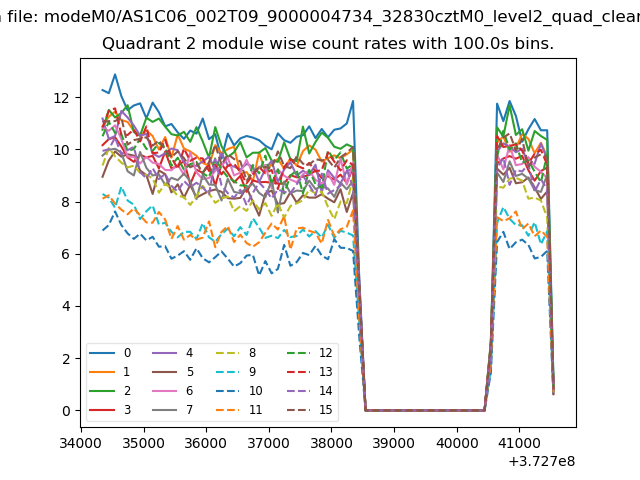
| Module-wise count rates for Quadrant B Data is divided into 100 sec bins |
 |
 |
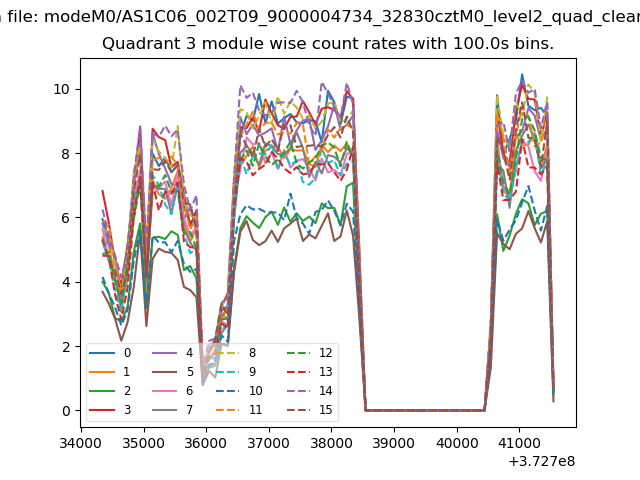
| Module-wise count rates for Quadrant C Data is divided into 100 sec bins |
 |
 |
| Module-wise count rates for Quadrant D Data is divided into 100 sec bins |
 |
 |
| Parameter | Plot |
|---|---|
| CZT HV Monitor | 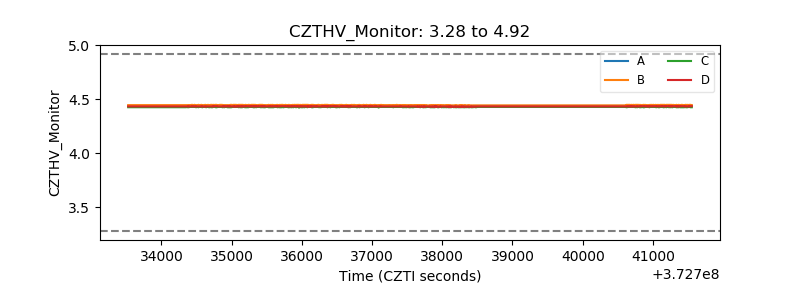 |
| D_VDD | 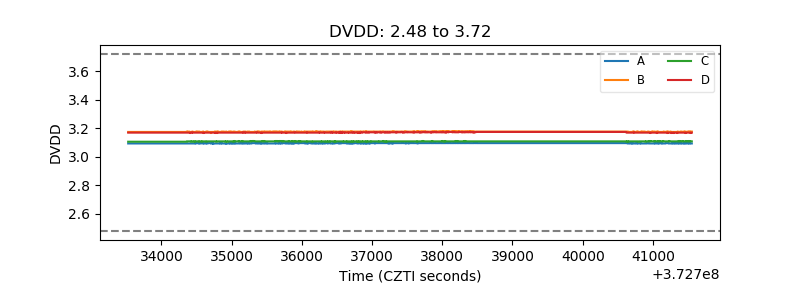 |
| Temperature 1 | 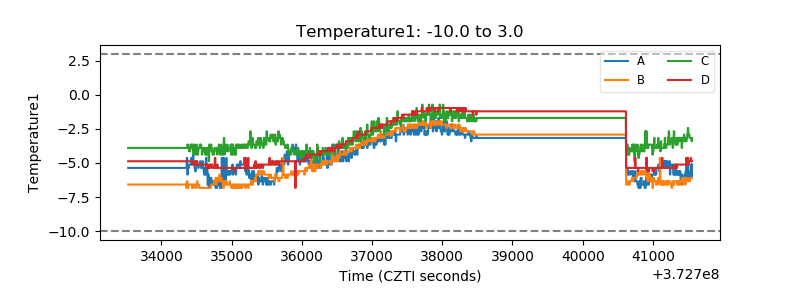 |
| Veto HV Monitor |  |
| Veto LLD | 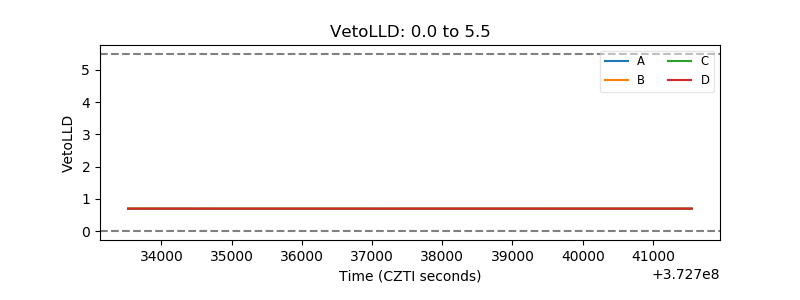 |
| Alpha Counter | 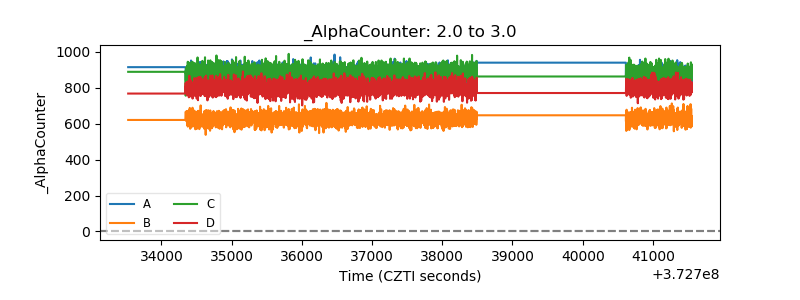 |
| _CPM_Rate | 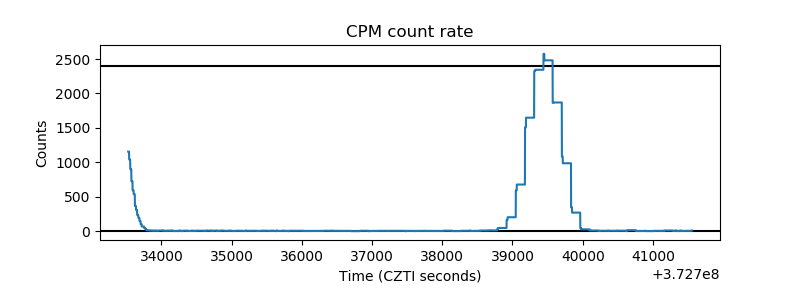 |
| CZT Counter | 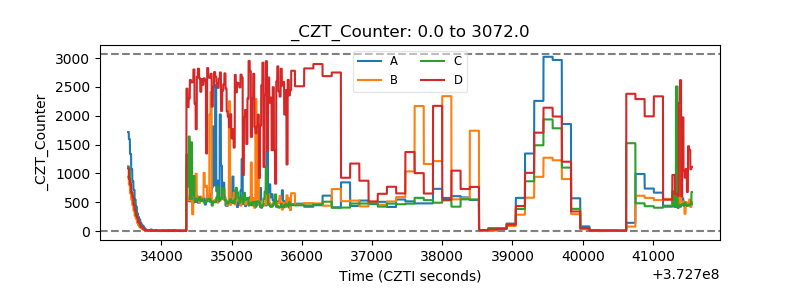 |
| +2.5 Volts monitor |  |
| +5 Volts monitor |  |
| _ROLL_ROT | 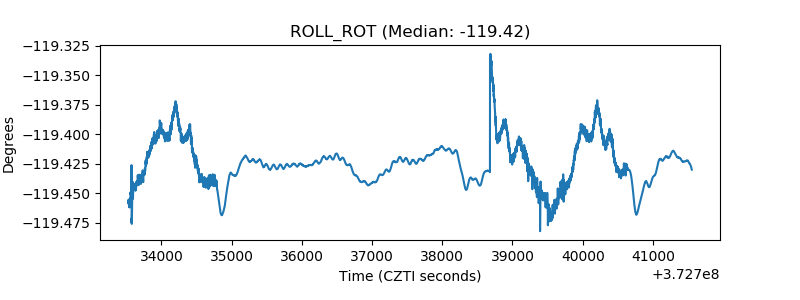 |
| _Roll_DEC | 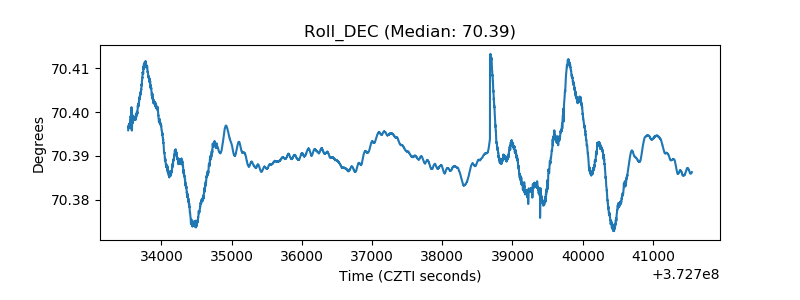 |
| _Roll_RA | 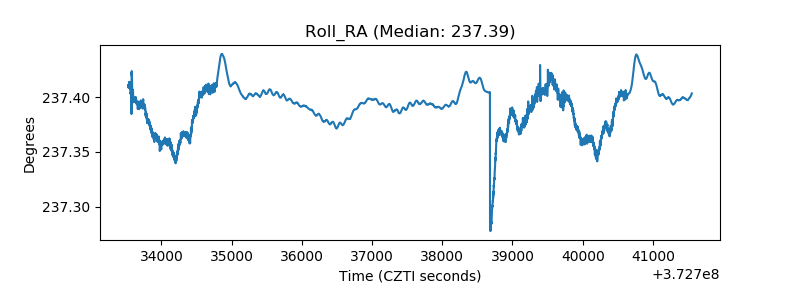 |
| Veto Counter | 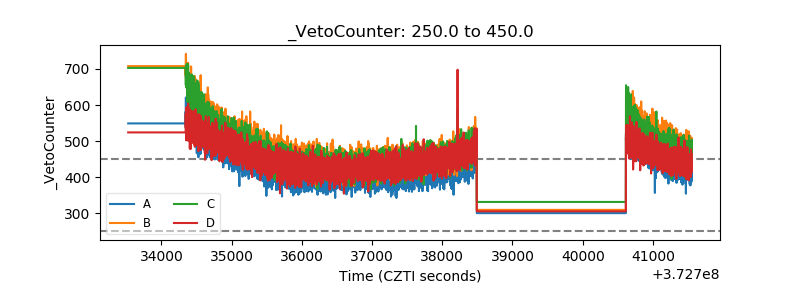 |