| Param | Original file | Final file |
|---|---|---|
| Filename | modeM0/AS1C06_002T09_9000004734_32832cztM0_level2.evt | modeM0/AS1C06_002T09_9000004734_32832cztM0_level2_quad_clean.evt |
| Size (bytes) | 466,162,560 | 97,695,360 |
| Size | 444.6 MB | 93.2 MB |
| Events in quadrant A | 2,596,169 | 676,043 |
| Events in quadrant B | 2,981,011 | 672,495 |
| Events in quadrant C | 2,677,624 | 653,342 |
| Events in quadrant D | 5,521,318 | 603,396 |
| Mode M9 | |||
|---|---|---|---|
| Quadrant | BADHDUFLAG | Total packets | Discarded packets |
| A | 0 | 32 | 0 |
| B | 0 | 32 | 0 |
| C | 0 | 32 | 0 |
| D | 0 | 33 | 0 |
| Mode M0 | |||
|---|---|---|---|
| Quadrant | BADHDUFLAG | Total packets | Discarded packets |
| A | 0 | 10907 | 3 |
| B | 0 | 12130 | 2 |
| C | 0 | 11315 | 2 |
| D | 0 | 20021 | 2 |
| Mode SS | |||
|---|---|---|---|
| Quadrant | BADHDUFLAG | Total packets | Discarded packets |
| A | 0 | 102 | 0 |
| B | 0 | 102 | 0 |
| C | 0 | 102 | 0 |
| D | 0 | 102 | 0 |
| Quadrant | Total seconds | Saturated seconds | Saturation percentage |
|---|---|---|---|
| A | 5045 | 41 | 0.812686% |
| B | 5045 | 99 | 1.962339% |
| C | 5045 | 66 | 1.308226% |
| D | 5045 | 221 | 4.380575% |
Noise dominated data is calculated using 1-second bins in cleaned event files. If a bin has >2000 counts, and if more than 50% of those come from <1% of pixels, then it is considered to be noise-dominated and hence unusable.
| Quadrant | # 1 sec bins | Bins with >0 counts | Bins with >2000 counts | High rate bins dominated by noise | Noise dominated (total time) | Noise dominated (detector-on time) | Marked lightcurve |
|---|---|---|---|---|---|---|---|
| A | 7077 | 5046 | 13 | 13 | 0.18% | 0.26% | 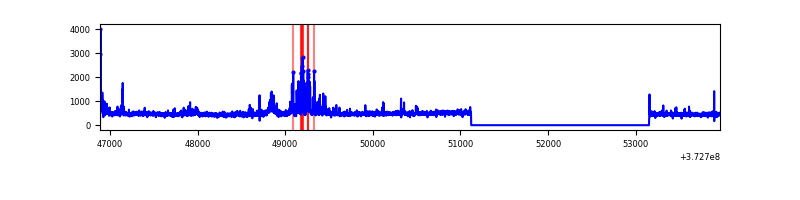 |
| B | 7077 | 5046 | 66 | 66 | 0.93% | 1.31% |  |
| C | 7077 | 5046 | 46 | 46 | 0.65% | 0.91% |  |
| D | 7077 | 5046 | 190 | 190 | 2.68% | 3.77% | 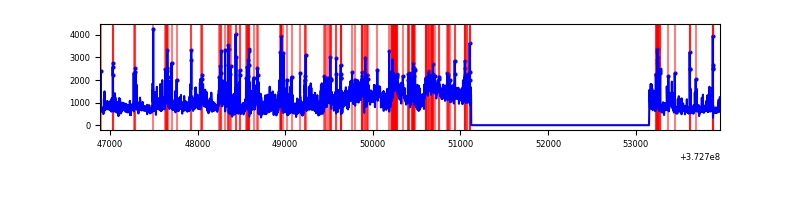 |
Top three noisy pixels from each quadrant. If the there are fewer than three noisy pixels in the level2.evt file, extra rows are filled as -1
| Pixel properties | Quadrant properties | ||||||
|---|---|---|---|---|---|---|---|
| Quadrant | DetID | PixID | Counts | Sigma | Mean | Median | Sigma |
| A | 14 | 238 | 198185 | 1681.15 | 591 | 579 | 117.5 |
| A | 12 | 16 | 42881 | 359.89 | 591 | 579 | 117.5 |
| A | 14 | 239 | 25504 | 212.05 | 591 | 579 | 117.5 |
| B | 0 | 219 | 249447 | 2266.42 | 584 | 571 | 109.8 |
| B | 5 | 172 | 187364 | 1701.05 | 584 | 571 | 109.8 |
| B | 8 | 128 | 121480 | 1101.07 | 584 | 571 | 109.8 |
| C | 0 | 10 | 149776 | 1169.94 | 559 | 563 | 127.5 |
| C | 1 | 241 | 125084 | 976.34 | 559 | 563 | 127.5 |
| C | 3 | 233 | 93103 | 725.58 | 559 | 563 | 127.5 |
| D | 8 | 195 | 2427926 | 18195.08 | 555 | 539 | 133.4 |
| D | 2 | 250 | 455368 | 3409.28 | 555 | 539 | 133.4 |
| D | 1 | 52 | 96985 | 722.94 | 555 | 539 | 133.4 |
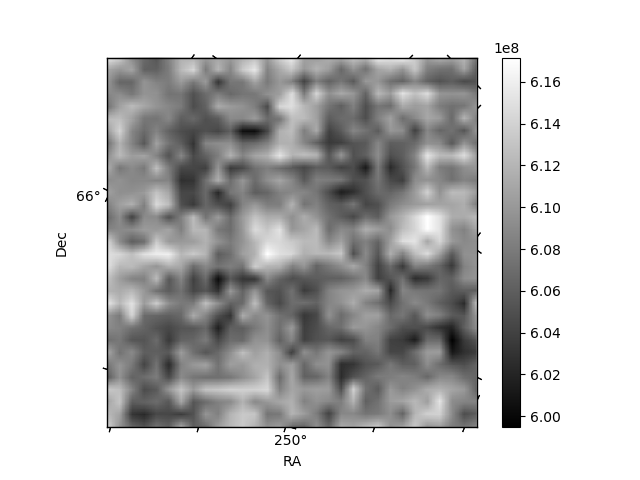
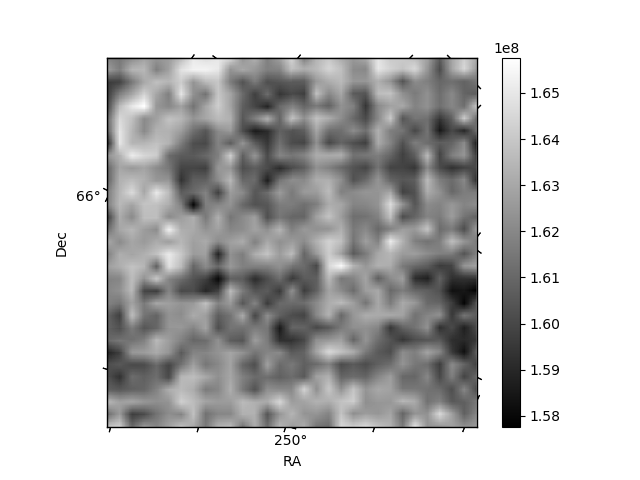
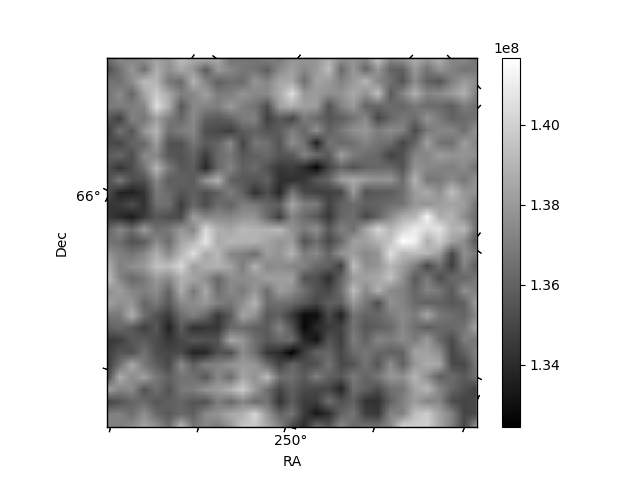
Histogram calculated using DETX and DETY for each event in the final _common_clean file
| Quadrant A | 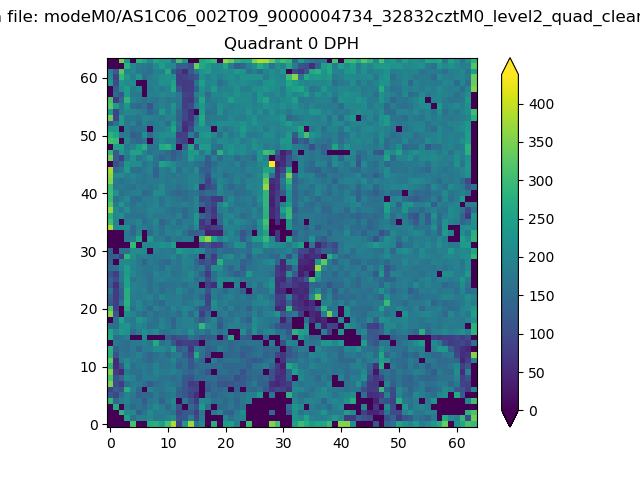 |
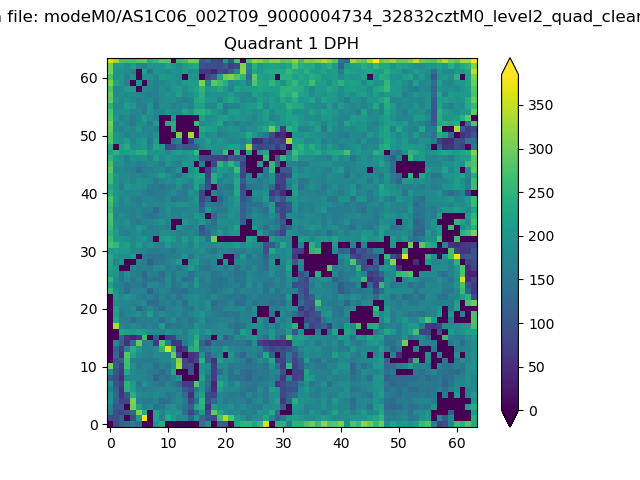 |
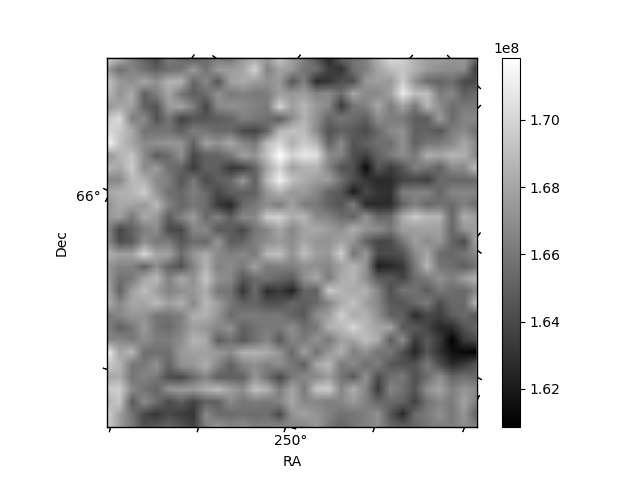
Quadrant B |
|---|---|---|---|
| Quadrant D |  |
 |
Quadrant C |
| Plot type | Count rate plots | Images |
|---|---|---|
| Comparison with Poisson distribution Blue bars denote a histogram of data divided into 1 sec bins. Red curve is a Poisson curve with rate = median count rate of data. |
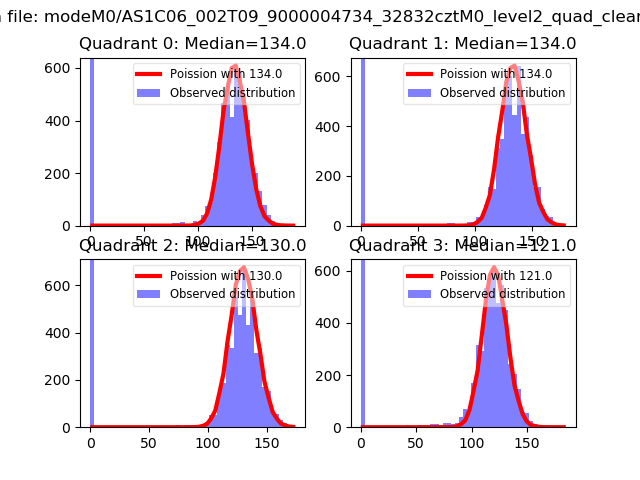 |
 |
| Quadrant-wise count rates Data is divided into 100 sec bins |
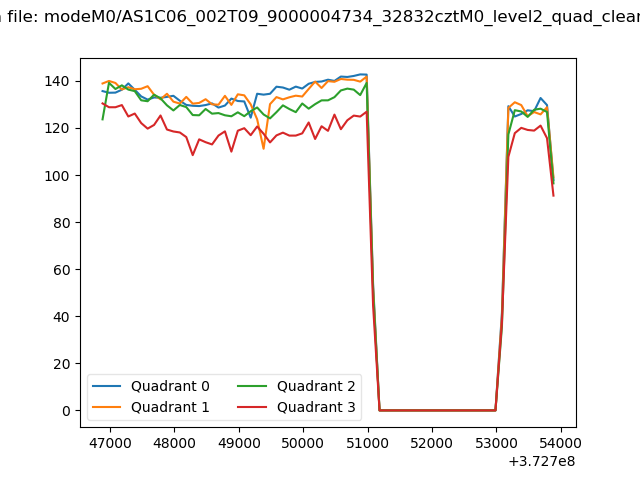 |
|
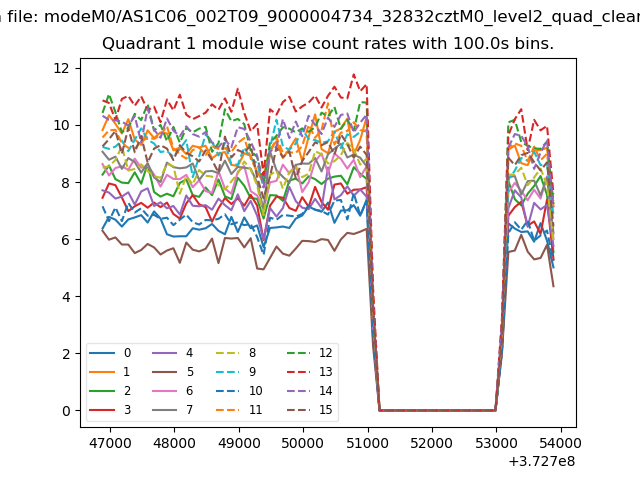
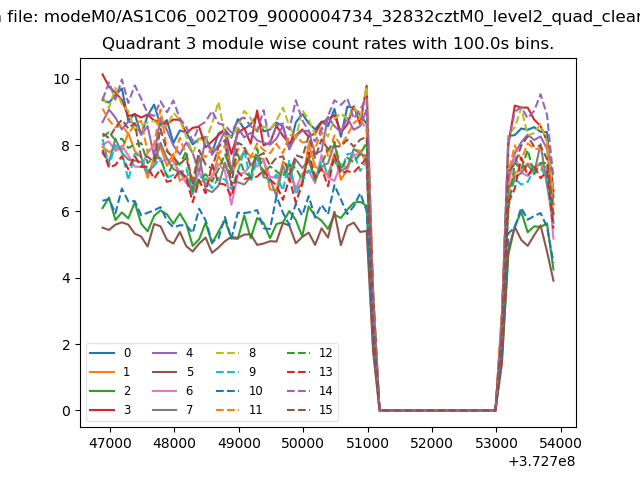
| Module-wise count rates for Quadrant A Data is divided into 100 sec bins |
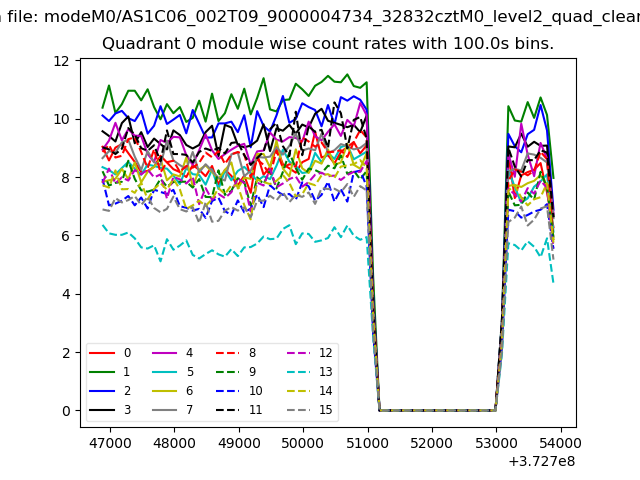 |
 |
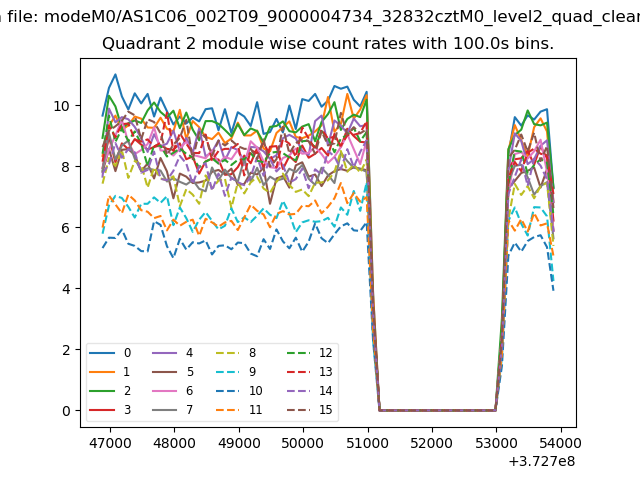
| Module-wise count rates for Quadrant B Data is divided into 100 sec bins |
 |
 |
| Module-wise count rates for Quadrant C Data is divided into 100 sec bins |
 |
 |
| Module-wise count rates for Quadrant D Data is divided into 100 sec bins |
 |
 |
| Parameter | Plot |
|---|---|
| CZT HV Monitor | 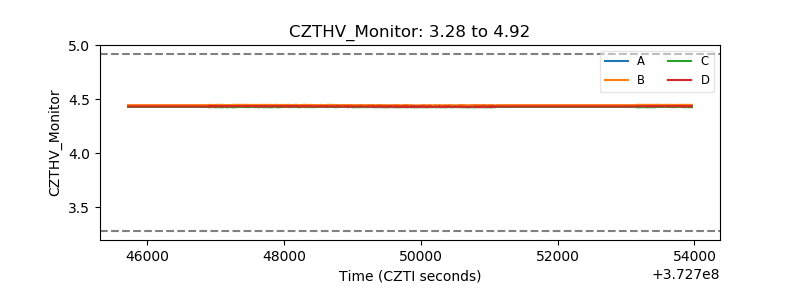 |
| D_VDD | 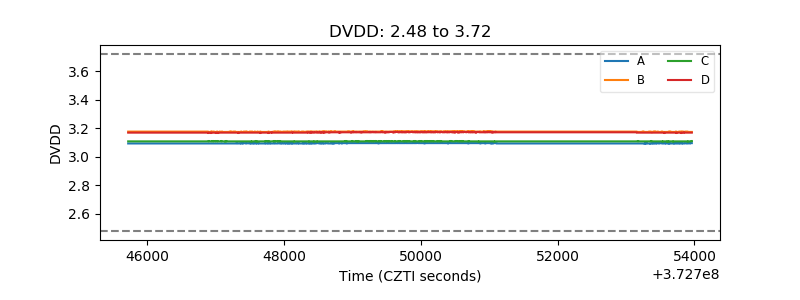 |
| Temperature 1 | 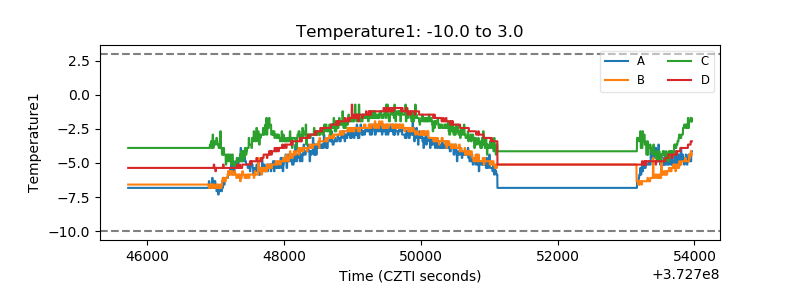 |
| Veto HV Monitor | 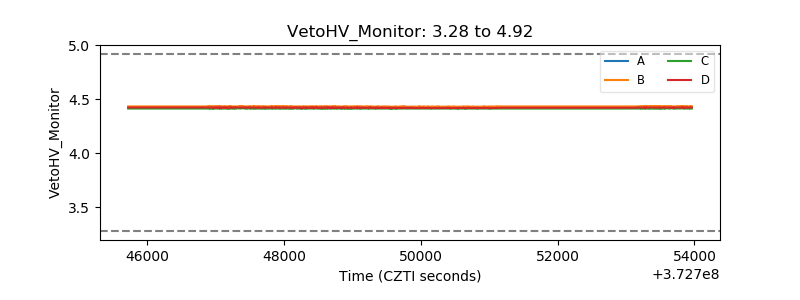 |
| Veto LLD | 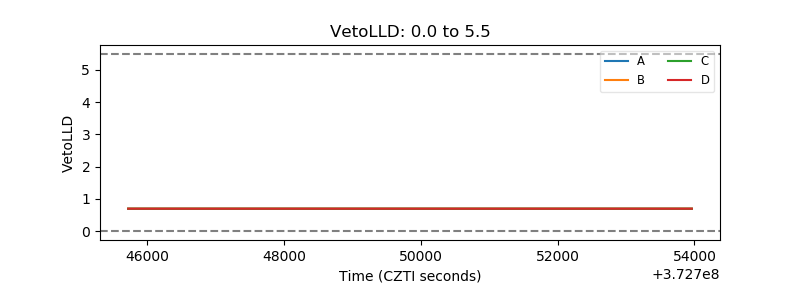 |
| Alpha Counter | 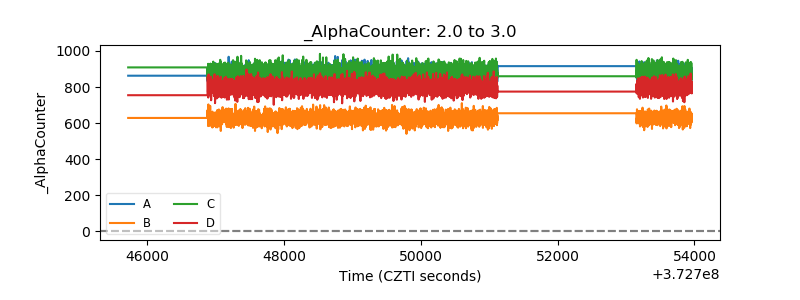 |
| _CPM_Rate | 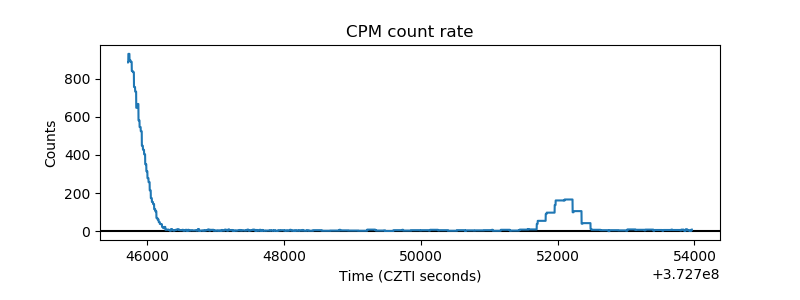 |
| CZT Counter | 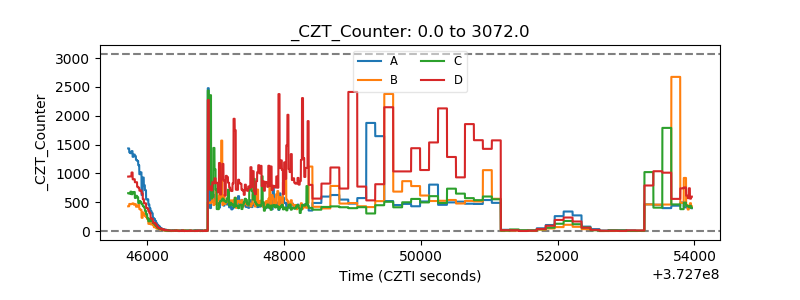 |
| +2.5 Volts monitor | 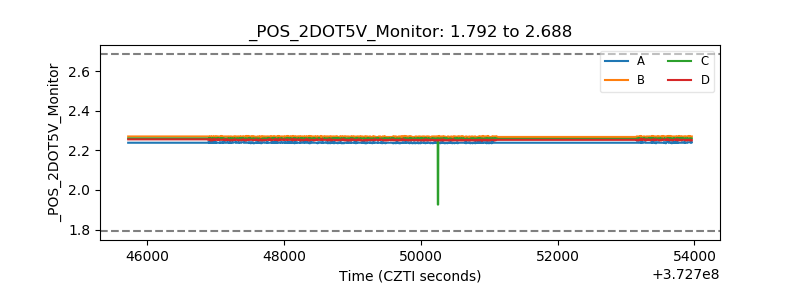 |
| +5 Volts monitor |  |
| _ROLL_ROT | 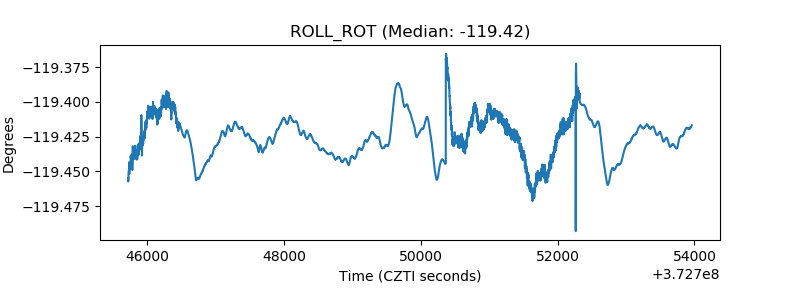 |
| _Roll_DEC | 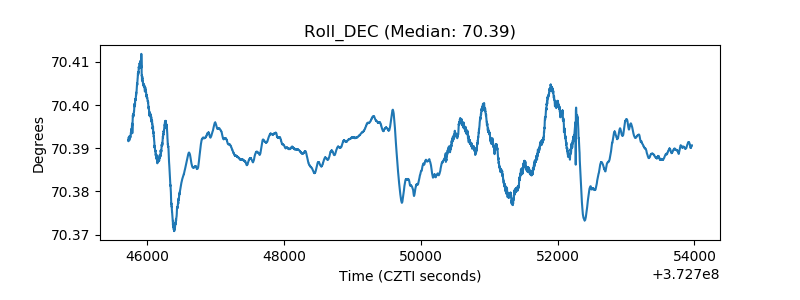 |
| _Roll_RA | 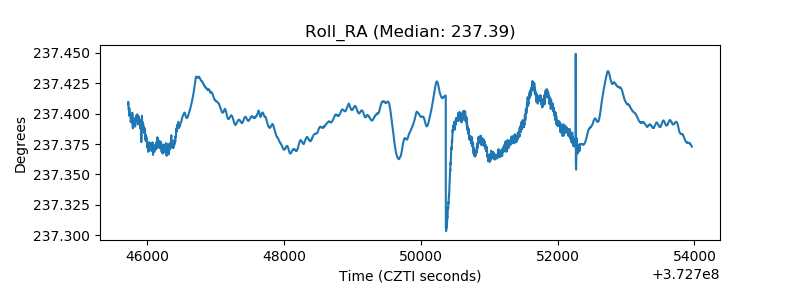 |
| Veto Counter | 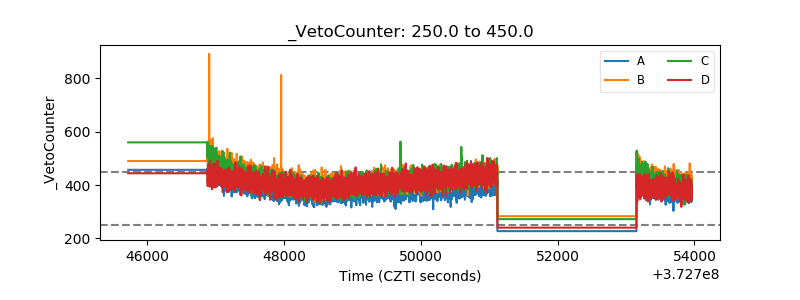 |