| Param | Original file | Final file |
|---|---|---|
| Filename | modeM0/AS1C06_002T09_9000004734_32835cztM0_level2.evt | modeM0/AS1C06_002T09_9000004734_32835cztM0_level2_quad_clean.evt |
| Size (bytes) | 622,002,240 | 97,358,400 |
| Size | 593.2 MB | 92.8 MB |
| Events in quadrant A | 3,149,346 | 673,545 |
| Events in quadrant B | 5,064,549 | 612,320 |
| Events in quadrant C | 2,942,623 | 653,955 |
| Events in quadrant D | 7,275,719 | 589,454 |
| Mode M9 | |||
|---|---|---|---|
| Quadrant | BADHDUFLAG | Total packets | Discarded packets |
| A | 0 | 13 | 0 |
| B | 0 | 13 | 0 |
| C | 0 | 13 | 0 |
| D | 0 | 14 | 0 |
| Mode M0 | |||
|---|---|---|---|
| Quadrant | BADHDUFLAG | Total packets | Discarded packets |
| A | 0 | 13250 | 3 |
| B | 0 | 18869 | 2 |
| C | 0 | 12775 | 2 |
| D | 0 | 25917 | 2 |
| Mode SS | |||
|---|---|---|---|
| Quadrant | BADHDUFLAG | Total packets | Discarded packets |
| A | 0 | 122 | 0 |
| B | 0 | 122 | 0 |
| C | 0 | 122 | 0 |
| D | 0 | 122 | 0 |
| Quadrant | Total seconds | Saturated seconds | Saturation percentage |
|---|---|---|---|
| A | 5992 | 58 | 0.967957% |
| B | 5992 | 829 | 13.835113% |
| C | 5992 | 46 | 0.767690% |
| D | 5992 | 729 | 12.166222% |
Noise dominated data is calculated using 1-second bins in cleaned event files. If a bin has >2000 counts, and if more than 50% of those come from <1% of pixels, then it is considered to be noise-dominated and hence unusable.
| Quadrant | # 1 sec bins | Bins with >0 counts | Bins with >2000 counts | High rate bins dominated by noise | Noise dominated (total time) | Noise dominated (detector-on time) | Marked lightcurve |
|---|---|---|---|---|---|---|---|
| A | 7274 | 5993 | 40 | 40 | 0.55% | 0.67% | 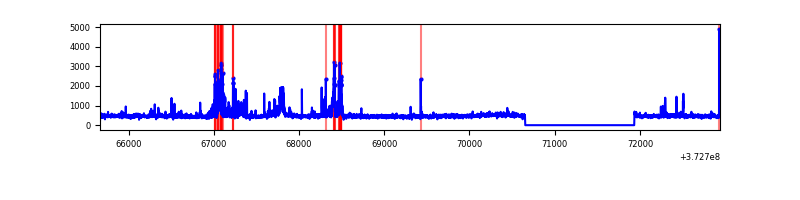 |
| B | 7274 | 5993 | 612 | 612 | 8.41% | 10.21% | 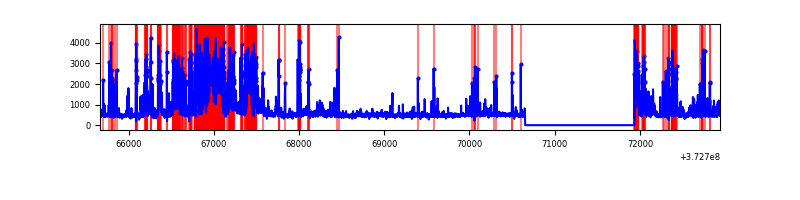 |
| C | 7274 | 5993 | 31 | 31 | 0.43% | 0.52% | 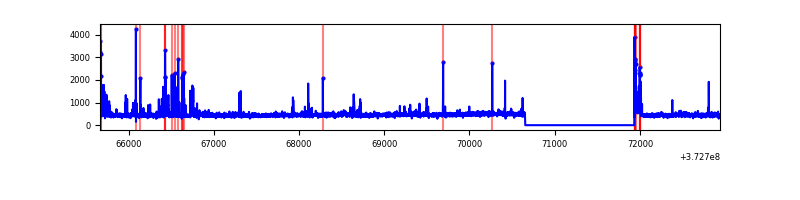 |
| D | 7274 | 5993 | 665 | 665 | 9.14% | 11.10% | 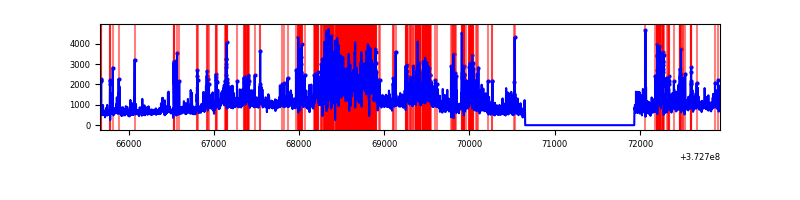 |
Top three noisy pixels from each quadrant. If the there are fewer than three noisy pixels in the level2.evt file, extra rows are filled as -1
| Pixel properties | Quadrant properties | ||||||
|---|---|---|---|---|---|---|---|
| Quadrant | DetID | PixID | Counts | Sigma | Mean | Median | Sigma |
| A | 14 | 239 | 235367 | 1695.53 | 689 | 675 | 138.4 |
| A | 14 | 207 | 186586 | 1343.12 | 689 | 675 | 138.4 |
| A | 9 | 143 | 22876 | 160.39 | 689 | 675 | 138.4 |
| B | 5 | 172 | 2034772 | 16557.25 | 640 | 622 | 122.9 |
| B | 0 | 190 | 129310 | 1047.47 | 640 | 622 | 122.9 |
| B | 0 | 219 | 106760 | 863.93 | 640 | 622 | 122.9 |
| C | 0 | 10 | 181377 | 1190.2 | 662 | 668 | 151.8 |
| C | 1 | 241 | 64574 | 420.9 | 662 | 668 | 151.8 |
| C | 3 | 233 | 43424 | 281.6 | 662 | 668 | 151.8 |
| D | 8 | 195 | 2236428 | 14376.1 | 633 | 618 | 155.5 |
| D | 2 | 250 | 699503 | 4493.78 | 633 | 618 | 155.5 |
| D | 10 | 203 | 529830 | 3402.8 | 633 | 618 | 155.5 |
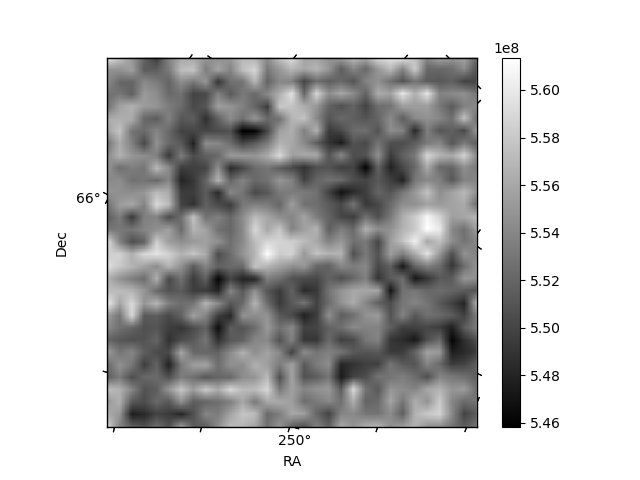
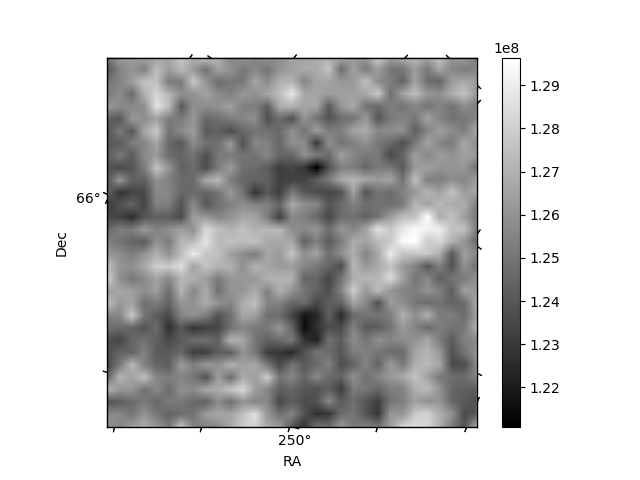
Histogram calculated using DETX and DETY for each event in the final _common_clean file
| Quadrant A | 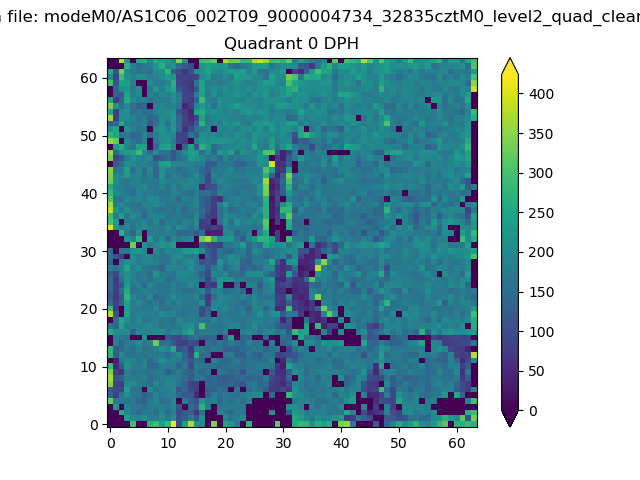 |
 |
Quadrant B |
|---|---|---|---|
| Quadrant D | 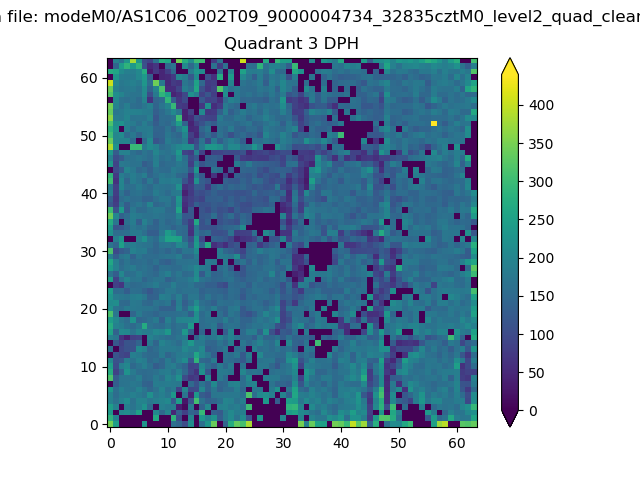 |
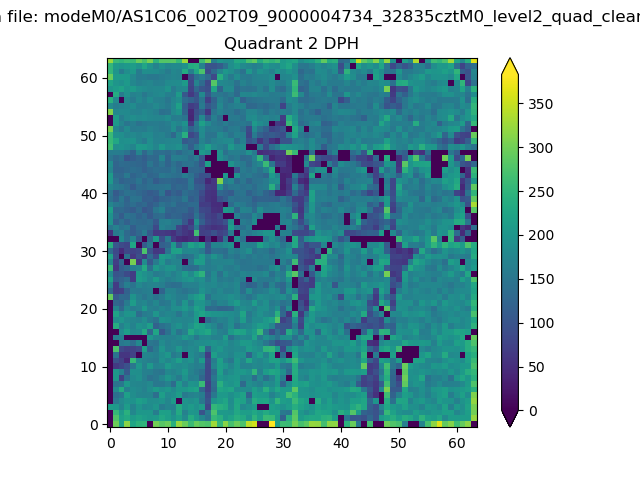 |
Quadrant C |
| Plot type | Count rate plots | Images |
|---|---|---|
| Comparison with Poisson distribution Blue bars denote a histogram of data divided into 1 sec bins. Red curve is a Poisson curve with rate = median count rate of data. |
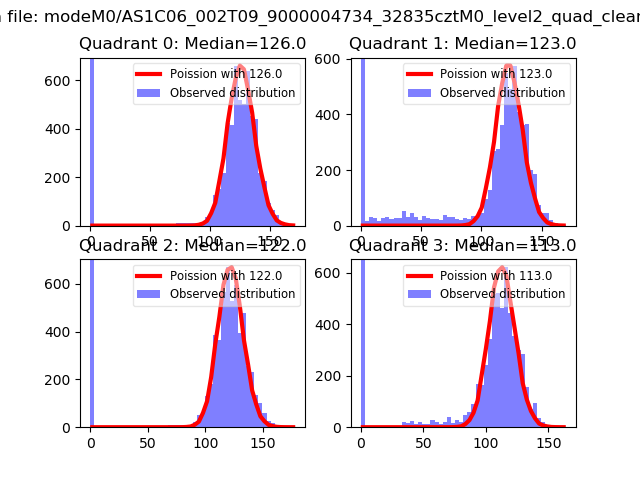 |
 |
| Quadrant-wise count rates Data is divided into 100 sec bins |
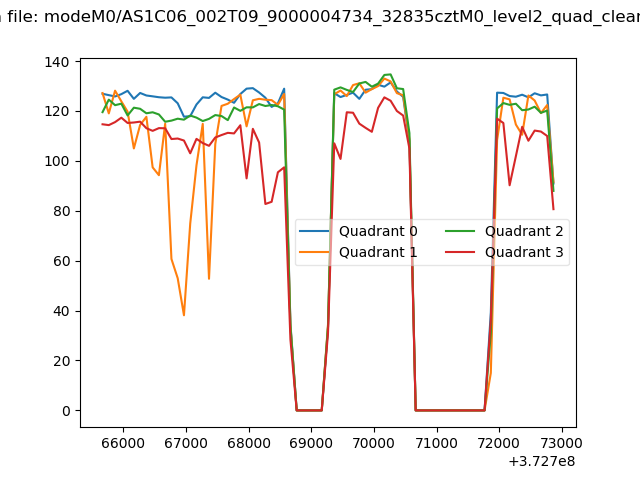 |
|
| Module-wise count rates for Quadrant A Data is divided into 100 sec bins |
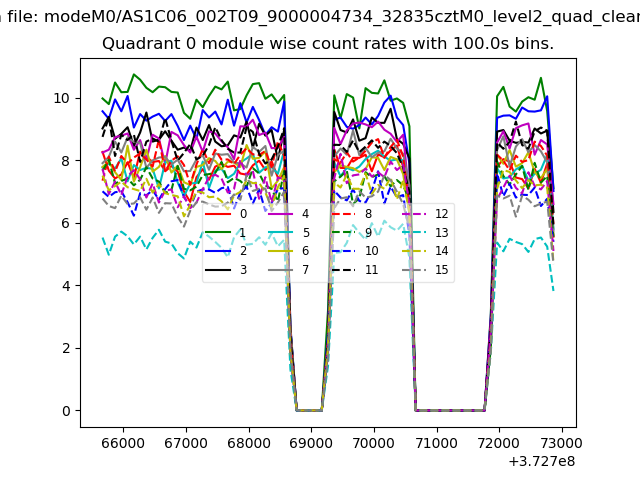 |
 |
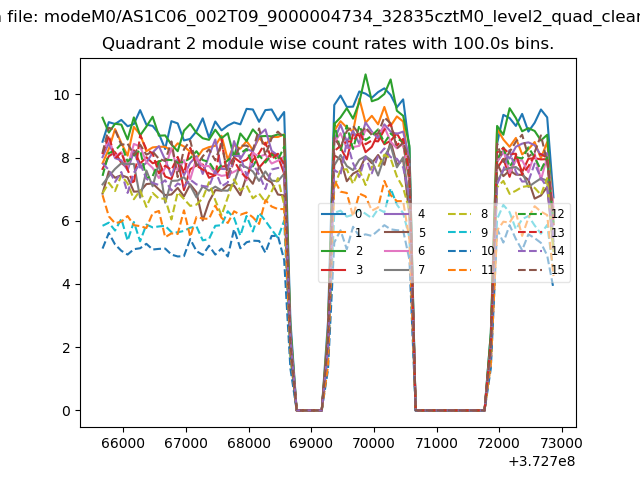
| Module-wise count rates for Quadrant B Data is divided into 100 sec bins |
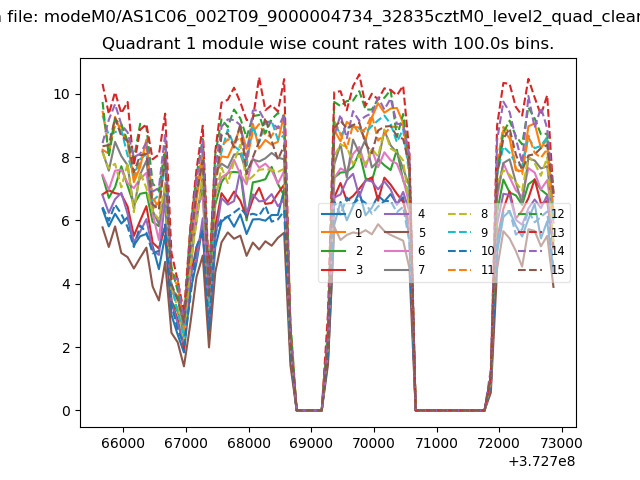 |
 |
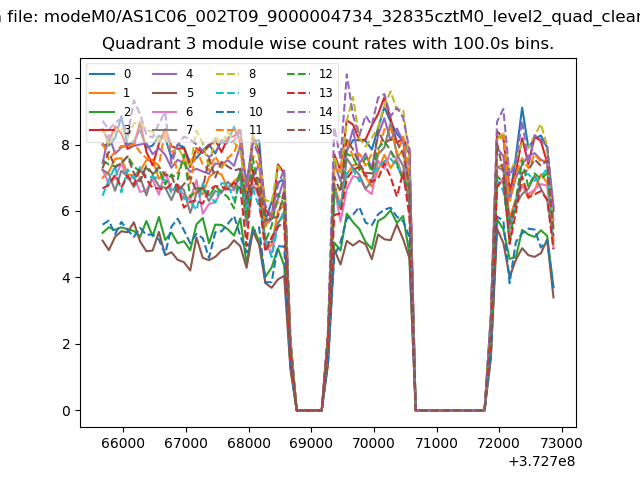
| Module-wise count rates for Quadrant C Data is divided into 100 sec bins |
 |
 |
| Module-wise count rates for Quadrant D Data is divided into 100 sec bins |
 |
 |
| Parameter | Plot |
|---|---|
| CZT HV Monitor | 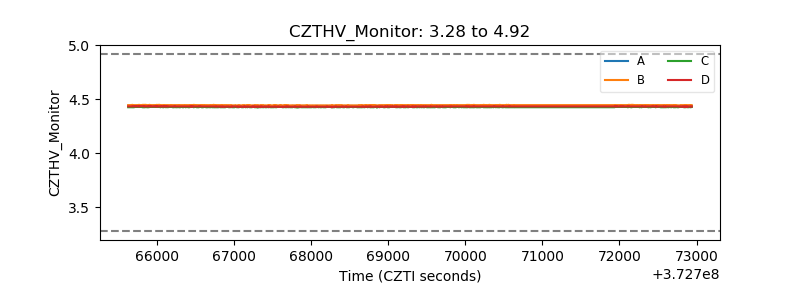 |
| D_VDD | 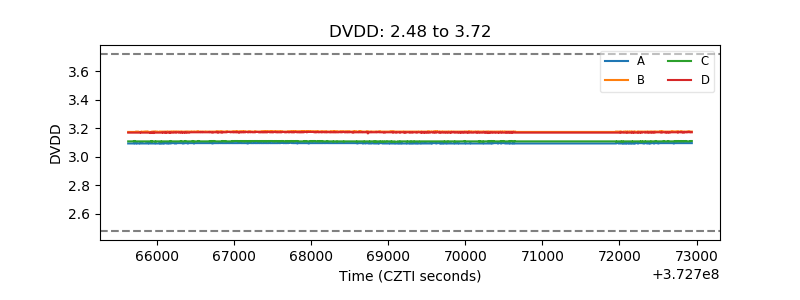 |
| Temperature 1 | 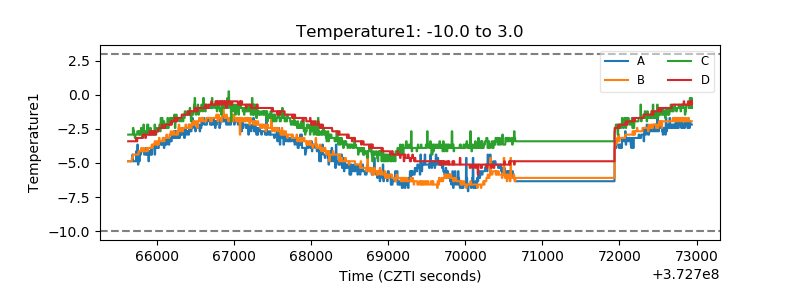 |
| Veto HV Monitor | 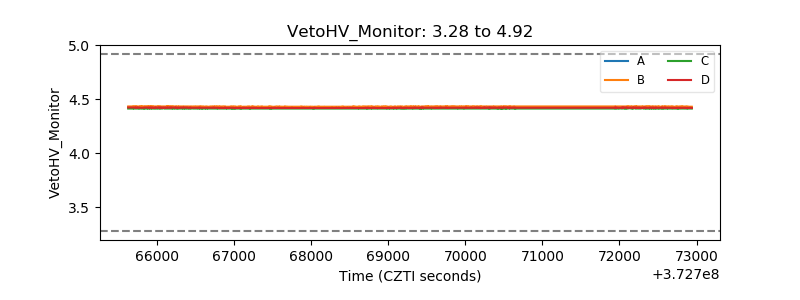 |
| Veto LLD | 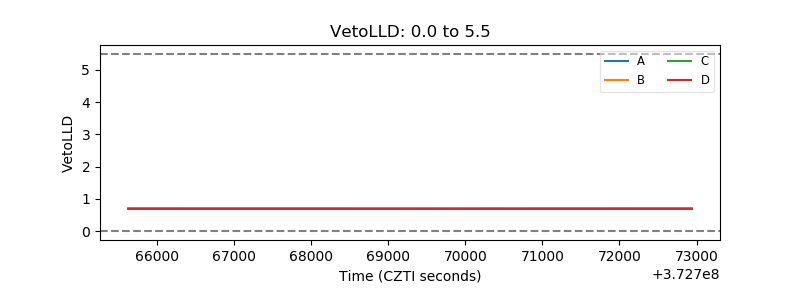 |
| Alpha Counter | 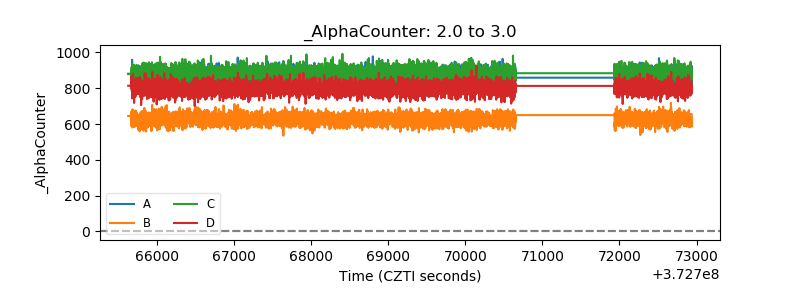 |
| _CPM_Rate | 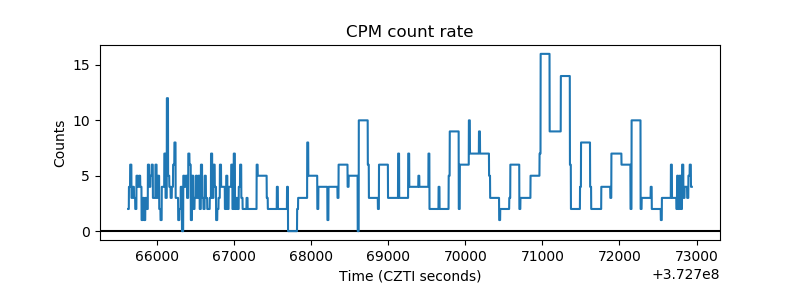 |
| CZT Counter | 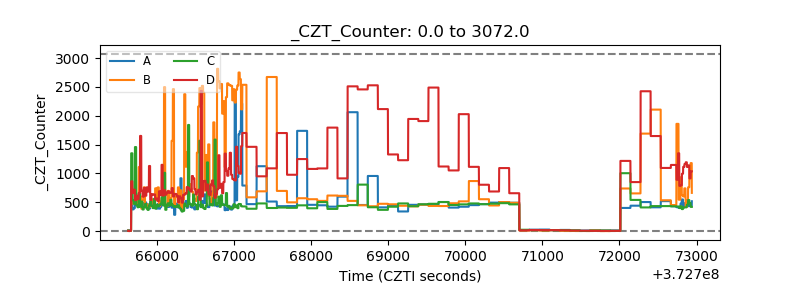 |
| +2.5 Volts monitor |  |
| +5 Volts monitor |  |
| _ROLL_ROT | 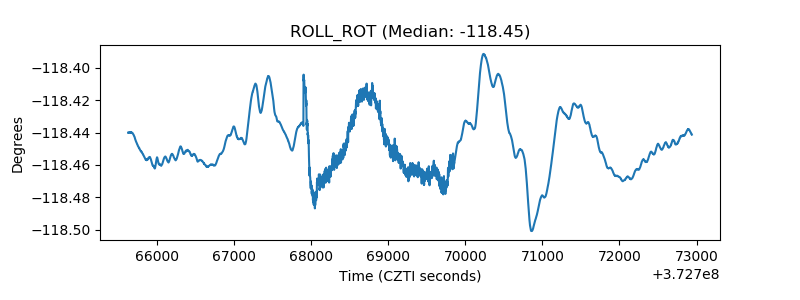 |
| _Roll_DEC | 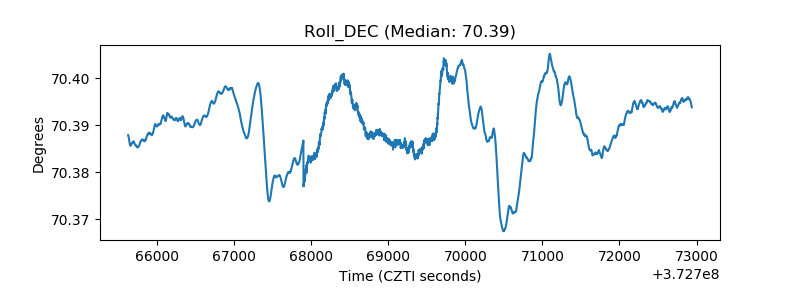 |
| _Roll_RA |  |
| Veto Counter | 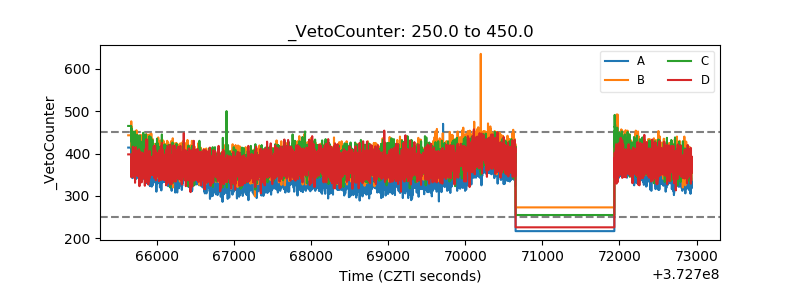 |