| Param | Original file | Final file |
|---|---|---|
| Filename | modeM0/AS1C06_002T09_9000004734_32838cztM0_level2.evt | modeM0/AS1C06_002T09_9000004734_32838cztM0_level2_quad_clean.evt |
| Size (bytes) | 1,456,289,280 | 254,237,760 |
| Size | 1.4 GB | 242.5 MB |
| Events in quadrant A | 7,229,824 | 1,736,108 |
| Events in quadrant B | 9,609,516 | 1,686,459 |
| Events in quadrant C | 8,084,555 | 1,681,695 |
| Events in quadrant D | 18,134,021 | 1,523,680 |
| Mode M9 | |||
|---|---|---|---|
| Quadrant | BADHDUFLAG | Total packets | Discarded packets |
| A | 0 | 42 | 0 |
| B | 0 | 42 | 0 |
| C | 0 | 42 | 0 |
| D | 0 | 42 | 0 |
| Mode M0 | |||
|---|---|---|---|
| Quadrant | BADHDUFLAG | Total packets | Discarded packets |
| A | 0 | 31900 | 4 |
| B | 0 | 38668 | 3 |
| C | 0 | 34481 | 3 |
| D | 0 | 64957 | 3 |
| Mode SS | |||
|---|---|---|---|
| Quadrant | BADHDUFLAG | Total packets | Discarded packets |
| A | 0 | 316 | 0 |
| B | 0 | 316 | 0 |
| C | 0 | 316 | 0 |
| D | 0 | 316 | 0 |
| Quadrant | Total seconds | Saturated seconds | Saturation percentage |
|---|---|---|---|
| A | 15544 | 34 | 0.218734% |
| B | 15544 | 527 | 3.390376% |
| C | 15544 | 90 | 0.579002% |
| D | 15544 | 1492 | 9.598559% |
Noise dominated data is calculated using 1-second bins in cleaned event files. If a bin has >2000 counts, and if more than 50% of those come from <1% of pixels, then it is considered to be noise-dominated and hence unusable.
| Quadrant | # 1 sec bins | Bins with >0 counts | Bins with >2000 counts | High rate bins dominated by noise | Noise dominated (total time) | Noise dominated (detector-on time) | Marked lightcurve |
|---|---|---|---|---|---|---|---|
| A | 19781 | 15547 | 15 | 15 | 0.08% | 0.10% | 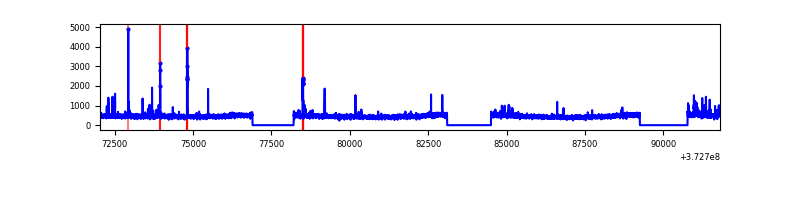 |
| B | 19781 | 15547 | 348 | 348 | 1.76% | 2.24% | 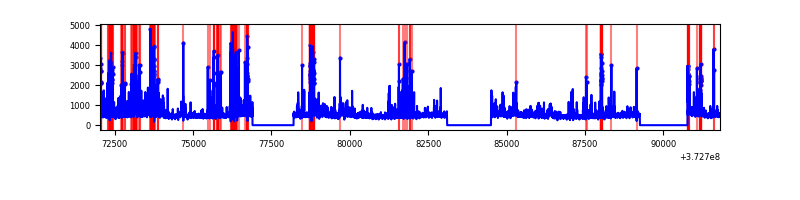 |
| C | 19781 | 15547 | 66 | 66 | 0.33% | 0.42% | 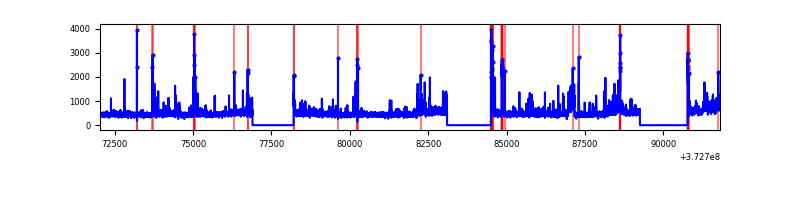 |
| D | 19781 | 15547 | 1241 | 1241 | 6.27% | 7.98% | 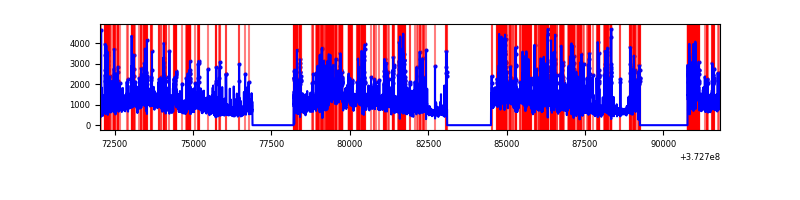 |
Top three noisy pixels from each quadrant. If the there are fewer than three noisy pixels in the level2.evt file, extra rows are filled as -1
| Pixel properties | Quadrant properties | ||||||
|---|---|---|---|---|---|---|---|
| Quadrant | DetID | PixID | Counts | Sigma | Mean | Median | Sigma |
| A | 12 | 16 | 74888 | 204.6 | 1791 | 1755 | 357.4 |
| A | 7 | 16 | 64068 | 174.33 | 1791 | 1755 | 357.4 |
| A | 14 | 207 | 61888 | 168.23 | 1791 | 1755 | 357.4 |
| B | 5 | 172 | 1460788 | 4337.13 | 1768 | 1722 | 336.4 |
| B | 0 | 219 | 367618 | 1087.64 | 1768 | 1722 | 336.4 |
| B | 0 | 190 | 249277 | 735.87 | 1768 | 1722 | 336.4 |
| C | 3 | 233 | 446382 | 1118.64 | 1737 | 1752 | 397.5 |
| C | 9 | 160 | 290863 | 727.37 | 1737 | 1752 | 397.5 |
| C | 0 | 10 | 214419 | 535.05 | 1737 | 1752 | 397.5 |
| D | 8 | 195 | 5541964 | 13545.87 | 1664 | 1625 | 409.0 |
| D | 10 | 203 | 1582393 | 3864.9 | 1664 | 1625 | 409.0 |
| D | 2 | 250 | 1068705 | 2608.96 | 1664 | 1625 | 409.0 |
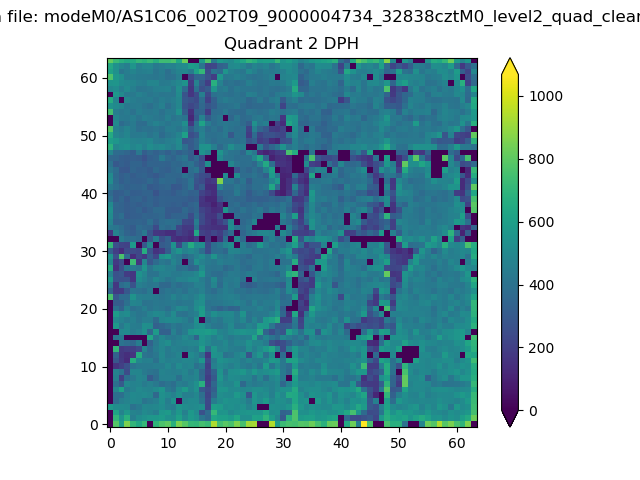
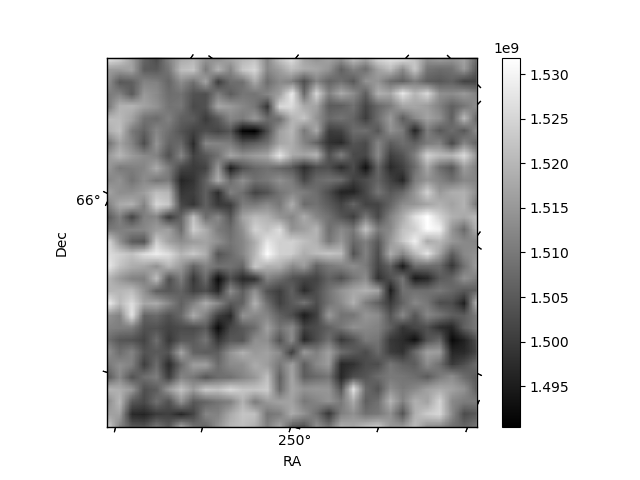
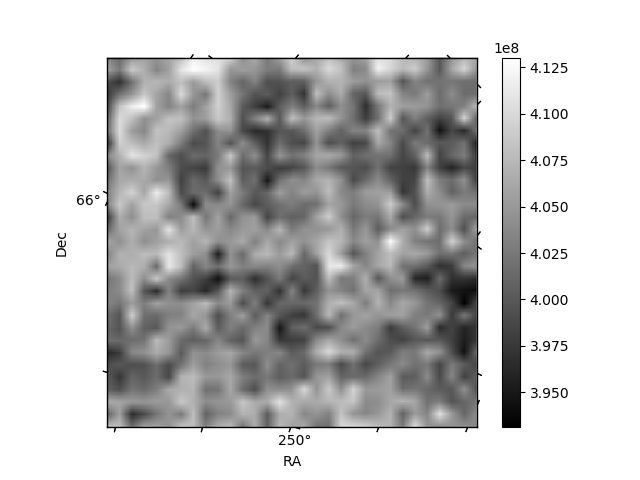
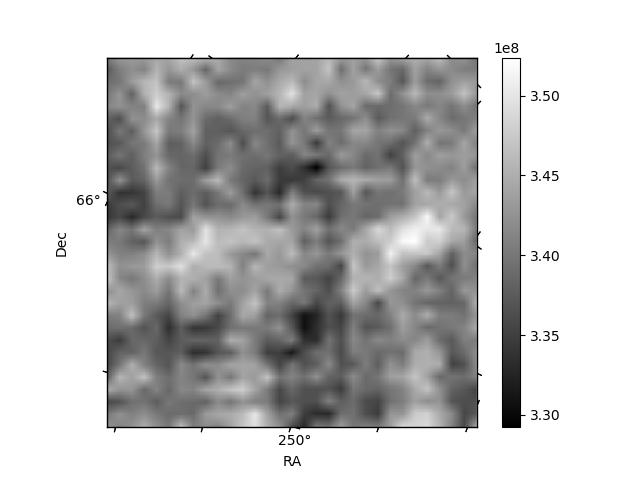
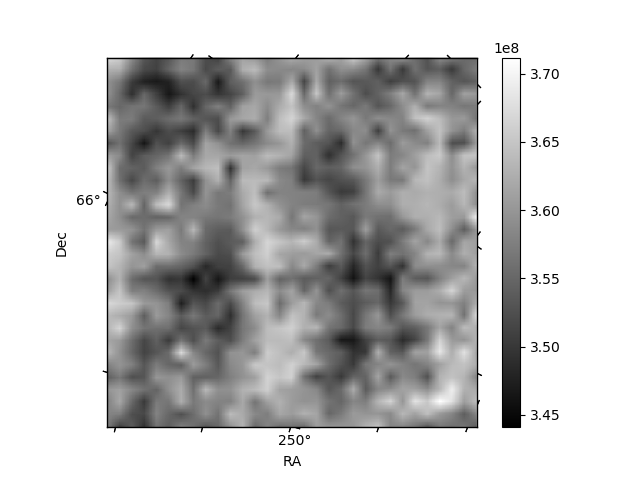
Histogram calculated using DETX and DETY for each event in the final _common_clean file
| Quadrant A | 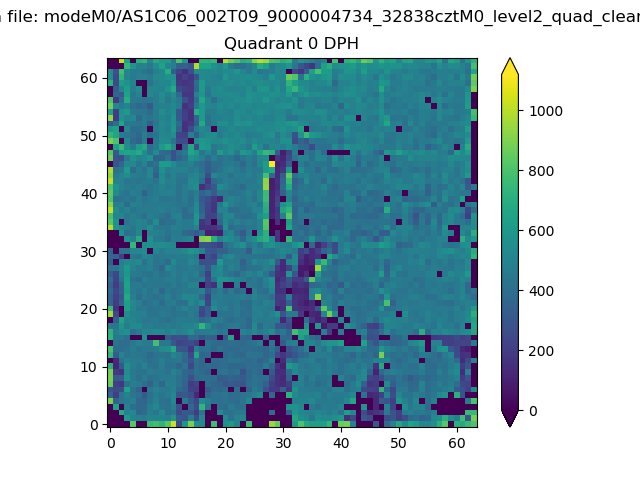 |
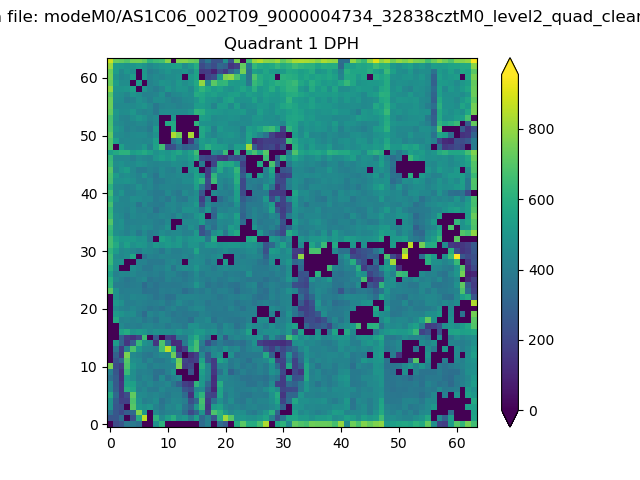 |
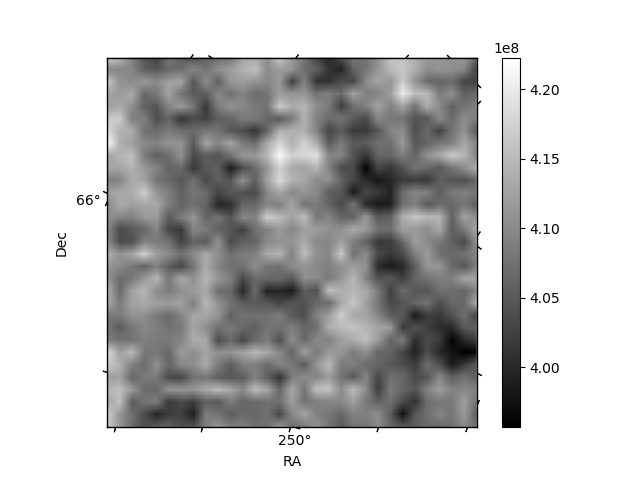
Quadrant B |
|---|---|---|---|
| Quadrant D | 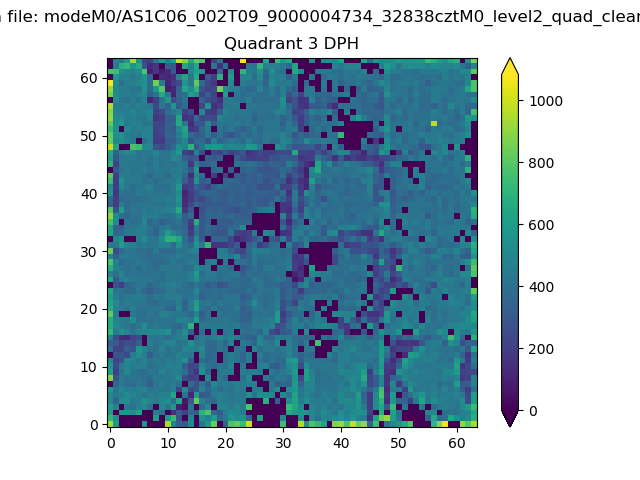 |
 |
Quadrant C |
| Plot type | Count rate plots | Images |
|---|---|---|
| Comparison with Poisson distribution Blue bars denote a histogram of data divided into 1 sec bins. Red curve is a Poisson curve with rate = median count rate of data. |
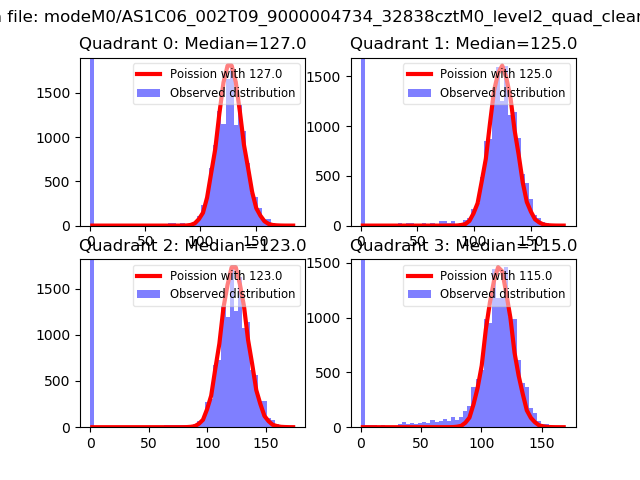 |
 |
| Quadrant-wise count rates Data is divided into 100 sec bins |
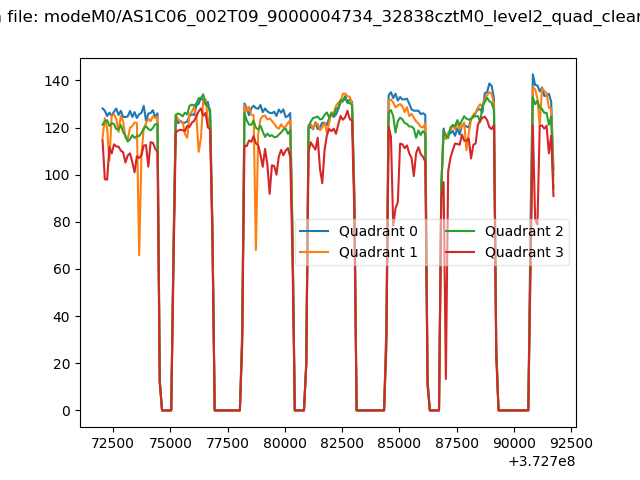 |
|
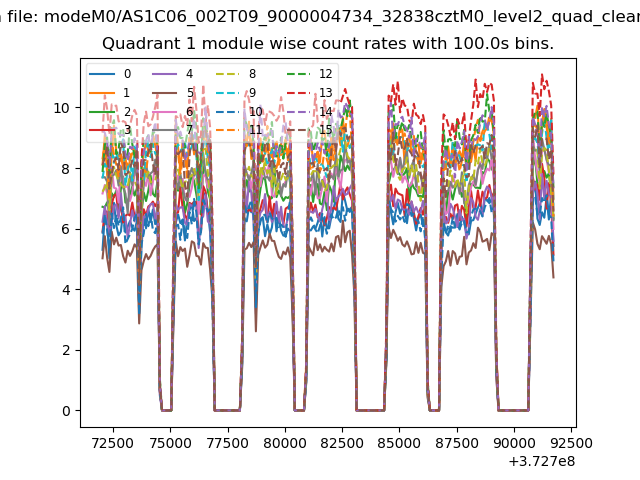
| Module-wise count rates for Quadrant A Data is divided into 100 sec bins |
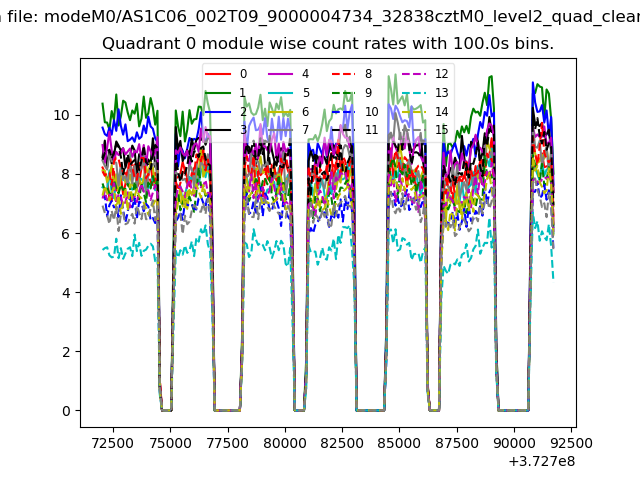 |
 |
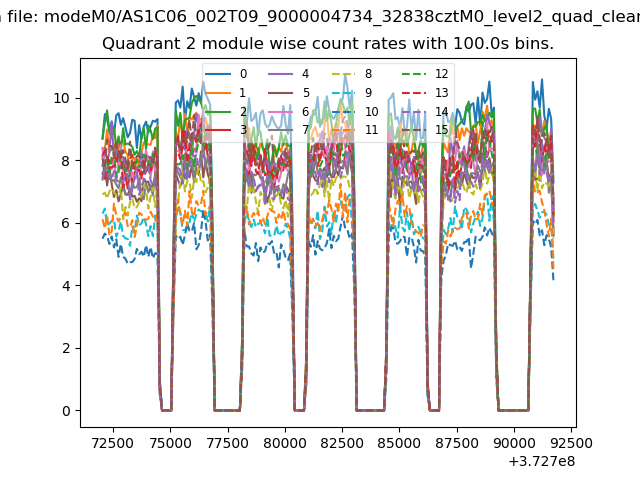
| Module-wise count rates for Quadrant B Data is divided into 100 sec bins |
 |
 |
| Module-wise count rates for Quadrant C Data is divided into 100 sec bins |
 |
 |
| Module-wise count rates for Quadrant D Data is divided into 100 sec bins |
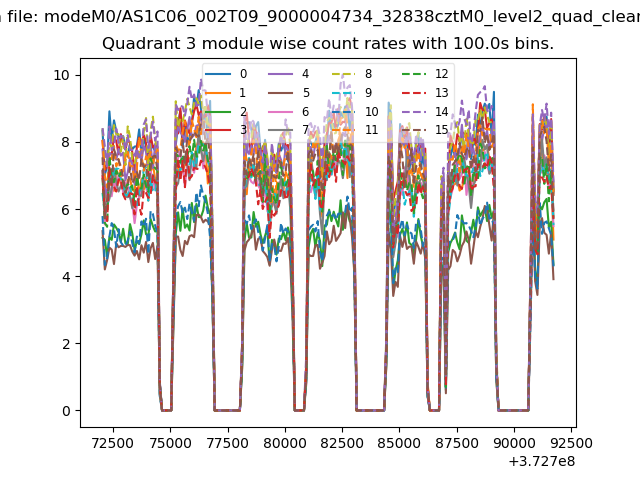 |
 |
| Parameter | Plot |
|---|---|
| CZT HV Monitor | 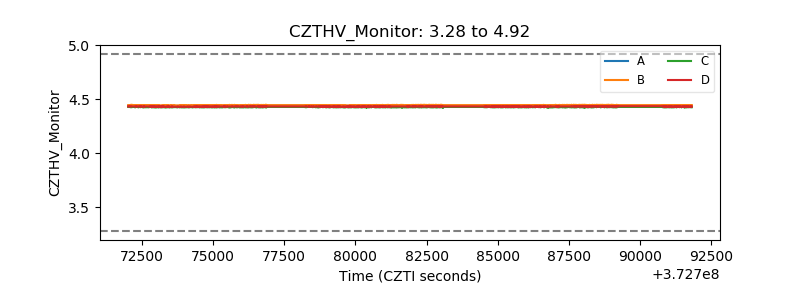 |
| D_VDD | 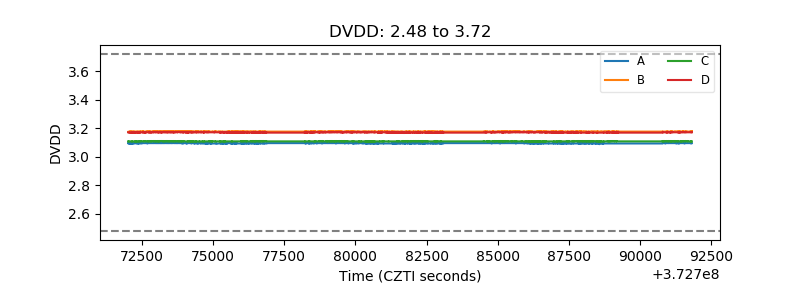 |
| Temperature 1 | 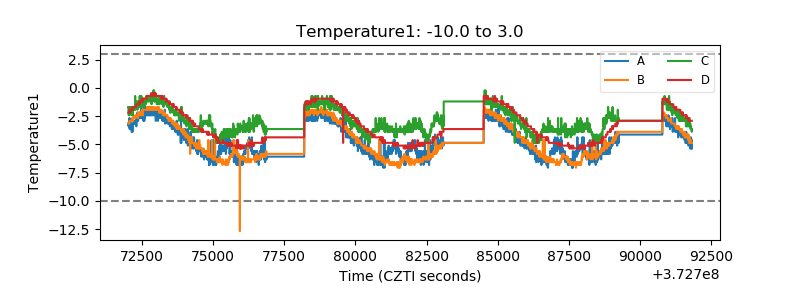 |
| Veto HV Monitor | 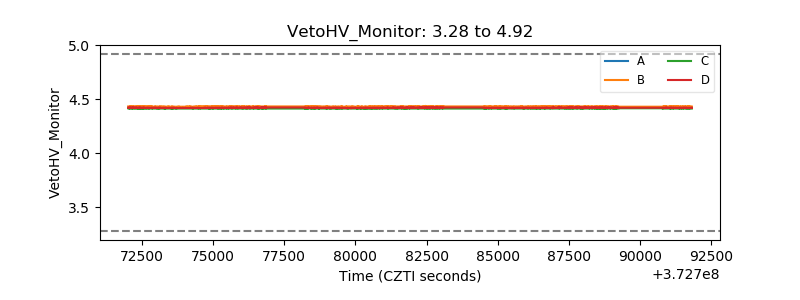 |
| Veto LLD | 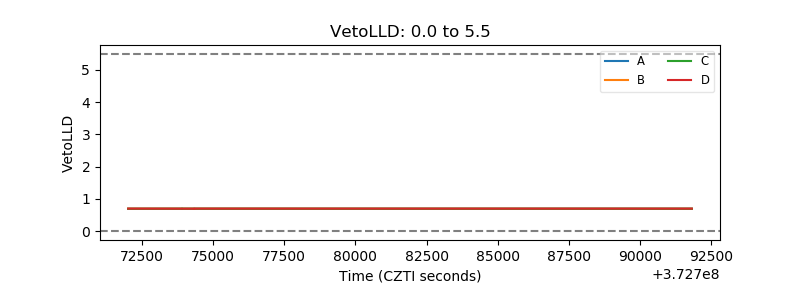 |
| Alpha Counter | 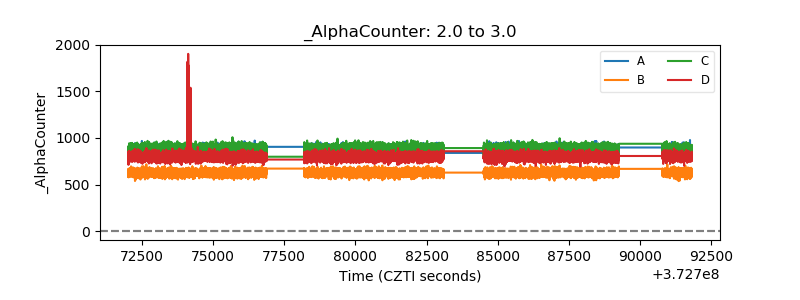 |
| _CPM_Rate | 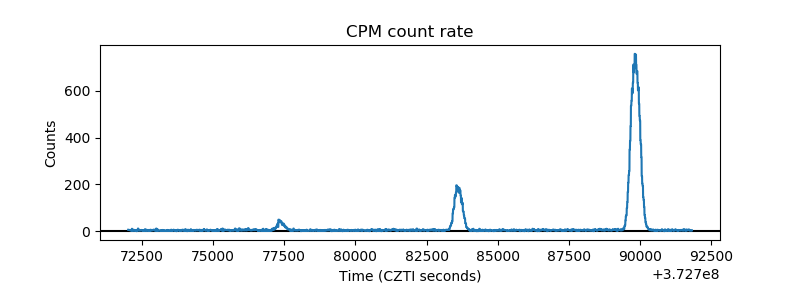 |
| CZT Counter | 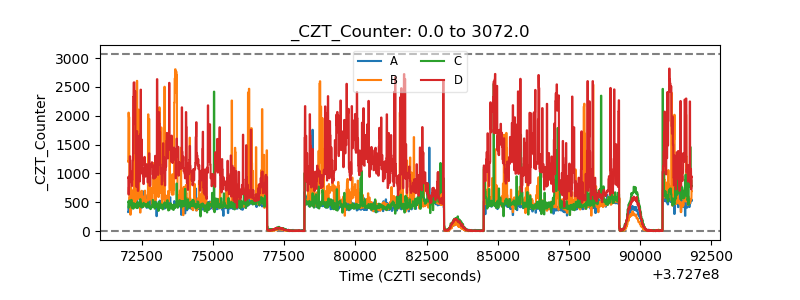 |
| +2.5 Volts monitor |  |
| +5 Volts monitor |  |
| _ROLL_ROT | 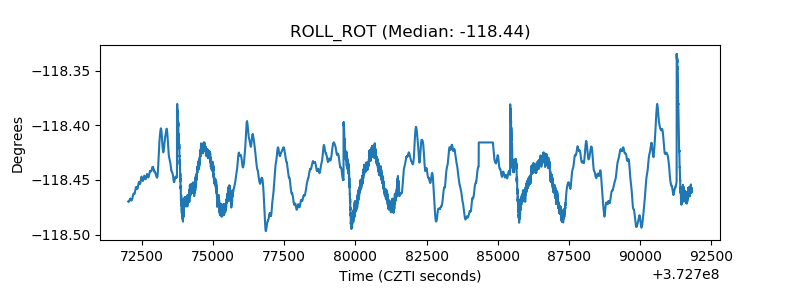 |
| _Roll_DEC | 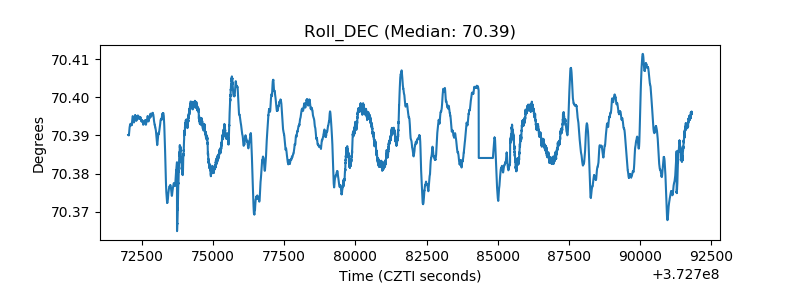 |
| _Roll_RA | 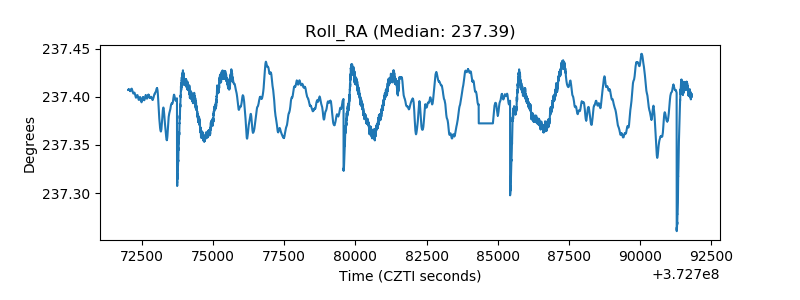 |
| Veto Counter | 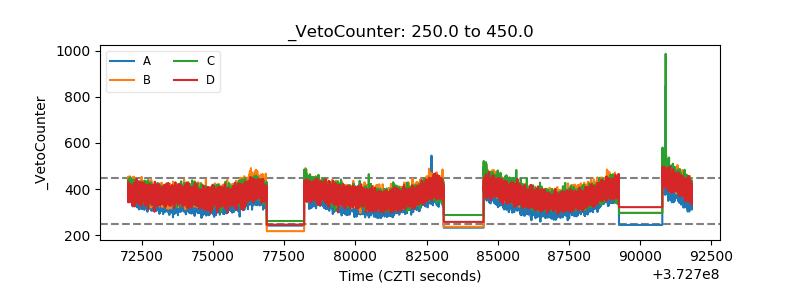 |