| Param | Original file | Final file |
|---|---|---|
| Filename | modeM0/AS1C06_002T09_9000004734_32839cztM0_level2.evt | modeM0/AS1C06_002T09_9000004734_32839cztM0_level2_quad_clean.evt |
| Size (bytes) | 547,459,200 | 93,576,960 |
| Size | 522.1 MB | 89.2 MB |
| Events in quadrant A | 2,652,628 | 637,340 |
| Events in quadrant B | 3,274,560 | 626,770 |
| Events in quadrant C | 3,940,489 | 619,960 |
| Events in quadrant D | 6,339,371 | 563,893 |
| Mode M9 | |||
|---|---|---|---|
| Quadrant | BADHDUFLAG | Total packets | Discarded packets |
| A | 0 | 21 | 0 |
| B | 0 | 21 | 0 |
| C | 0 | 21 | 0 |
| D | 0 | 22 | 0 |
| Mode M0 | |||
|---|---|---|---|
| Quadrant | BADHDUFLAG | Total packets | Discarded packets |
| A | 0 | 11492 | 3 |
| B | 0 | 13433 | 2 |
| C | 0 | 15444 | 2 |
| D | 0 | 22835 | 2 |
| Mode SS | |||
|---|---|---|---|
| Quadrant | BADHDUFLAG | Total packets | Discarded packets |
| A | 0 | 112 | 0 |
| B | 0 | 112 | 0 |
| C | 0 | 112 | 0 |
| D | 0 | 112 | 0 |
| Quadrant | Total seconds | Saturated seconds | Saturation percentage |
|---|---|---|---|
| A | 5513 | 13 | 0.235806% |
| B | 5513 | 161 | 2.920370% |
| C | 5513 | 82 | 1.487393% |
| D | 5513 | 654 | 11.862870% |
Noise dominated data is calculated using 1-second bins in cleaned event files. If a bin has >2000 counts, and if more than 50% of those come from <1% of pixels, then it is considered to be noise-dominated and hence unusable.
| Quadrant | # 1 sec bins | Bins with >0 counts | Bins with >2000 counts | High rate bins dominated by noise | Noise dominated (total time) | Noise dominated (detector-on time) | Marked lightcurve |
|---|---|---|---|---|---|---|---|
| A | 7156 | 5514 | 1 | 1 | 0.01% | 0.02% | 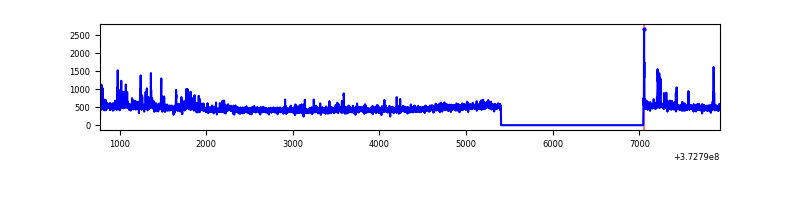 |
| B | 7156 | 5514 | 99 | 99 | 1.38% | 1.80% | 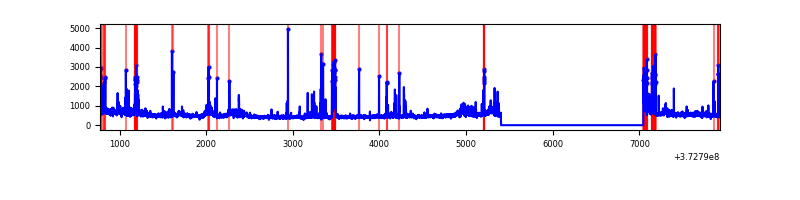 |
| C | 7156 | 5514 | 62 | 62 | 0.87% | 1.12% |  |
| D | 7156 | 5514 | 546 | 546 | 7.63% | 9.90% | 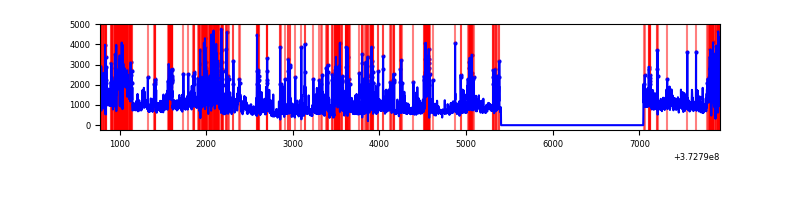 |
Top three noisy pixels from each quadrant. If the there are fewer than three noisy pixels in the level2.evt file, extra rows are filled as -1
| Pixel properties | Quadrant properties | ||||||
|---|---|---|---|---|---|---|---|
| Quadrant | DetID | PixID | Counts | Sigma | Mean | Median | Sigma |
| A | 12 | 16 | 64817 | 494.11 | 642 | 629 | 129.9 |
| A | 14 | 238 | 53868 | 409.83 | 642 | 629 | 129.9 |
| A | 12 | 194 | 13295 | 97.5 | 642 | 629 | 129.9 |
| B | 5 | 172 | 436648 | 3602.39 | 635 | 617 | 121.0 |
| B | 0 | 219 | 101695 | 835.08 | 635 | 617 | 121.0 |
| B | 15 | 85 | 50822 | 414.78 | 635 | 617 | 121.0 |
| C | 3 | 233 | 961507 | 6630.47 | 624 | 630 | 144.9 |
| C | 9 | 160 | 395454 | 2724.46 | 624 | 630 | 144.9 |
| C | 0 | 10 | 57104 | 389.7 | 624 | 630 | 144.9 |
| D | 8 | 195 | 1297228 | 8732.58 | 595 | 579 | 148.5 |
| D | 2 | 250 | 645526 | 4343.54 | 595 | 579 | 148.5 |
| D | 7 | 80 | 575857 | 3874.34 | 595 | 579 | 148.5 |
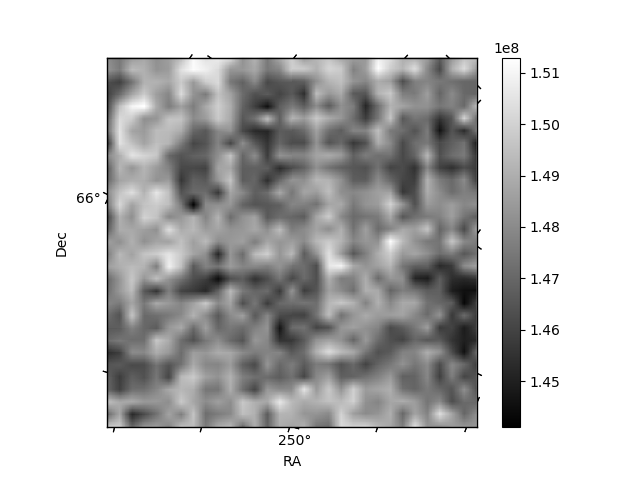
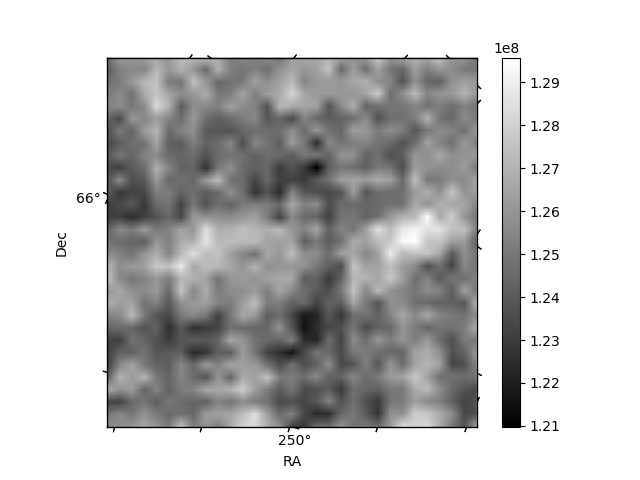
Histogram calculated using DETX and DETY for each event in the final _common_clean file
| Quadrant A |  |
 |
Quadrant B |
|---|---|---|---|
| Quadrant D | 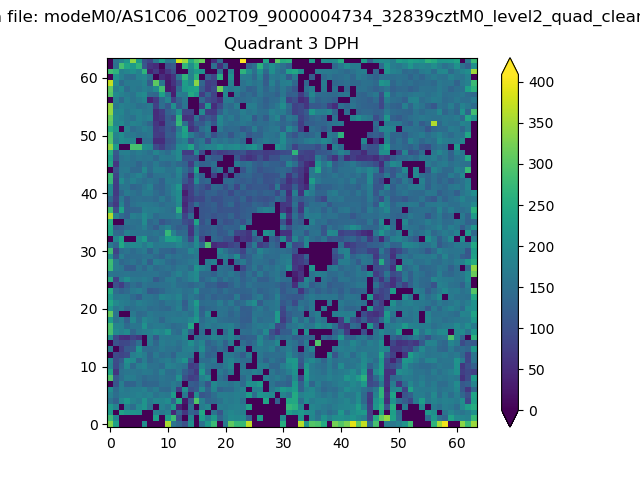 |
 |
Quadrant C |
| Plot type | Count rate plots | Images |
|---|---|---|
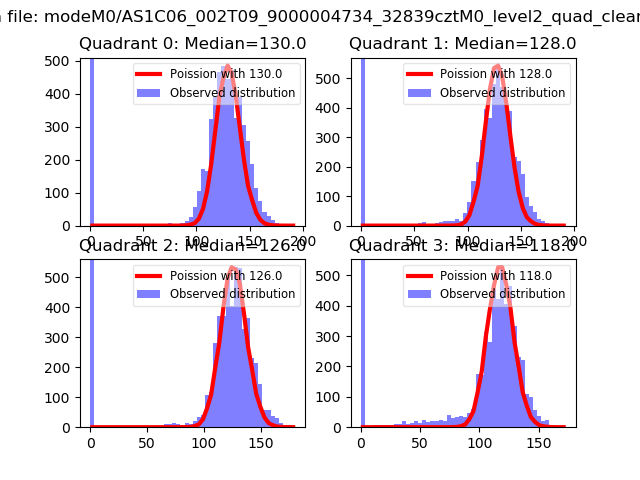
| Comparison with Poisson distribution Blue bars denote a histogram of data divided into 1 sec bins. Red curve is a Poisson curve with rate = median count rate of data. |
 |
 |
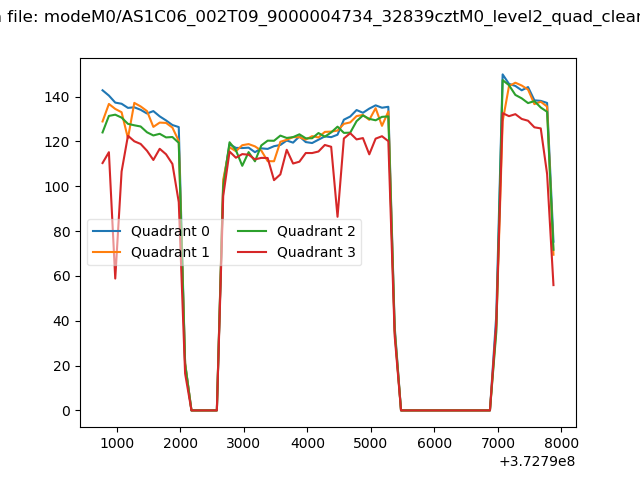
| Quadrant-wise count rates Data is divided into 100 sec bins |
 |
|
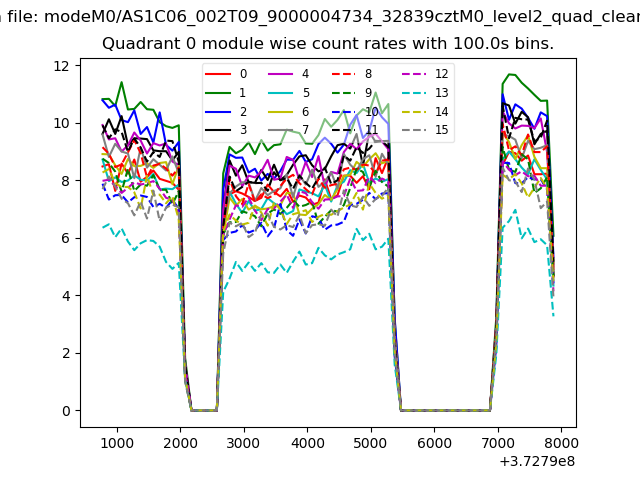
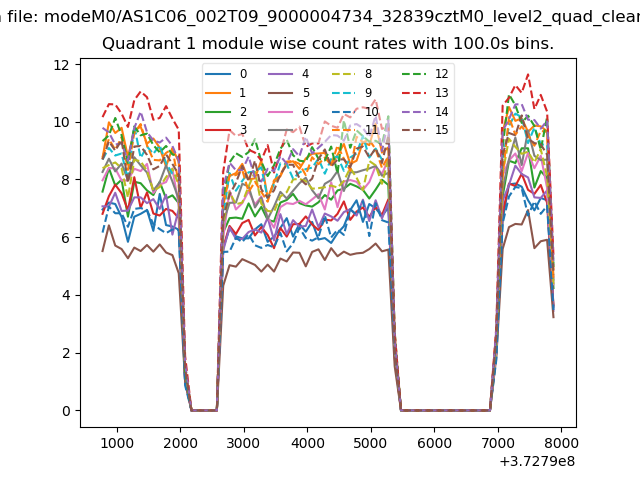
| Module-wise count rates for Quadrant A Data is divided into 100 sec bins |
 |
 |
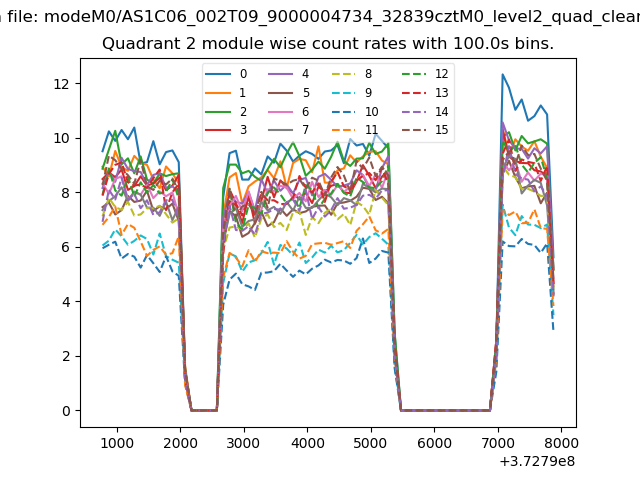
| Module-wise count rates for Quadrant B Data is divided into 100 sec bins |
 |
 |
| Module-wise count rates for Quadrant C Data is divided into 100 sec bins |
 |
 |
| Module-wise count rates for Quadrant D Data is divided into 100 sec bins |
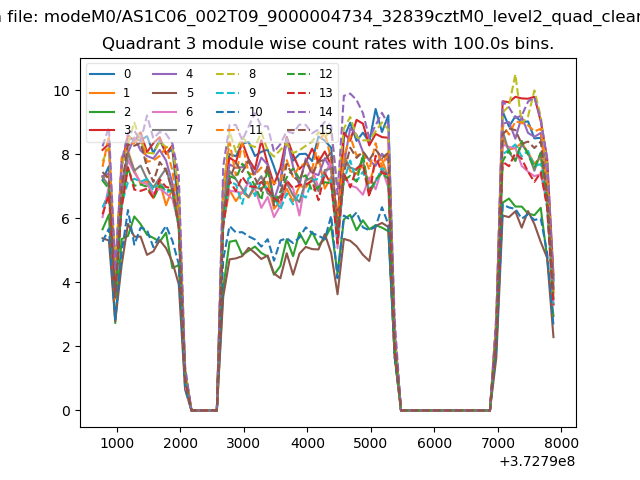 |
 |
| Parameter | Plot |
|---|---|
| CZT HV Monitor | 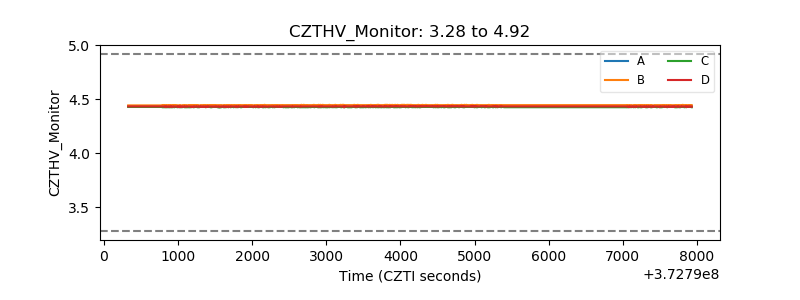 |
| D_VDD |  |
| Temperature 1 | 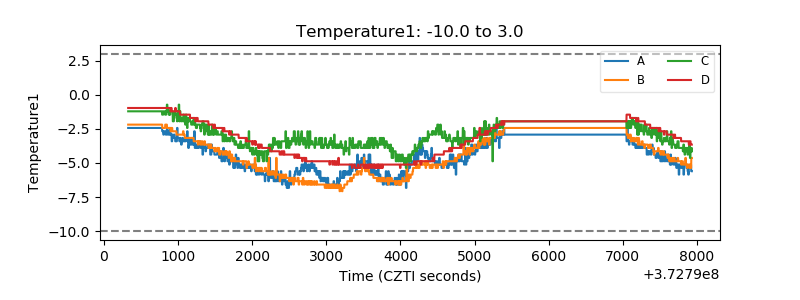 |
| Veto HV Monitor | 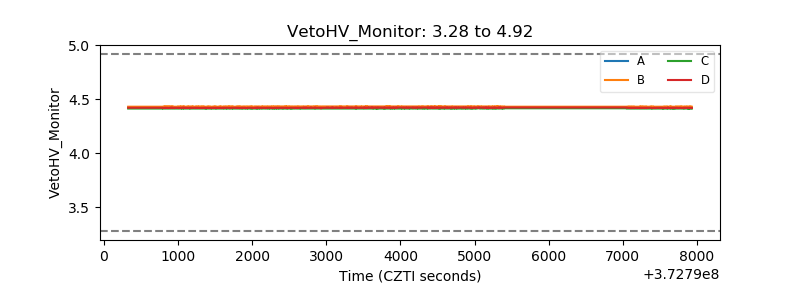 |
| Veto LLD | 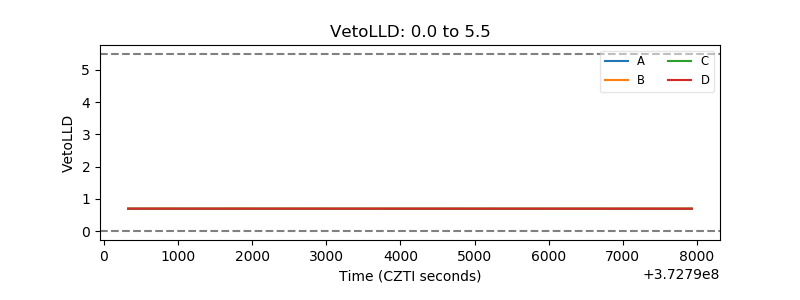 |
| Alpha Counter | 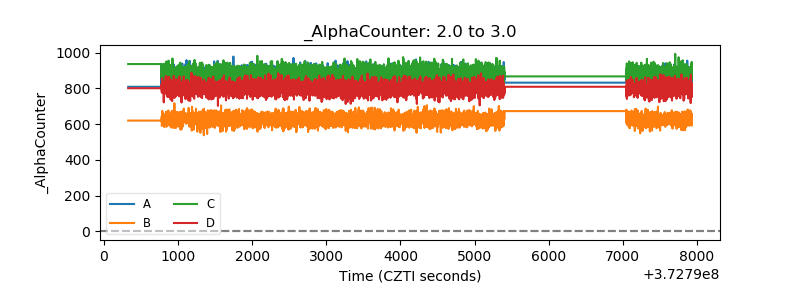 |
| _CPM_Rate | 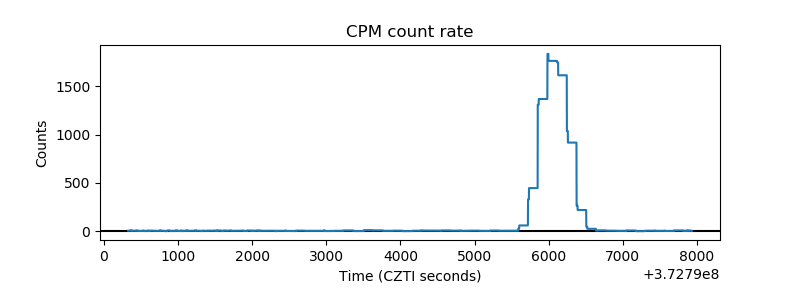 |
| CZT Counter | 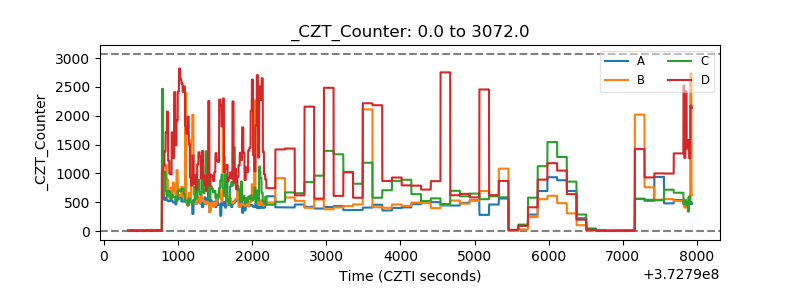 |
| +2.5 Volts monitor |  |
| +5 Volts monitor |  |
| _ROLL_ROT | 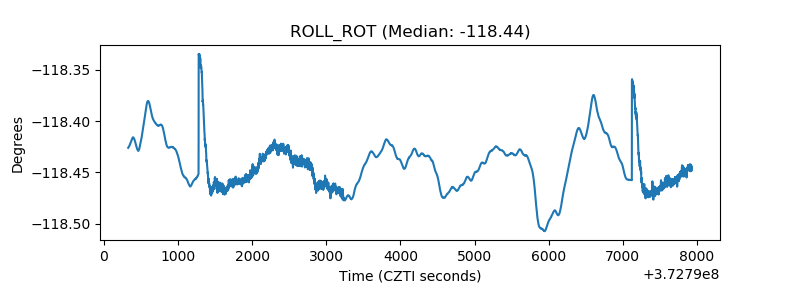 |
| _Roll_DEC | 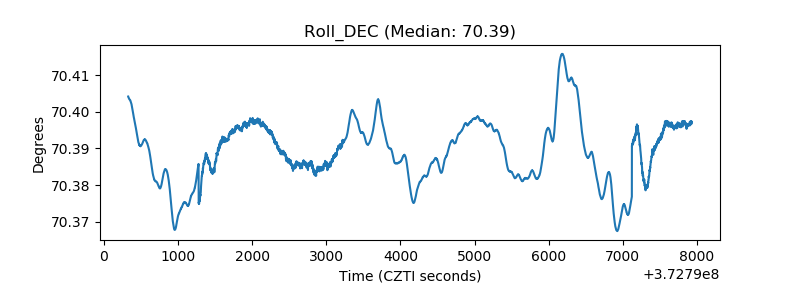 |
| _Roll_RA | 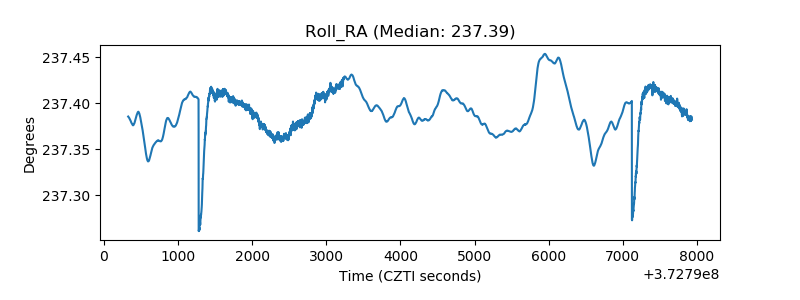 |
| Veto Counter | 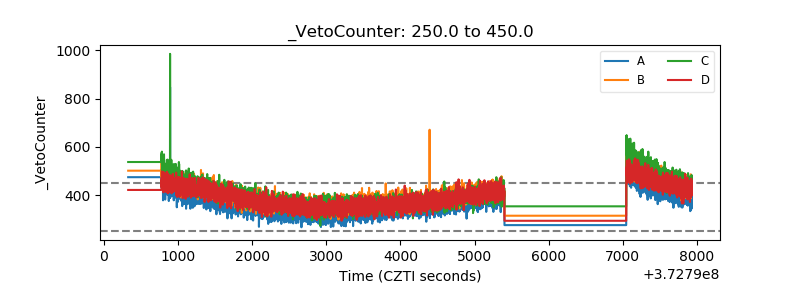 |