| Param | Original file | Final file |
|---|---|---|
| Filename | modeM0/AS1C06_002T09_9000004734_32841cztM0_level2.evt | modeM0/AS1C06_002T09_9000004734_32841cztM0_level2_quad_clean.evt |
| Size (bytes) | 473,091,840 | 87,572,160 |
| Size | 451.2 MB | 83.5 MB |
| Events in quadrant A | 2,518,961 | 581,874 |
| Events in quadrant B | 2,937,952 | 581,729 |
| Events in quadrant C | 2,757,598 | 581,659 |
| Events in quadrant D | 5,753,268 | 535,065 |
| Mode M9 | |||
|---|---|---|---|
| Quadrant | BADHDUFLAG | Total packets | Discarded packets |
| A | 0 | 27 | 0 |
| B | 0 | 27 | 0 |
| C | 0 | 27 | 0 |
| D | 0 | 28 | 0 |
| Mode M0 | |||
|---|---|---|---|
| Quadrant | BADHDUFLAG | Total packets | Discarded packets |
| A | 0 | 10920 | 3 |
| B | 0 | 12188 | 2 |
| C | 0 | 11586 | 2 |
| D | 0 | 20950 | 2 |
| Mode SS | |||
|---|---|---|---|
| Quadrant | BADHDUFLAG | Total packets | Discarded packets |
| A | 0 | 108 | 0 |
| B | 0 | 108 | 0 |
| C | 0 | 108 | 0 |
| D | 0 | 108 | 0 |
| Quadrant | Total seconds | Saturated seconds | Saturation percentage |
|---|---|---|---|
| A | 5309 | 12 | 0.226031% |
| B | 5309 | 97 | 1.827086% |
| C | 5309 | 35 | 0.659258% |
| D | 5309 | 319 | 6.008665% |
Noise dominated data is calculated using 1-second bins in cleaned event files. If a bin has >2000 counts, and if more than 50% of those come from <1% of pixels, then it is considered to be noise-dominated and hence unusable.
| Quadrant | # 1 sec bins | Bins with >0 counts | Bins with >2000 counts | High rate bins dominated by noise | Noise dominated (total time) | Noise dominated (detector-on time) | Marked lightcurve |
|---|---|---|---|---|---|---|---|
| A | 7073 | 5310 | 2 | 2 | 0.03% | 0.04% | 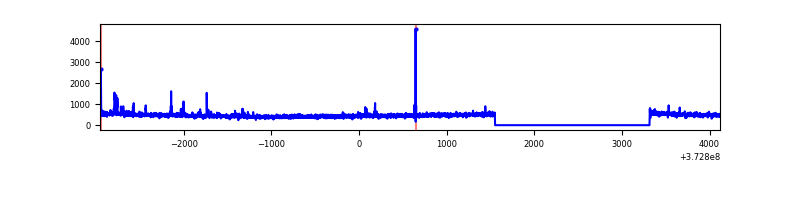 |
| B | 7073 | 5310 | 58 | 58 | 0.82% | 1.09% | 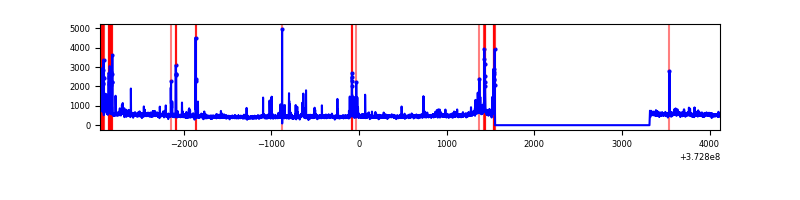 |
| C | 7073 | 5310 | 22 | 22 | 0.31% | 0.41% | 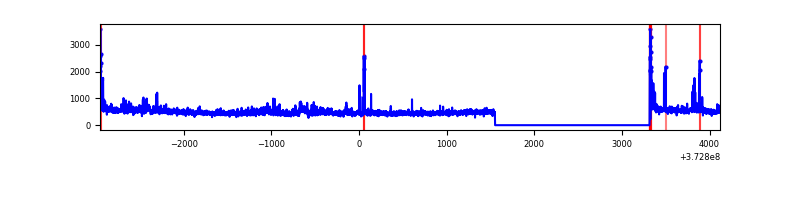 |
| D | 7073 | 5310 | 256 | 256 | 3.62% | 4.82% | 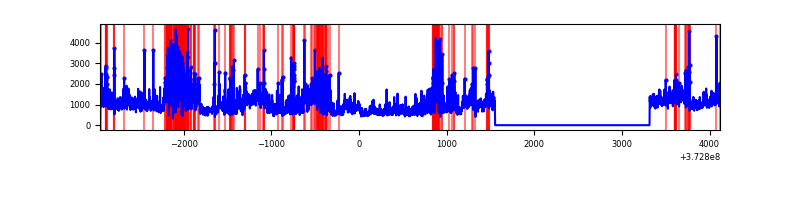 |
Top three noisy pixels from each quadrant. If the there are fewer than three noisy pixels in the level2.evt file, extra rows are filled as -1
| Pixel properties | Quadrant properties | ||||||
|---|---|---|---|---|---|---|---|
| Quadrant | DetID | PixID | Counts | Sigma | Mean | Median | Sigma |
| A | 14 | 238 | 50174 | 398.81 | 623 | 611 | 124.3 |
| A | 9 | 143 | 16455 | 127.49 | 623 | 611 | 124.3 |
| A | 12 | 16 | 12795 | 98.04 | 623 | 611 | 124.3 |
| B | 5 | 172 | 269276 | 2298.71 | 623 | 608 | 116.9 |
| B | 0 | 219 | 81559 | 692.61 | 623 | 608 | 116.9 |
| B | 0 | 197 | 44693 | 377.19 | 623 | 608 | 116.9 |
| C | 3 | 233 | 152459 | 1073.45 | 613 | 618 | 141.5 |
| C | 0 | 10 | 70147 | 491.54 | 613 | 618 | 141.5 |
| C | 9 | 160 | 60402 | 422.65 | 613 | 618 | 141.5 |
| D | 8 | 195 | 1872385 | 12695.34 | 592 | 576 | 147.4 |
| D | 2 | 250 | 649049 | 4398.2 | 592 | 576 | 147.4 |
| D | 10 | 203 | 299300 | 2026.06 | 592 | 576 | 147.4 |
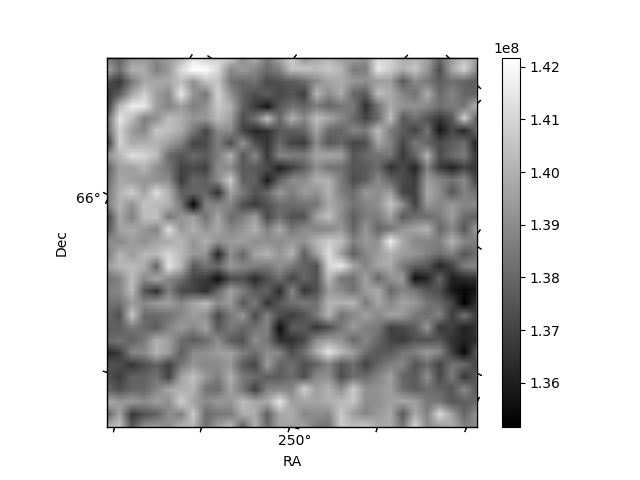
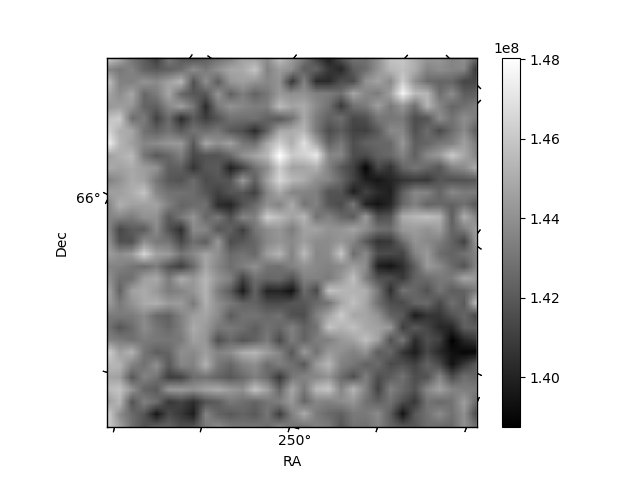
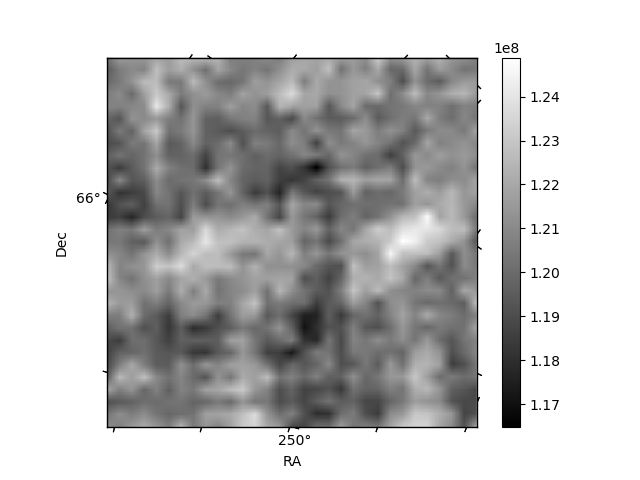
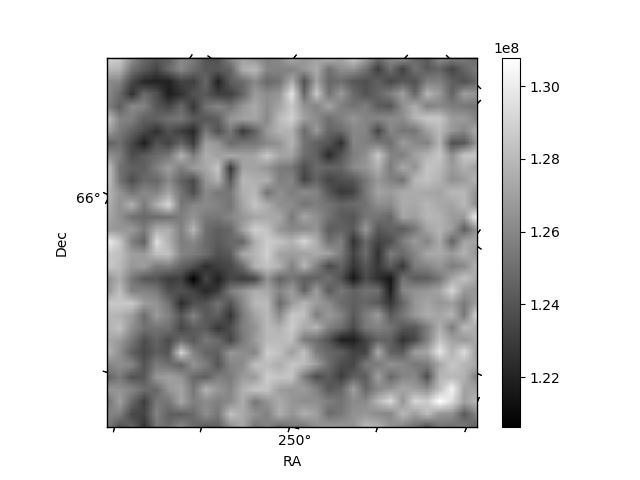
Histogram calculated using DETX and DETY for each event in the final _common_clean file
| Quadrant A | 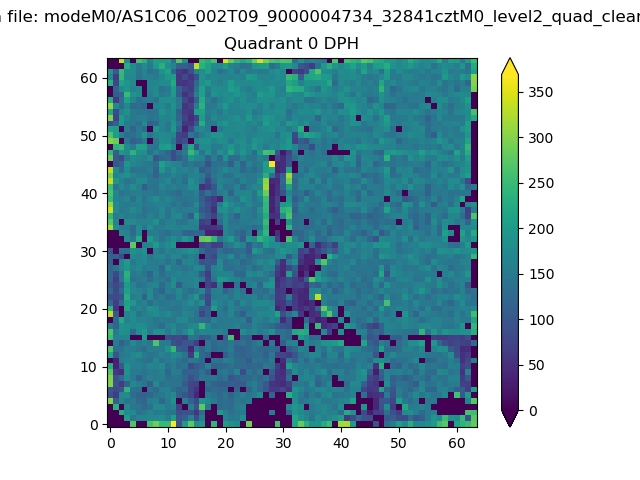 |
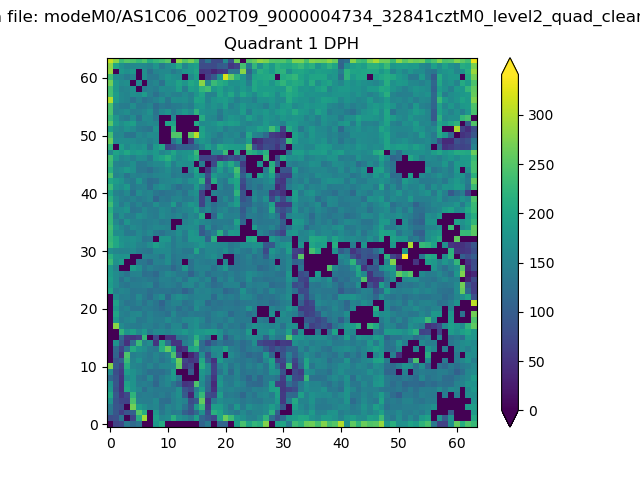 |
Quadrant B |
|---|---|---|---|
| Quadrant D | 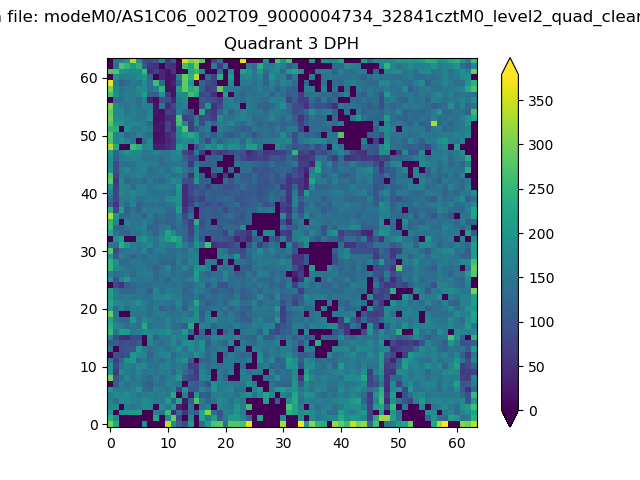 |
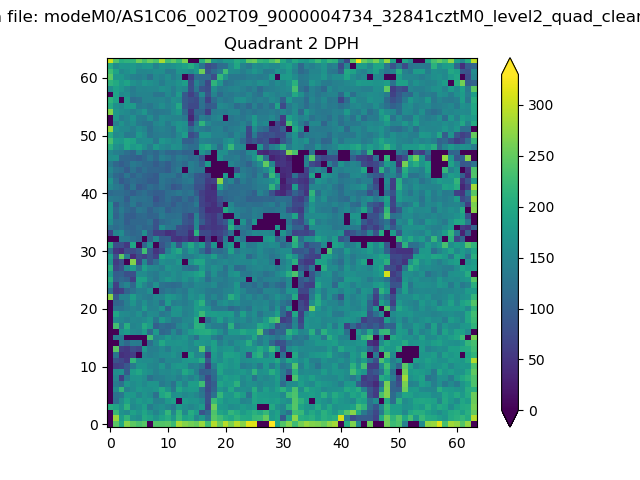 |
Quadrant C |
| Plot type | Count rate plots | Images |
|---|---|---|
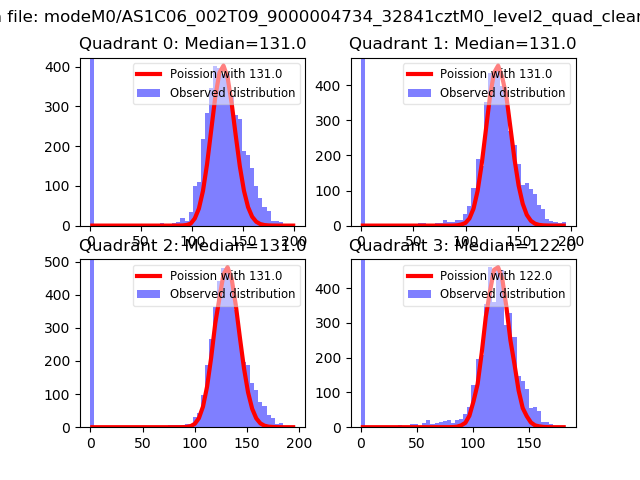
| Comparison with Poisson distribution Blue bars denote a histogram of data divided into 1 sec bins. Red curve is a Poisson curve with rate = median count rate of data. |
 |
 |
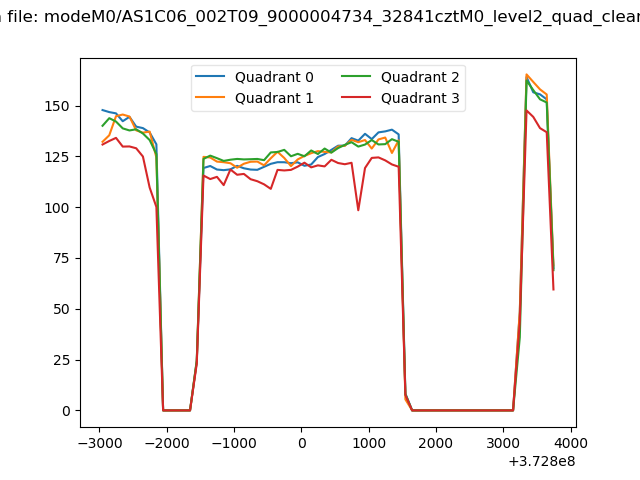
| Quadrant-wise count rates Data is divided into 100 sec bins |
 |
|
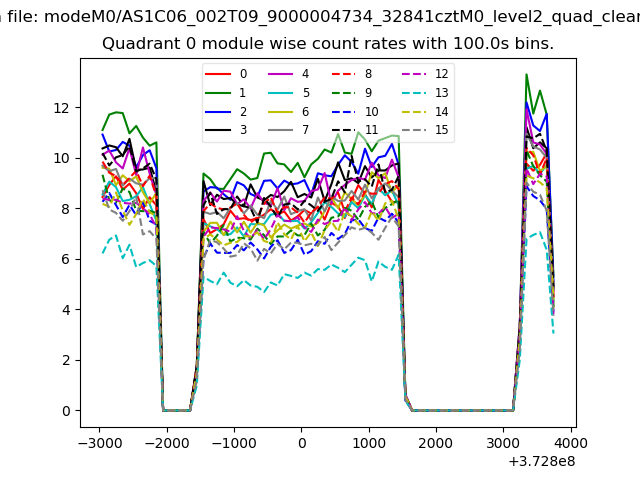
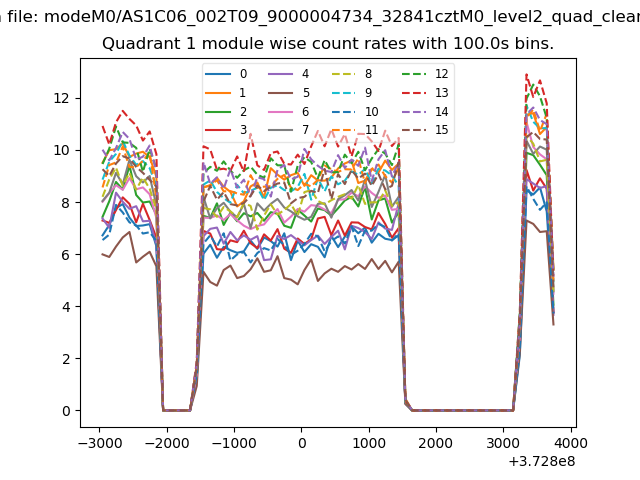
| Module-wise count rates for Quadrant A Data is divided into 100 sec bins |
 |
 |
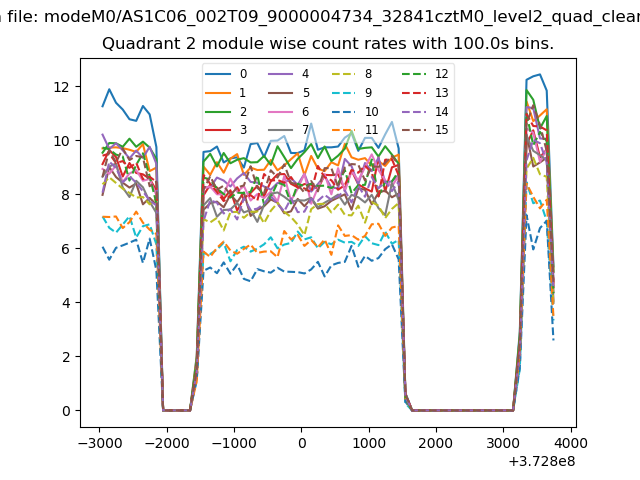
| Module-wise count rates for Quadrant B Data is divided into 100 sec bins |
 |
 |
| Module-wise count rates for Quadrant C Data is divided into 100 sec bins |
 |
 |
| Module-wise count rates for Quadrant D Data is divided into 100 sec bins |
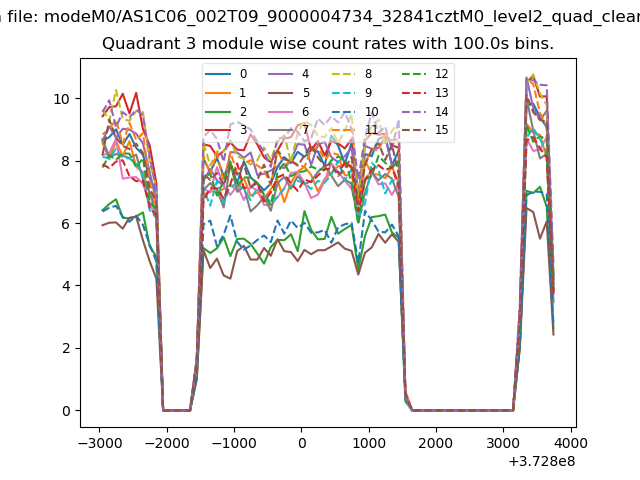 |
 |
| Parameter | Plot |
|---|---|
| CZT HV Monitor | 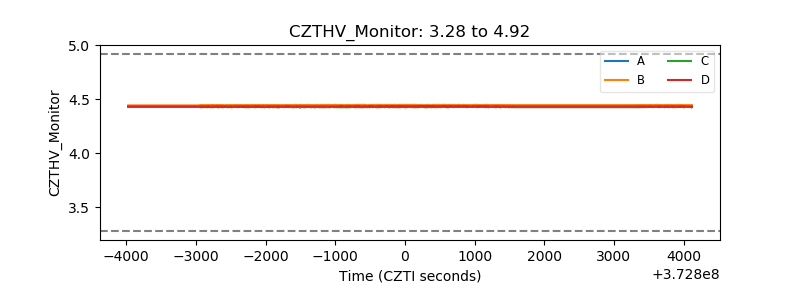 |
| D_VDD | 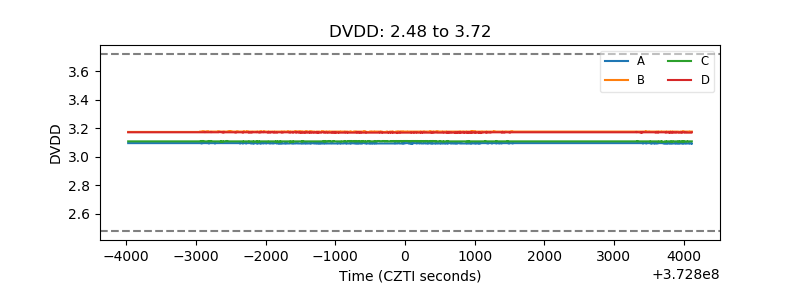 |
| Temperature 1 | 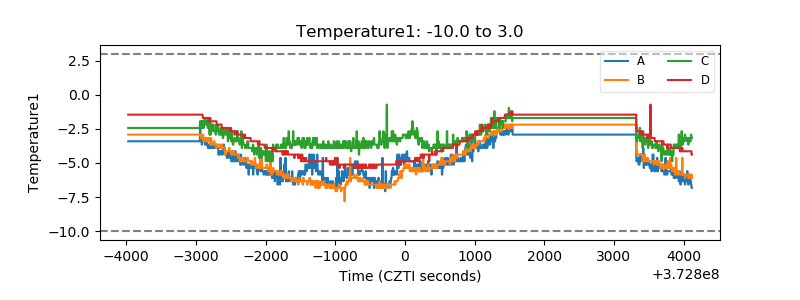 |
| Veto HV Monitor |  |
| Veto LLD | 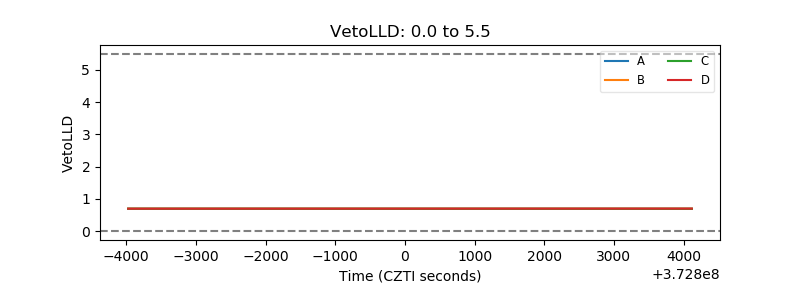 |
| Alpha Counter | 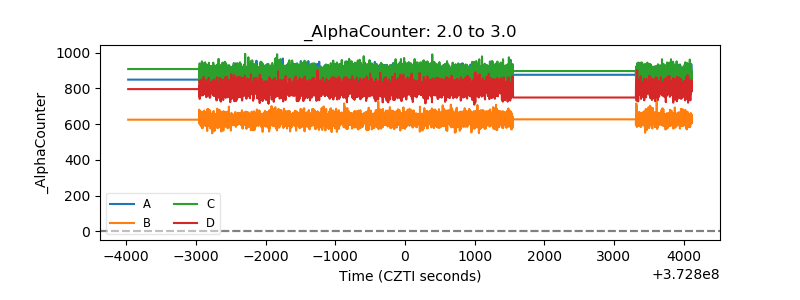 |
| _CPM_Rate | 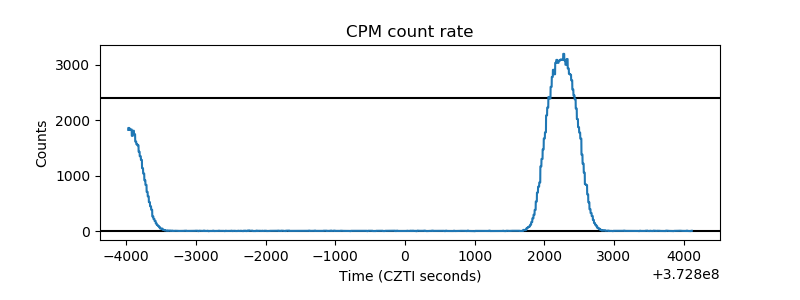 |
| CZT Counter | 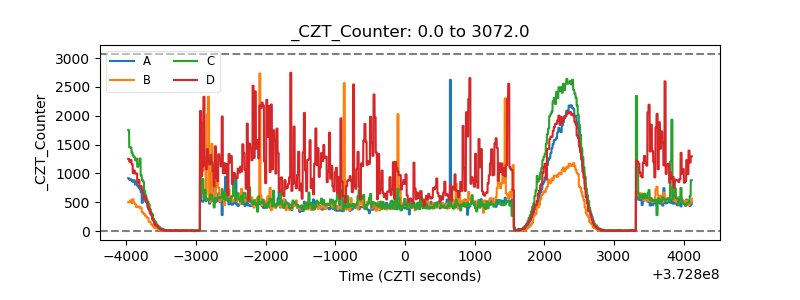 |
| +2.5 Volts monitor |  |
| +5 Volts monitor |  |
| _ROLL_ROT | 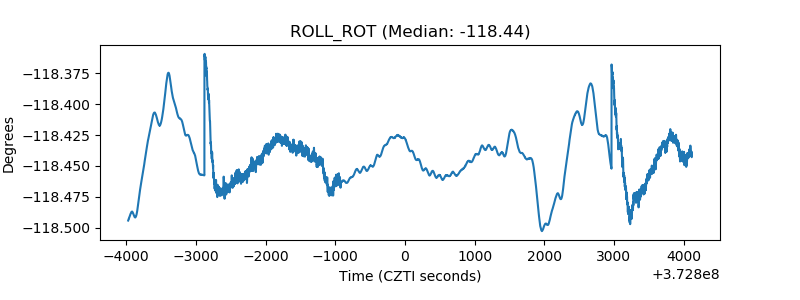 |
| _Roll_DEC | 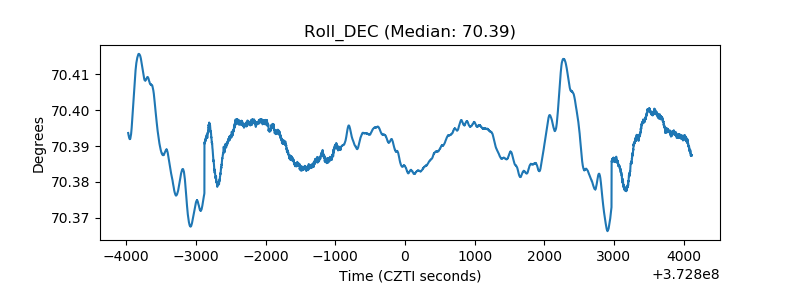 |
| _Roll_RA |  |
| Veto Counter | 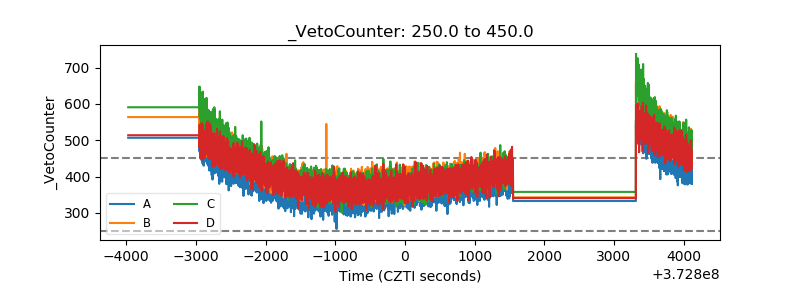 |