| Param | Original file | Final file |
|---|---|---|
| Filename | modeM0/AS1C06_002T09_9000004734_32842cztM0_level2.evt | modeM0/AS1C06_002T09_9000004734_32842cztM0_level2_quad_clean.evt |
| Size (bytes) | 521,285,760 | 89,997,120 |
| Size | 497.1 MB | 85.8 MB |
| Events in quadrant A | 2,607,866 | 595,718 |
| Events in quadrant B | 3,084,142 | 601,977 |
| Events in quadrant C | 3,611,329 | 594,463 |
| Events in quadrant D | 6,111,154 | 548,065 |
| Mode M9 | |||
|---|---|---|---|
| Quadrant | BADHDUFLAG | Total packets | Discarded packets |
| A | 0 | 32 | 0 |
| B | 0 | 32 | 0 |
| C | 0 | 32 | 0 |
| D | 0 | 33 | 0 |
| Mode M0 | |||
|---|---|---|---|
| Quadrant | BADHDUFLAG | Total packets | Discarded packets |
| A | 0 | 11298 | 3 |
| B | 0 | 12669 | 2 |
| C | 0 | 14442 | 2 |
| D | 0 | 22036 | 2 |
| Mode SS | |||
|---|---|---|---|
| Quadrant | BADHDUFLAG | Total packets | Discarded packets |
| A | 0 | 112 | 0 |
| B | 0 | 112 | 0 |
| C | 0 | 112 | 0 |
| D | 0 | 112 | 0 |
| Quadrant | Total seconds | Saturated seconds | Saturation percentage |
|---|---|---|---|
| A | 5505 | 13 | 0.236149% |
| B | 5505 | 93 | 1.689373% |
| C | 5505 | 111 | 2.016349% |
| D | 5505 | 628 | 11.407811% |
Noise dominated data is calculated using 1-second bins in cleaned event files. If a bin has >2000 counts, and if more than 50% of those come from <1% of pixels, then it is considered to be noise-dominated and hence unusable.
| Quadrant | # 1 sec bins | Bins with >0 counts | Bins with >2000 counts | High rate bins dominated by noise | Noise dominated (total time) | Noise dominated (detector-on time) | Marked lightcurve |
|---|---|---|---|---|---|---|---|
| A | 7386 | 5506 | 6 | 6 | 0.08% | 0.11% | 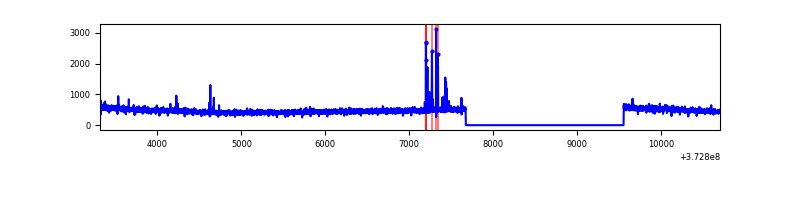 |
| B | 7386 | 5506 | 52 | 52 | 0.70% | 0.94% | 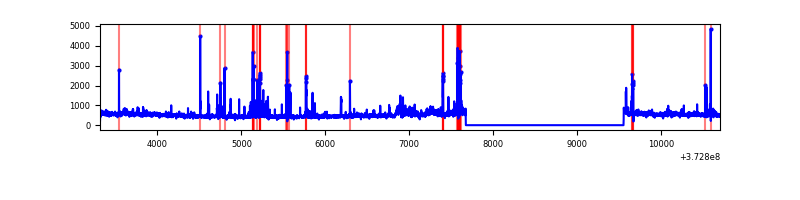 |
| C | 7386 | 5506 | 83 | 83 | 1.12% | 1.51% | 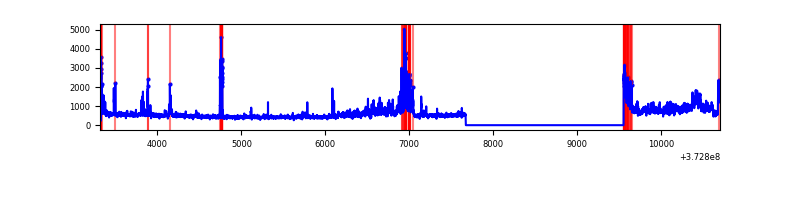 |
| D | 7386 | 5506 | 577 | 577 | 7.81% | 10.48% | 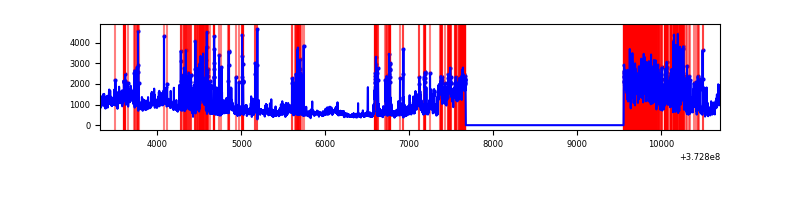 |
Top three noisy pixels from each quadrant. If the there are fewer than three noisy pixels in the level2.evt file, extra rows are filled as -1
| Pixel properties | Quadrant properties | ||||||
|---|---|---|---|---|---|---|---|
| Quadrant | DetID | PixID | Counts | Sigma | Mean | Median | Sigma |
| A | 15 | 174 | 41126 | 308.24 | 660 | 647 | 131.3 |
| A | 13 | 254 | 9942 | 70.78 | 660 | 647 | 131.3 |
| A | 9 | 143 | 9298 | 65.88 | 660 | 647 | 131.3 |
| B | 5 | 172 | 242770 | 1966.72 | 664 | 649 | 123.1 |
| B | 0 | 219 | 53995 | 433.32 | 664 | 649 | 123.1 |
| B | 0 | 189 | 28873 | 229.26 | 664 | 649 | 123.1 |
| C | 3 | 233 | 767317 | 5143.57 | 649 | 655 | 149.1 |
| C | 1 | 241 | 187272 | 1252.02 | 649 | 655 | 149.1 |
| C | 0 | 10 | 80461 | 535.42 | 649 | 655 | 149.1 |
| D | 8 | 195 | 1238175 | 7984.37 | 620 | 607 | 155.0 |
| D | 12 | 227 | 1024256 | 6604.24 | 620 | 607 | 155.0 |
| D | 2 | 250 | 401915 | 2589.1 | 620 | 607 | 155.0 |
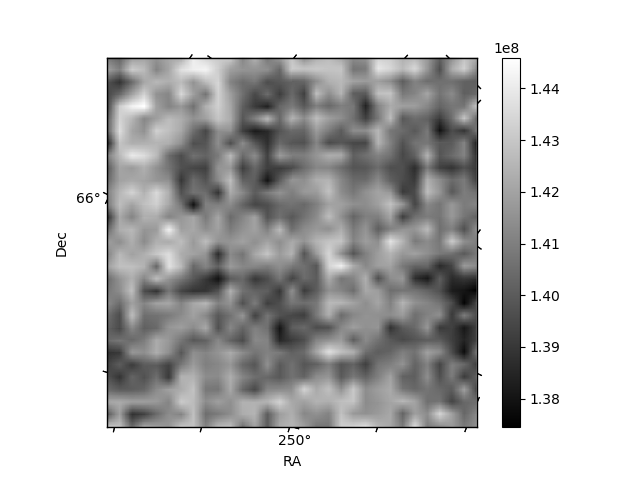
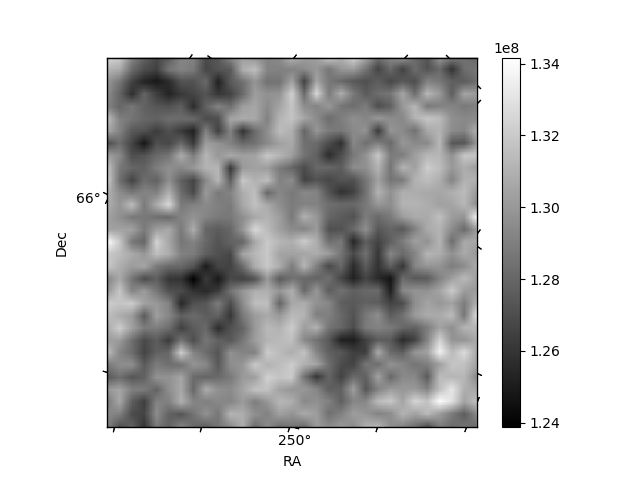
Histogram calculated using DETX and DETY for each event in the final _common_clean file
| Quadrant A | 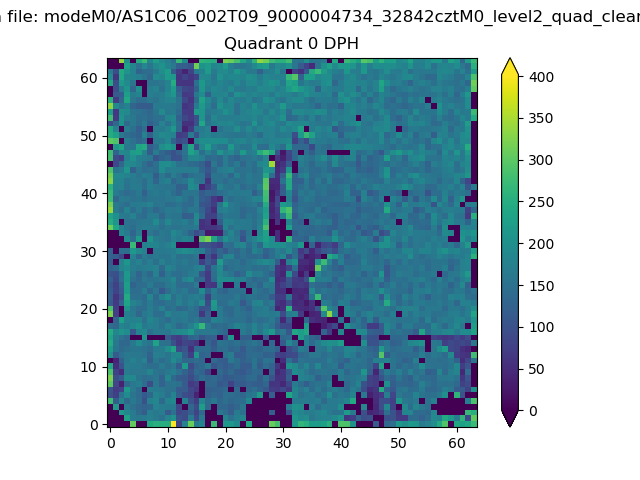 |
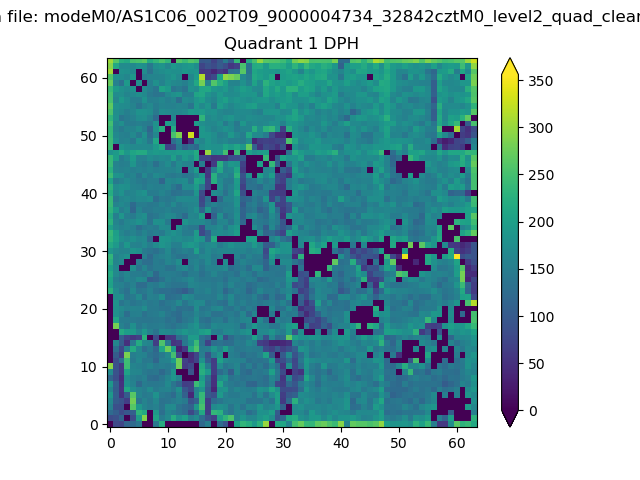 |
Quadrant B |
|---|---|---|---|
| Quadrant D | 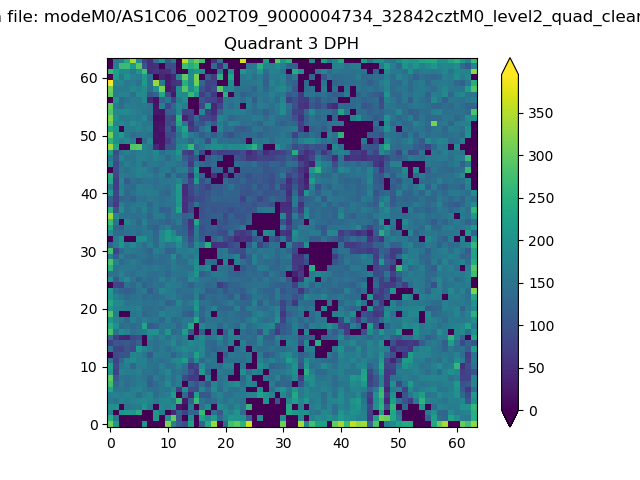 |
 |
Quadrant C |
| Plot type | Count rate plots | Images |
|---|---|---|
| Comparison with Poisson distribution Blue bars denote a histogram of data divided into 1 sec bins. Red curve is a Poisson curve with rate = median count rate of data. |
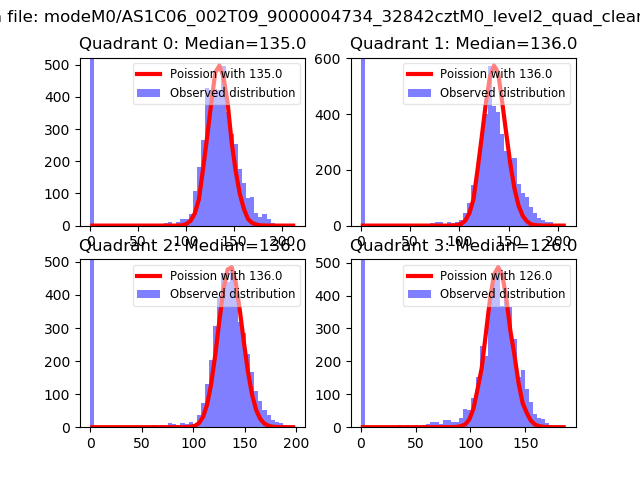 |
 |
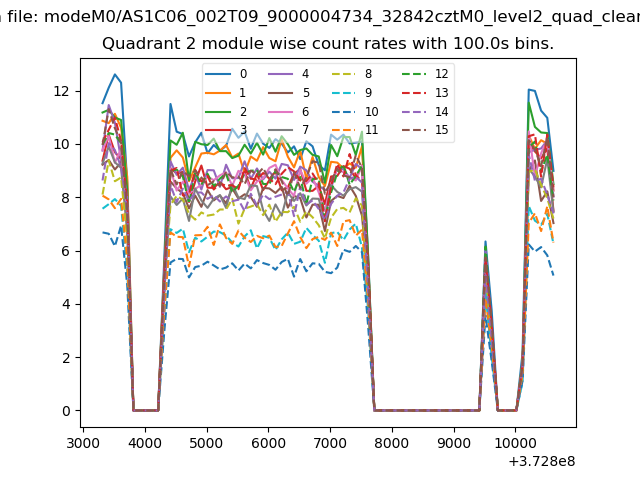
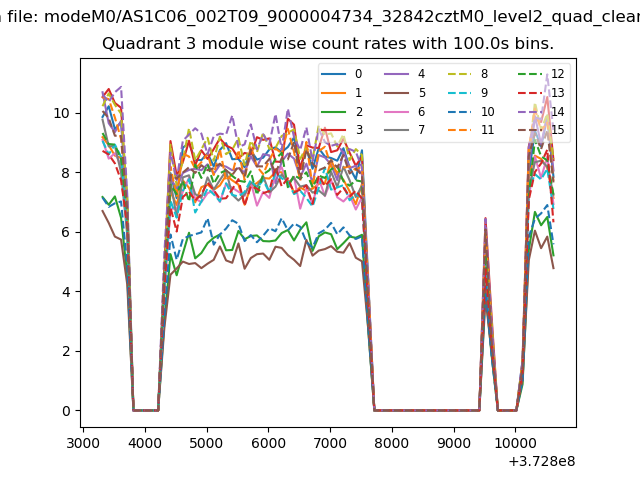
| Quadrant-wise count rates Data is divided into 100 sec bins |
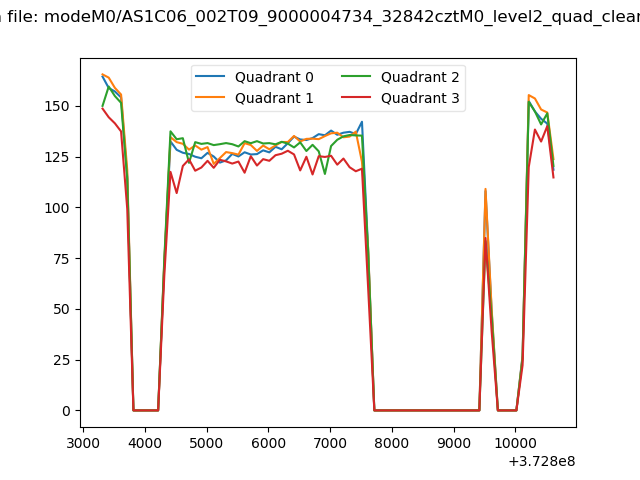 |
|
| Module-wise count rates for Quadrant A Data is divided into 100 sec bins |
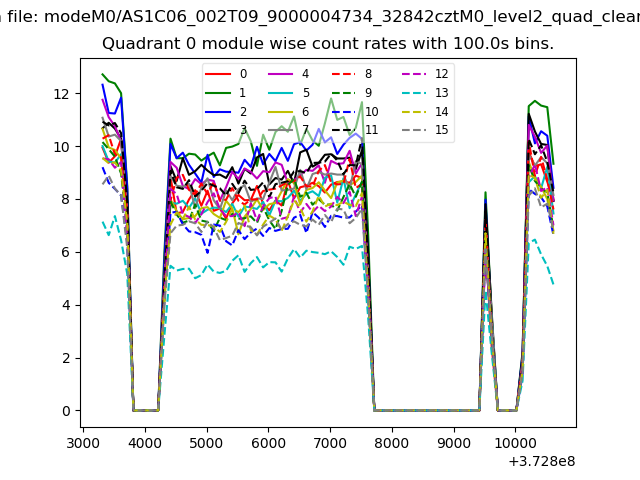 |
 |
| Module-wise count rates for Quadrant B Data is divided into 100 sec bins |
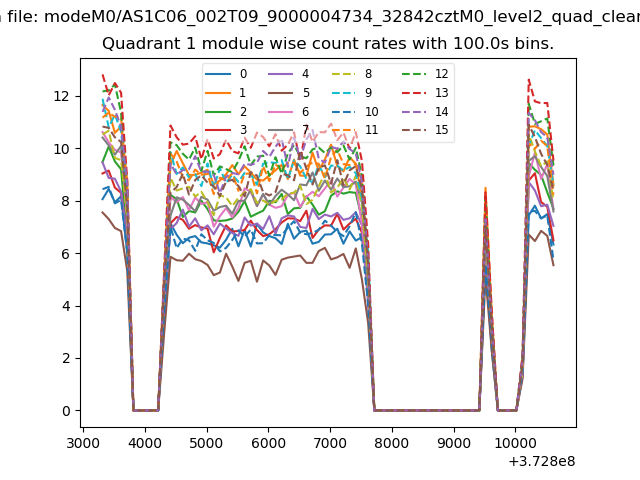 |
 |
| Module-wise count rates for Quadrant C Data is divided into 100 sec bins |
 |
 |
| Module-wise count rates for Quadrant D Data is divided into 100 sec bins |
 |
 |
| Parameter | Plot |
|---|---|
| CZT HV Monitor |  |
| D_VDD | 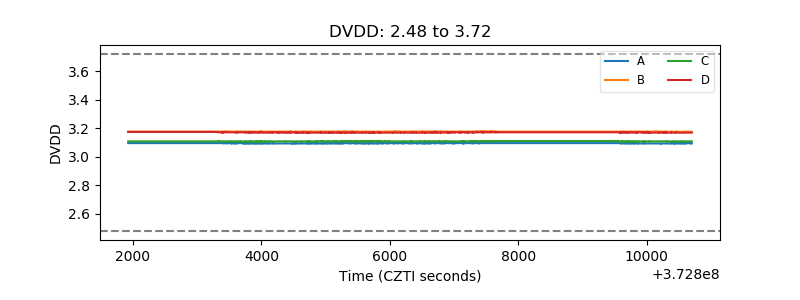 |
| Temperature 1 | 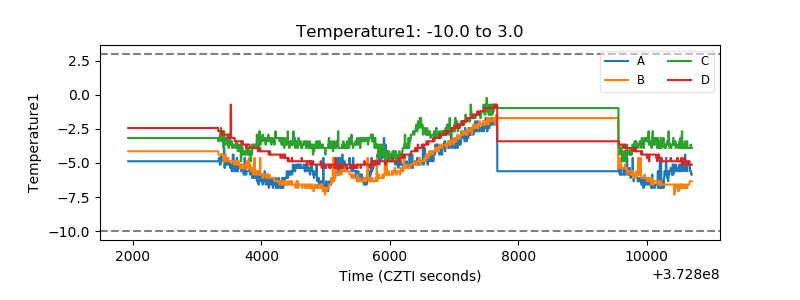 |
| Veto HV Monitor | 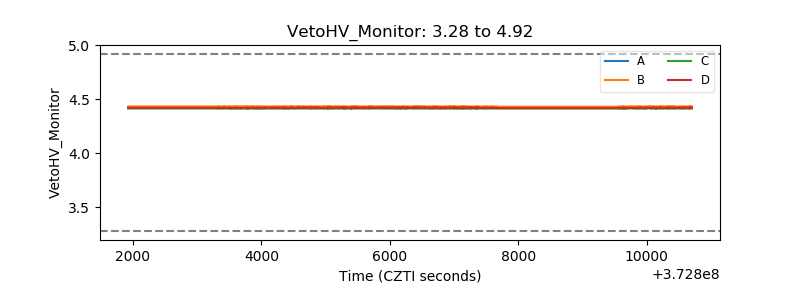 |
| Veto LLD | 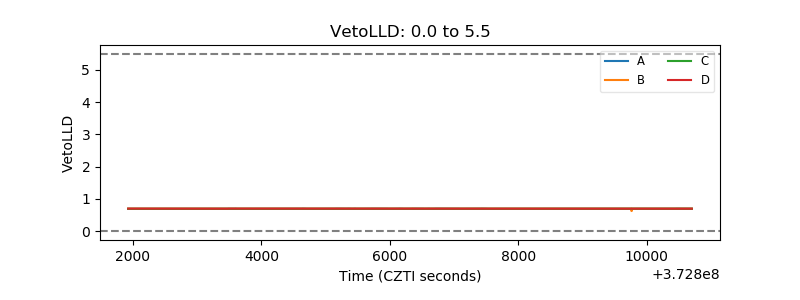 |
| Alpha Counter | 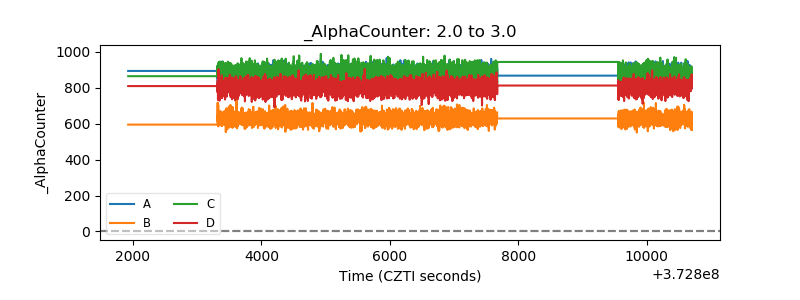 |
| _CPM_Rate | 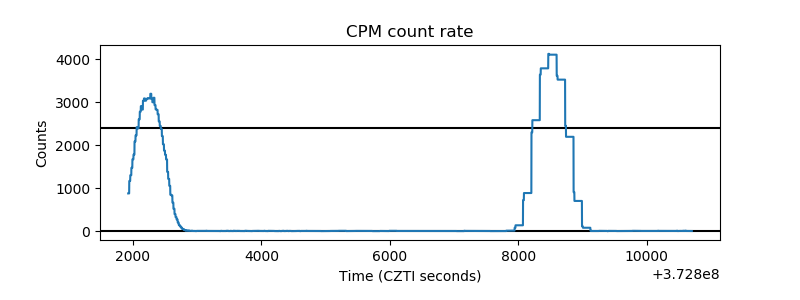 |
| CZT Counter |  |
| +2.5 Volts monitor |  |
| +5 Volts monitor |  |
| _ROLL_ROT | 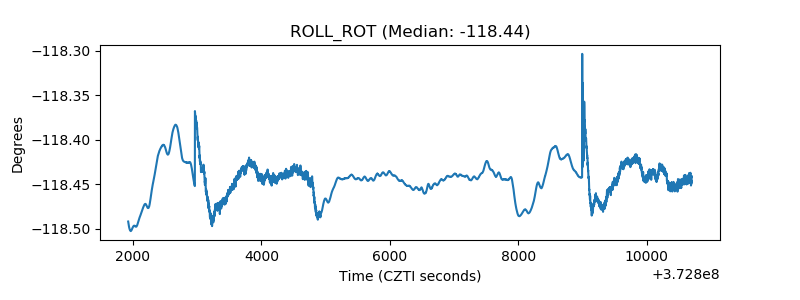 |
| _Roll_DEC | 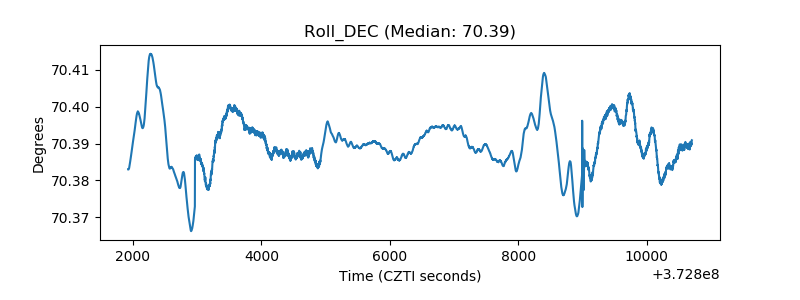 |
| _Roll_RA | 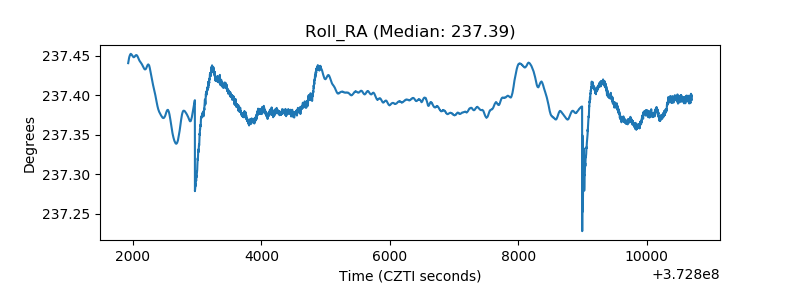 |
| Veto Counter | 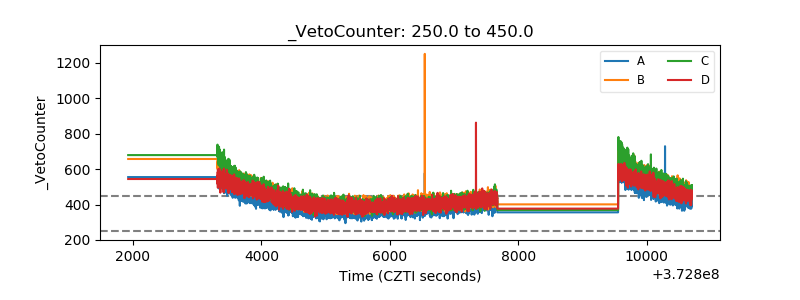 |