| Param | Original file | Final file |
|---|---|---|
| Filename | modeM0/AS1C06_002T09_9000004734_32843cztM0_level2.evt | modeM0/AS1C06_002T09_9000004734_32843cztM0_level2_quad_clean.evt |
| Size (bytes) | 560,220,480 | 95,045,760 |
| Size | 534.3 MB | 90.6 MB |
| Events in quadrant A | 2,549,118 | 643,765 |
| Events in quadrant B | 3,441,409 | 647,005 |
| Events in quadrant C | 4,199,509 | 631,022 |
| Events in quadrant D | 6,415,995 | 583,192 |
| Mode M9 | |||
|---|---|---|---|
| Quadrant | BADHDUFLAG | Total packets | Discarded packets |
| A | 0 | 25 | 0 |
| B | 0 | 25 | 0 |
| C | 0 | 25 | 0 |
| D | 0 | 26 | 0 |
| Mode M0 | |||
|---|---|---|---|
| Quadrant | BADHDUFLAG | Total packets | Discarded packets |
| A | 0 | 10853 | 3 |
| B | 0 | 13634 | 2 |
| C | 0 | 16311 | 2 |
| D | 0 | 22808 | 2 |
| Mode SS | |||
|---|---|---|---|
| Quadrant | BADHDUFLAG | Total packets | Discarded packets |
| A | 0 | 108 | 0 |
| B | 0 | 108 | 0 |
| C | 0 | 108 | 0 |
| D | 0 | 108 | 0 |
| Quadrant | Total seconds | Saturated seconds | Saturation percentage |
|---|---|---|---|
| A | 5332 | 4 | 0.075019% |
| B | 5332 | 217 | 4.069767% |
| C | 5332 | 193 | 3.619655% |
| D | 5332 | 716 | 13.428357% |
Noise dominated data is calculated using 1-second bins in cleaned event files. If a bin has >2000 counts, and if more than 50% of those come from <1% of pixels, then it is considered to be noise-dominated and hence unusable.
| Quadrant | # 1 sec bins | Bins with >0 counts | Bins with >2000 counts | High rate bins dominated by noise | Noise dominated (total time) | Noise dominated (detector-on time) | Marked lightcurve |
|---|---|---|---|---|---|---|---|
| A | 7333 | 5333 | 0 | 0 | 0.00% | 0.00% | 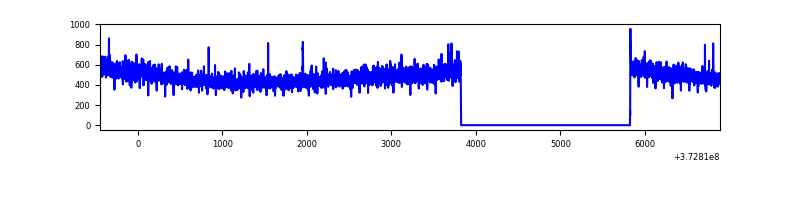 |
| B | 7333 | 5333 | 127 | 127 | 1.73% | 2.38% | 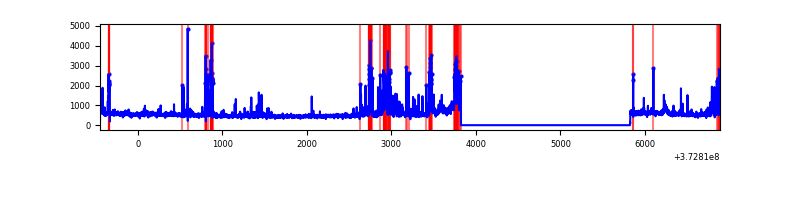 |
| C | 7333 | 5333 | 120 | 120 | 1.64% | 2.25% |  |
| D | 7333 | 5333 | 664 | 664 | 9.05% | 12.45% | 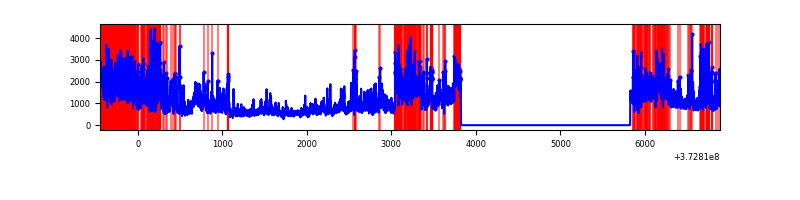 |
Top three noisy pixels from each quadrant. If the there are fewer than three noisy pixels in the level2.evt file, extra rows are filled as -1
| Pixel properties | Quadrant properties | ||||||
|---|---|---|---|---|---|---|---|
| Quadrant | DetID | PixID | Counts | Sigma | Mean | Median | Sigma |
| A | 13 | 254 | 10637 | 77.85 | 654 | 644 | 128.4 |
| A | 0 | 226 | 5546 | 38.19 | 654 | 644 | 128.4 |
| A | 3 | 137 | 5439 | 37.36 | 654 | 644 | 128.4 |
| B | 5 | 172 | 526346 | 4314.84 | 650 | 634 | 121.8 |
| B | 0 | 219 | 153134 | 1251.66 | 650 | 634 | 121.8 |
| B | 0 | 197 | 52432 | 425.13 | 650 | 634 | 121.8 |
| C | 3 | 233 | 1189879 | 8255.66 | 631 | 637 | 144.1 |
| C | 9 | 160 | 412293 | 2857.7 | 631 | 637 | 144.1 |
| C | 0 | 10 | 51999 | 356.55 | 631 | 637 | 144.1 |
| D | 12 | 227 | 1638552 | 10976.22 | 604 | 592 | 149.2 |
| D | 8 | 195 | 1281151 | 8581.22 | 604 | 592 | 149.2 |
| D | 7 | 80 | 259966 | 1738.1 | 604 | 592 | 149.2 |
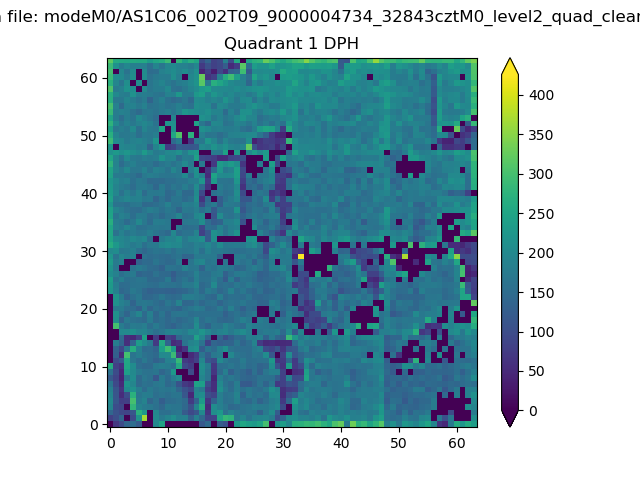
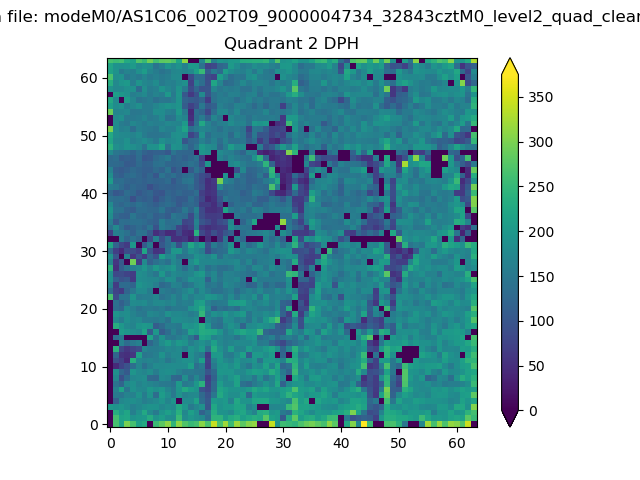
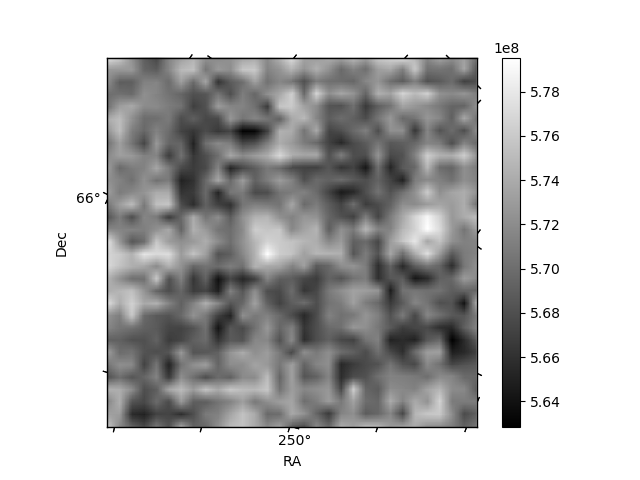
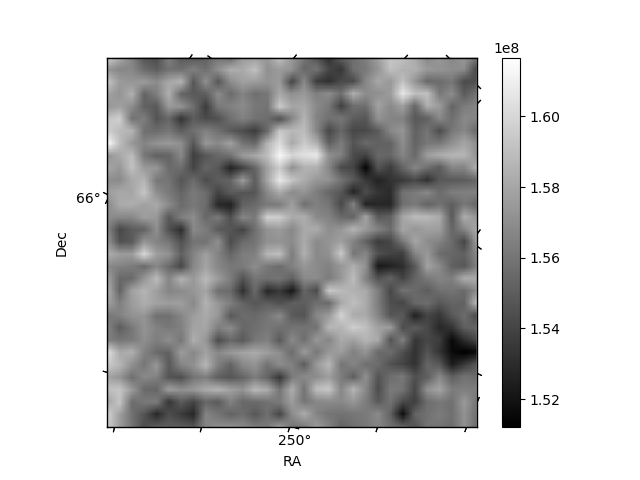
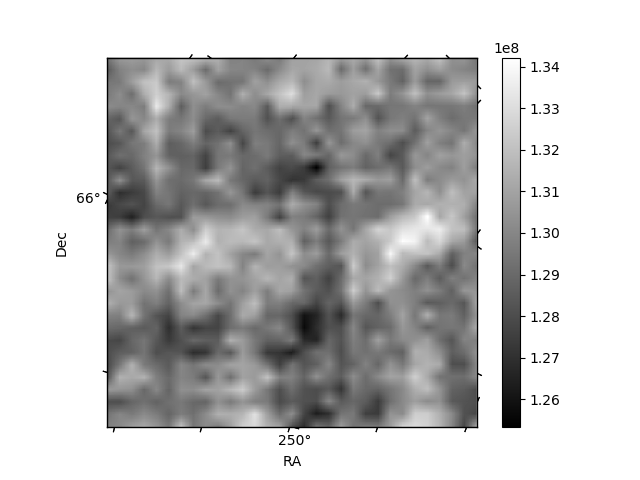
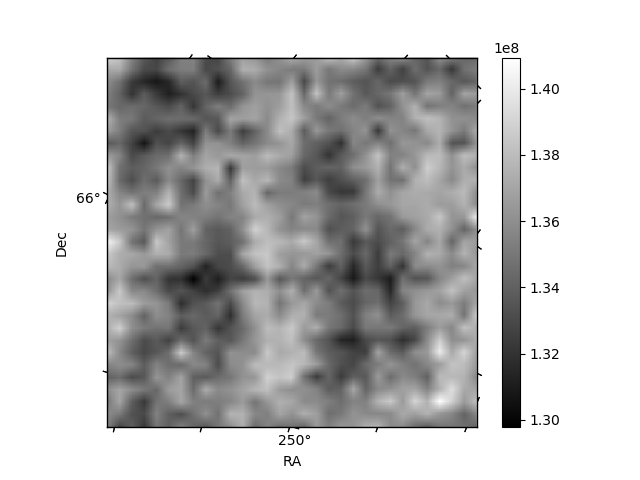
Histogram calculated using DETX and DETY for each event in the final _common_clean file
| Quadrant A | 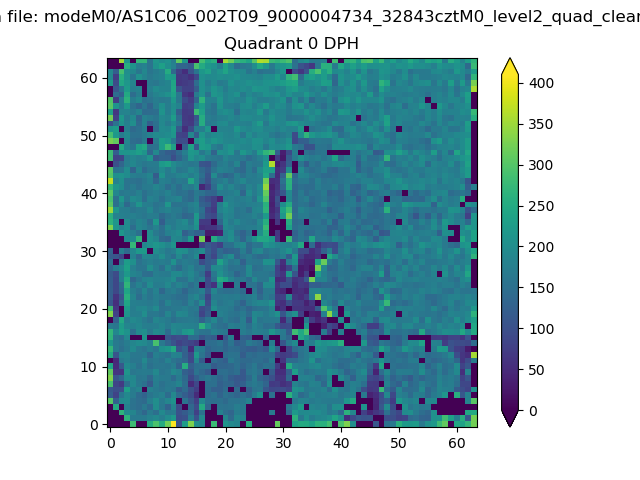 |
 |
Quadrant B |
|---|---|---|---|
| Quadrant D | 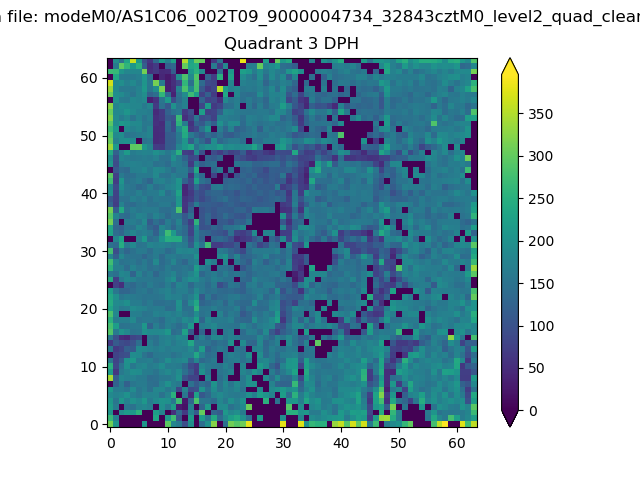 |
 |
Quadrant C |
| Plot type | Count rate plots | Images |
|---|---|---|
| Comparison with Poisson distribution Blue bars denote a histogram of data divided into 1 sec bins. Red curve is a Poisson curve with rate = median count rate of data. |
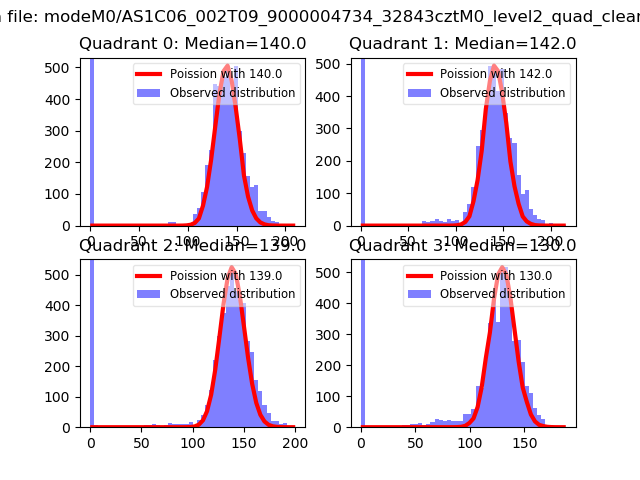 |
 |
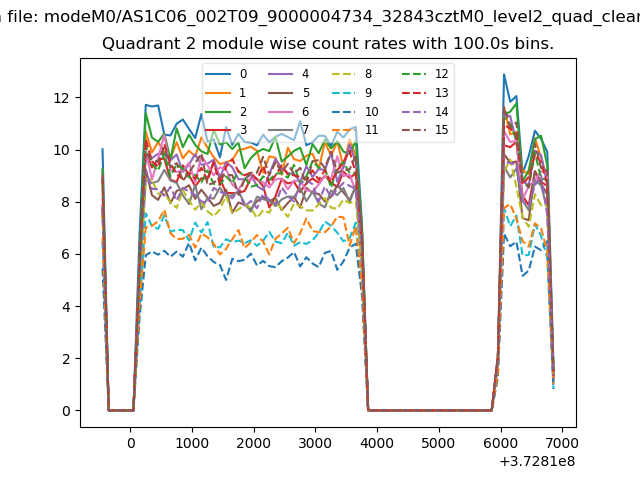
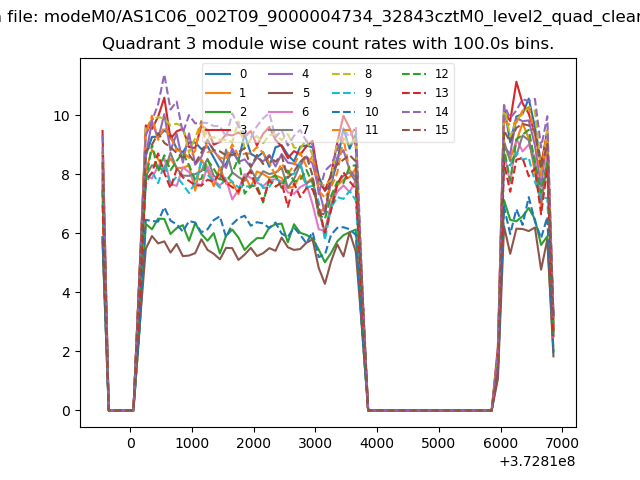
| Quadrant-wise count rates Data is divided into 100 sec bins |
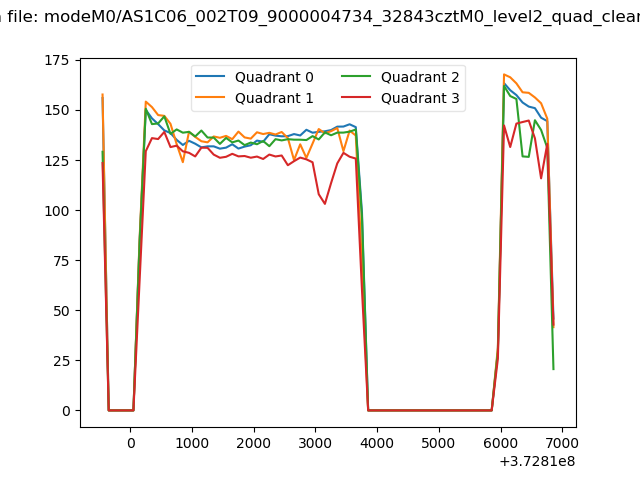 |
|
| Module-wise count rates for Quadrant A Data is divided into 100 sec bins |
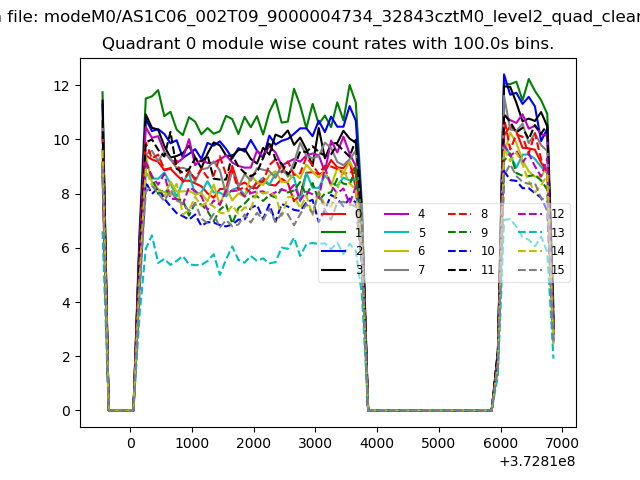 |
 |
| Module-wise count rates for Quadrant B Data is divided into 100 sec bins |
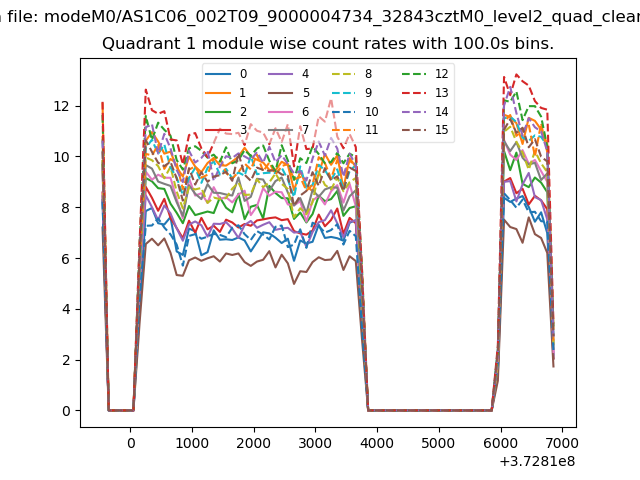 |
 |
| Module-wise count rates for Quadrant C Data is divided into 100 sec bins |
 |
 |
| Module-wise count rates for Quadrant D Data is divided into 100 sec bins |
 |
 |
| Parameter | Plot |
|---|---|
| CZT HV Monitor | 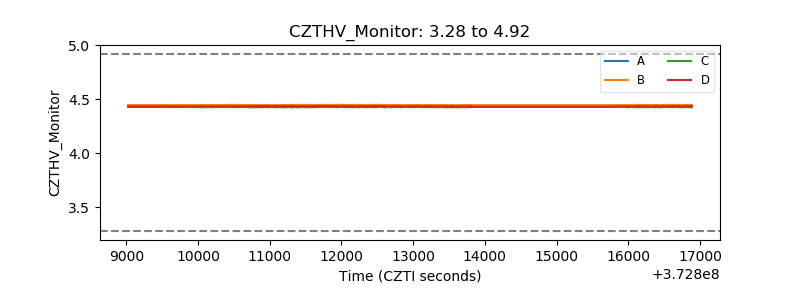 |
| D_VDD | 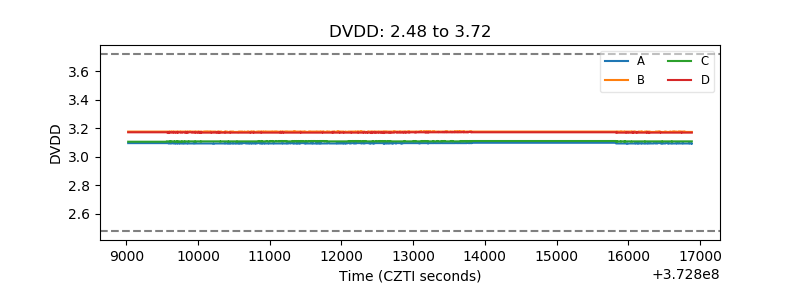 |
| Temperature 1 | 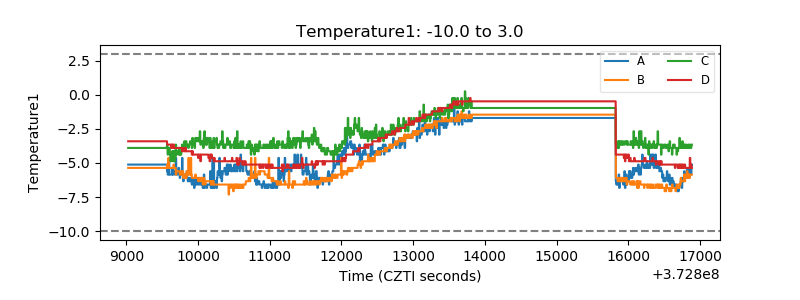 |
| Veto HV Monitor | 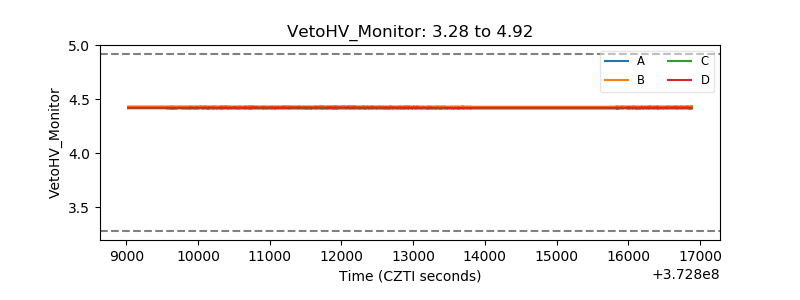 |
| Veto LLD | 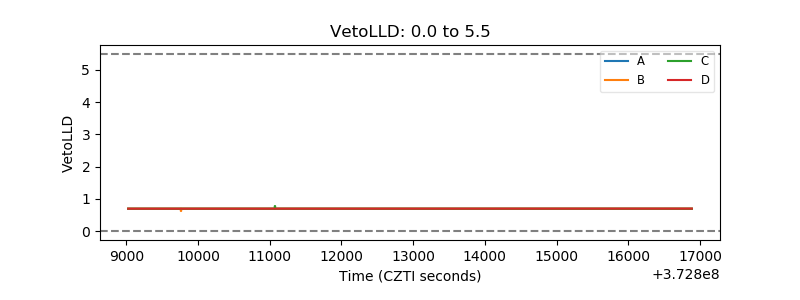 |
| Alpha Counter | 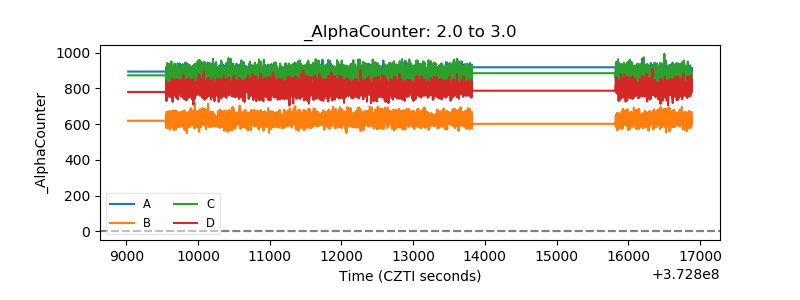 |
| _CPM_Rate | 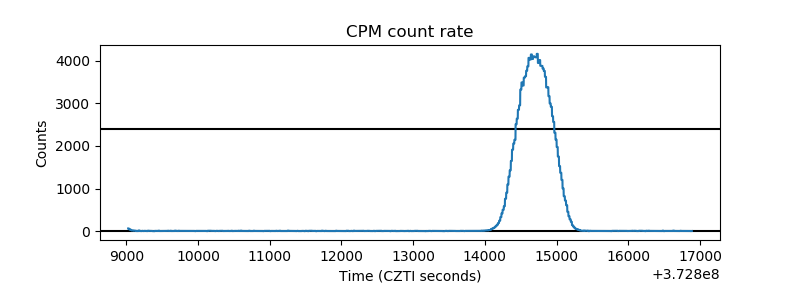 |
| CZT Counter | 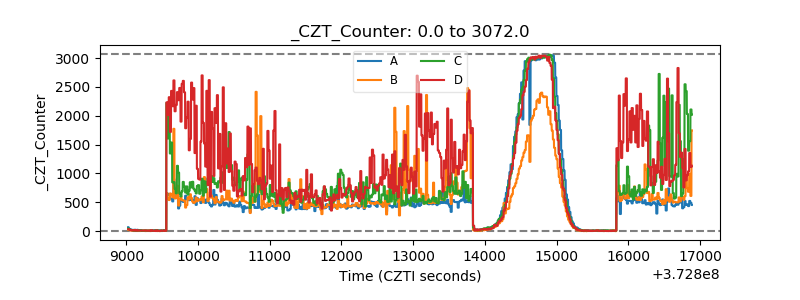 |
| +2.5 Volts monitor | 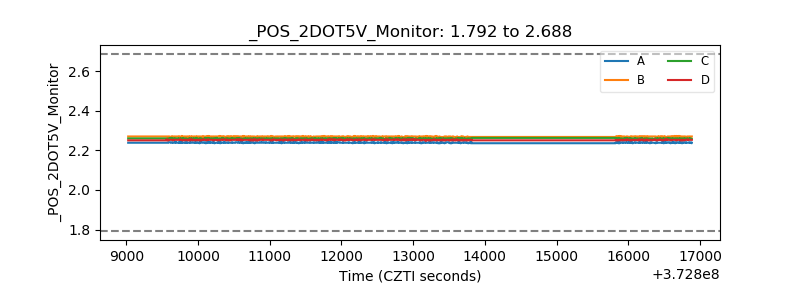 |
| +5 Volts monitor |  |
| _ROLL_ROT | 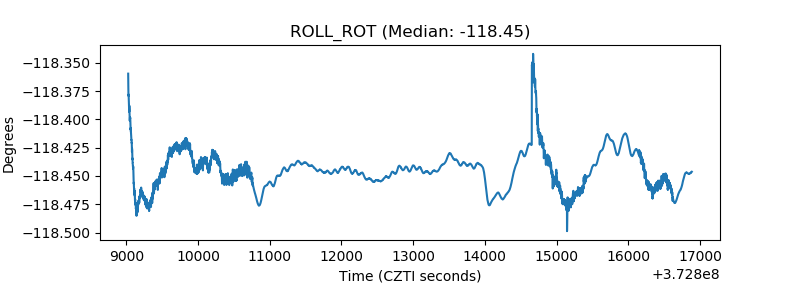 |
| _Roll_DEC | 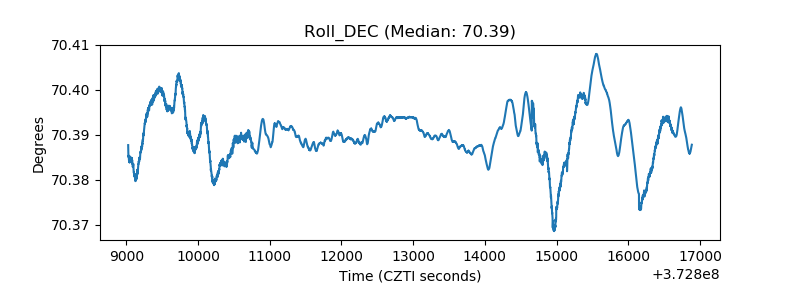 |
| _Roll_RA |  |
| Veto Counter | 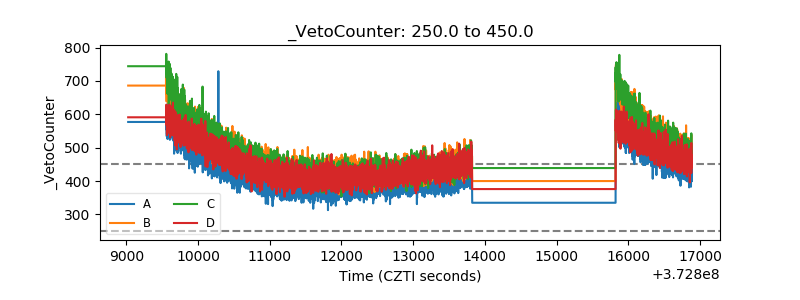 |