| Param | Original file | Final file |
|---|---|---|
| Filename | modeM0/AS1C06_002T09_9000004734_32844cztM0_level2.evt | modeM0/AS1C06_002T09_9000004734_32844cztM0_level2_quad_clean.evt |
| Size (bytes) | 559,529,280 | 96,736,320 |
| Size | 533.6 MB | 92.3 MB |
| Events in quadrant A | 2,373,970 | 683,059 |
| Events in quadrant B | 3,828,884 | 658,957 |
| Events in quadrant C | 4,867,171 | 630,268 |
| Events in quadrant D | 5,542,825 | 611,739 |
| Mode M9 | |||
|---|---|---|---|
| Quadrant | BADHDUFLAG | Total packets | Discarded packets |
| A | 0 | 32 | 0 |
| B | 0 | 32 | 0 |
| C | 0 | 32 | 0 |
| D | 0 | 33 | 0 |
| Mode M0 | |||
|---|---|---|---|
| Quadrant | BADHDUFLAG | Total packets | Discarded packets |
| A | 0 | 10035 | 3 |
| B | 0 | 14551 | 2 |
| C | 0 | 17941 | 2 |
| D | 0 | 20055 | 2 |
| Mode SS | |||
|---|---|---|---|
| Quadrant | BADHDUFLAG | Total packets | Discarded packets |
| A | 0 | 102 | 0 |
| B | 0 | 102 | 0 |
| C | 0 | 102 | 0 |
| D | 0 | 102 | 0 |
| Quadrant | Total seconds | Saturated seconds | Saturation percentage |
|---|---|---|---|
| A | 4916 | 4 | 0.081367% |
| B | 4916 | 463 | 9.418226% |
| C | 4916 | 534 | 10.862490% |
| D | 4916 | 455 | 9.255492% |
Noise dominated data is calculated using 1-second bins in cleaned event files. If a bin has >2000 counts, and if more than 50% of those come from <1% of pixels, then it is considered to be noise-dominated and hence unusable.
| Quadrant | # 1 sec bins | Bins with >0 counts | Bins with >2000 counts | High rate bins dominated by noise | Noise dominated (total time) | Noise dominated (detector-on time) | Marked lightcurve |
|---|---|---|---|---|---|---|---|
| A | 7038 | 4917 | 0 | 0 | 0.00% | 0.00% | 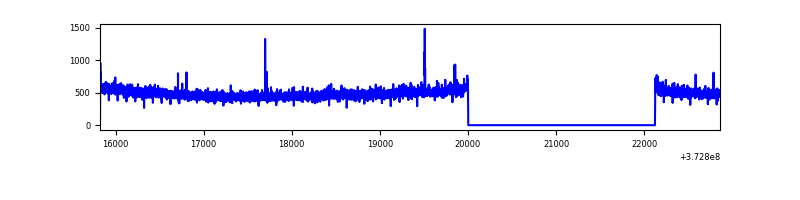 |
| B | 7038 | 4917 | 317 | 317 | 4.50% | 6.45% | 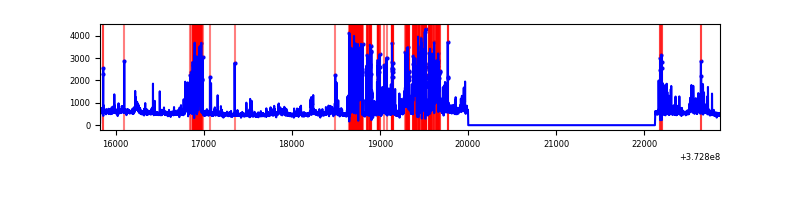 |
| C | 7038 | 4917 | 383 | 383 | 5.44% | 7.79% |  |
| D | 7038 | 4917 | 412 | 412 | 5.85% | 8.38% | 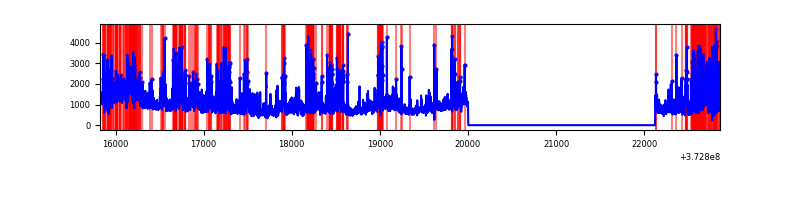 |
Top three noisy pixels from each quadrant. If the there are fewer than three noisy pixels in the level2.evt file, extra rows are filled as -1
| Pixel properties | Quadrant properties | ||||||
|---|---|---|---|---|---|---|---|
| Quadrant | DetID | PixID | Counts | Sigma | Mean | Median | Sigma |
| A | 13 | 254 | 10759 | 85.37 | 606 | 595 | 119.1 |
| A | 9 | 143 | 7272 | 56.08 | 606 | 595 | 119.1 |
| A | 14 | 238 | 5436 | 40.66 | 606 | 595 | 119.1 |
| B | 5 | 172 | 1169187 | 10830.27 | 583 | 569 | 107.9 |
| B | 0 | 219 | 109157 | 1006.35 | 583 | 569 | 107.9 |
| B | 12 | 1 | 106752 | 984.06 | 583 | 569 | 107.9 |
| C | 9 | 160 | 1842560 | 14428.45 | 556 | 561 | 127.7 |
| C | 3 | 233 | 670007 | 5243.8 | 556 | 561 | 127.7 |
| C | 0 | 10 | 107553 | 838.07 | 556 | 561 | 127.7 |
| D | 8 | 195 | 1294179 | 9348.0 | 562 | 549 | 138.4 |
| D | 2 | 250 | 786604 | 5680.17 | 562 | 549 | 138.4 |
| D | 7 | 80 | 468465 | 3381.25 | 562 | 549 | 138.4 |
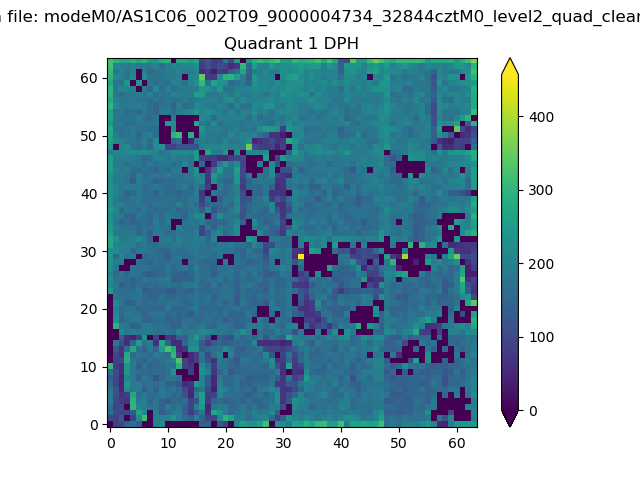
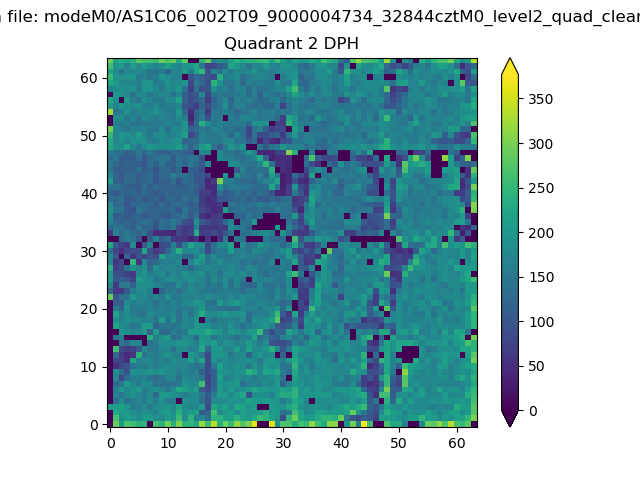
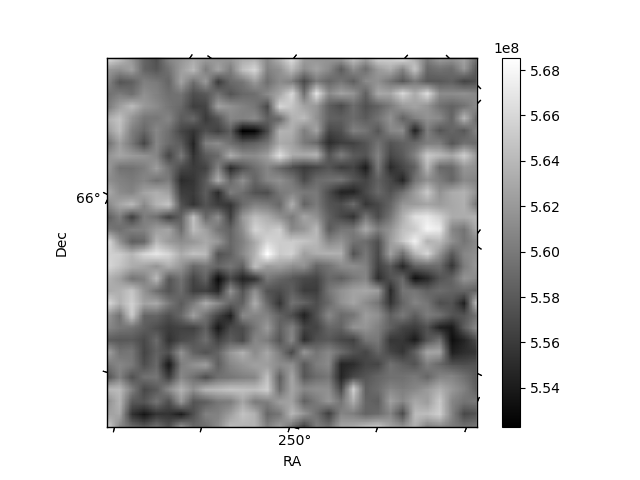
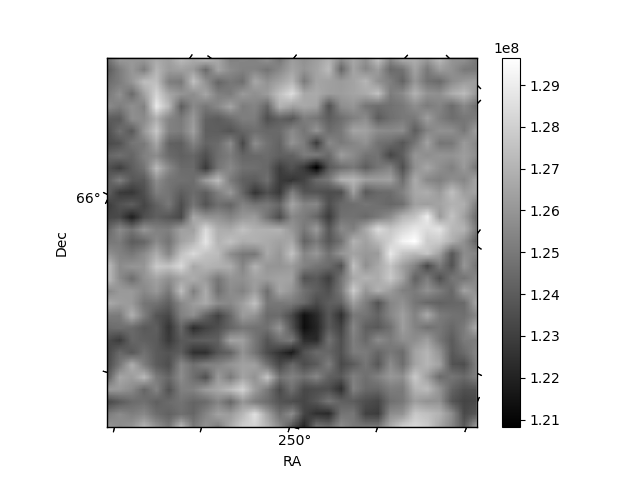
Histogram calculated using DETX and DETY for each event in the final _common_clean file
| Quadrant A | 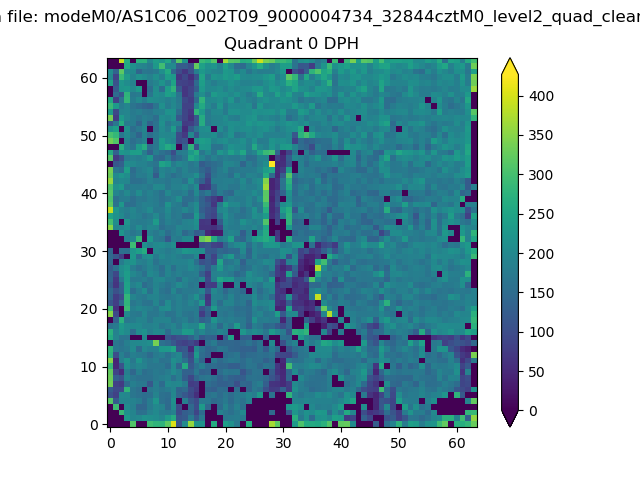 |
 |
Quadrant B |
|---|---|---|---|
| Quadrant D | 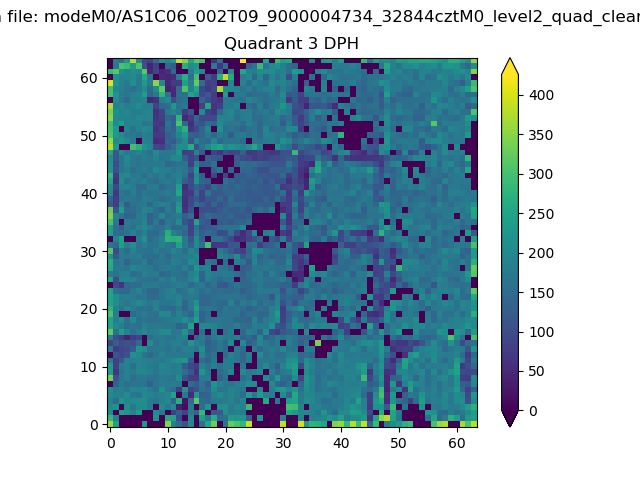 |
 |
Quadrant C |
| Plot type | Count rate plots | Images |
|---|---|---|
| Comparison with Poisson distribution Blue bars denote a histogram of data divided into 1 sec bins. Red curve is a Poisson curve with rate = median count rate of data. |
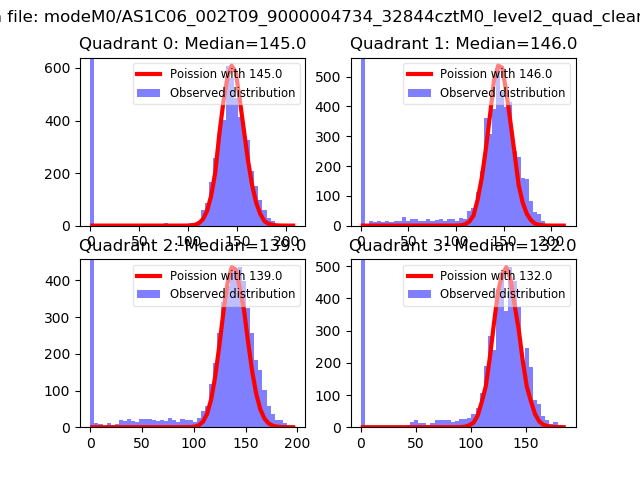 |
 |
| Quadrant-wise count rates Data is divided into 100 sec bins |
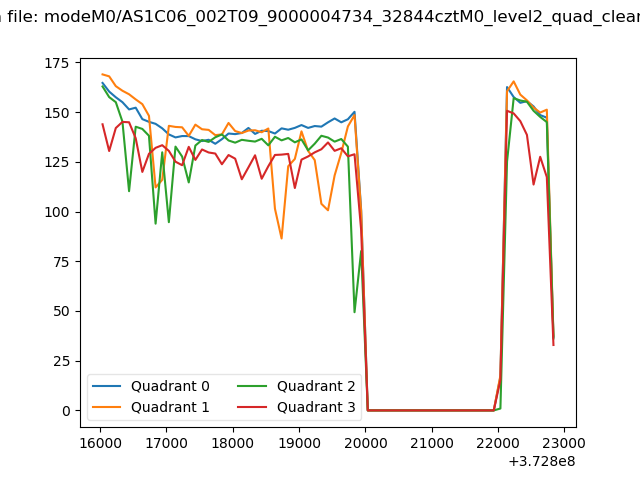 |
|
| Module-wise count rates for Quadrant A Data is divided into 100 sec bins |
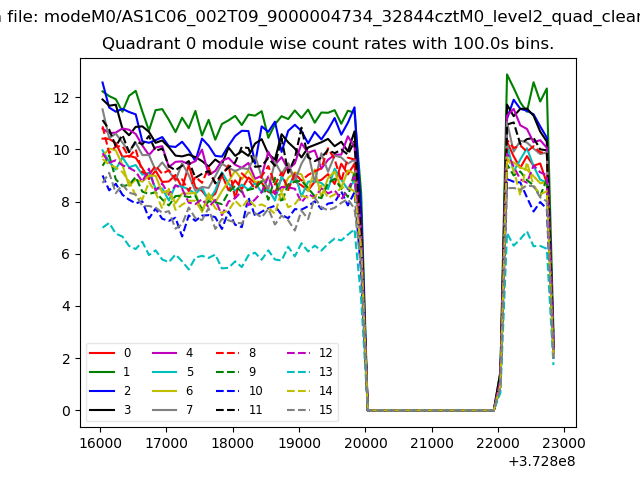 |
 |
| Module-wise count rates for Quadrant B Data is divided into 100 sec bins |
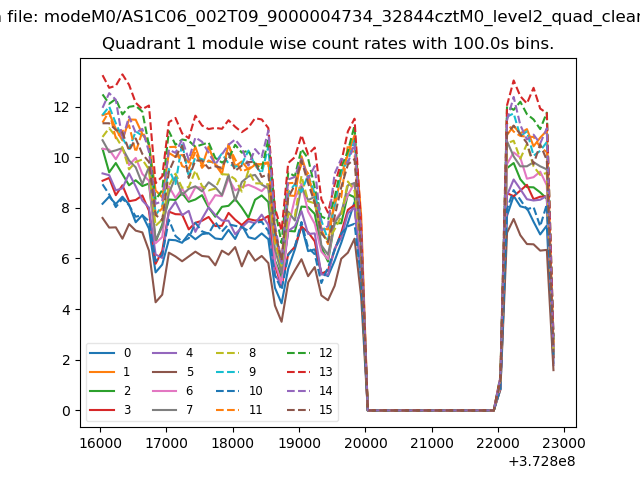 |
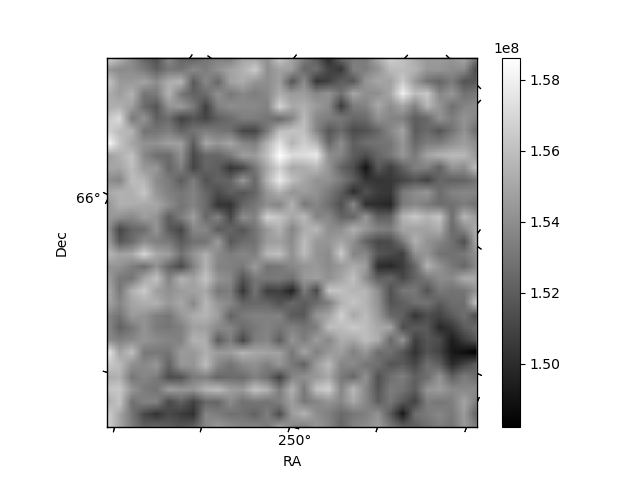 |
| Module-wise count rates for Quadrant C Data is divided into 100 sec bins |
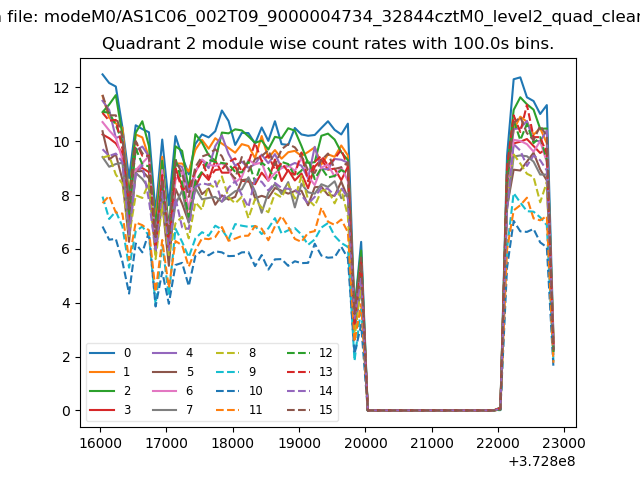 |
 |
| Module-wise count rates for Quadrant D Data is divided into 100 sec bins |
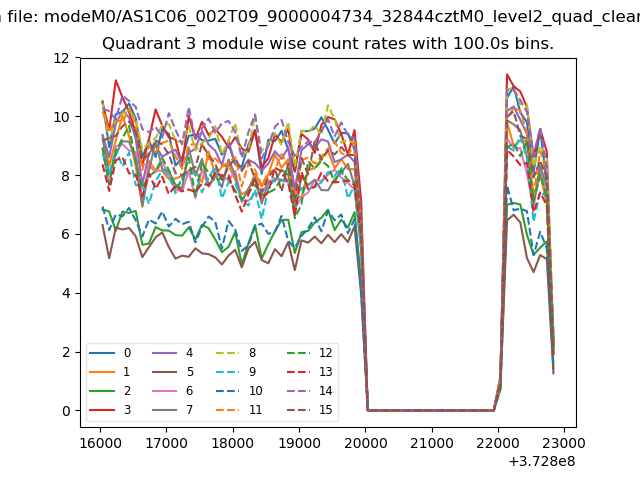 |
 |
| Parameter | Plot |
|---|---|
| CZT HV Monitor | 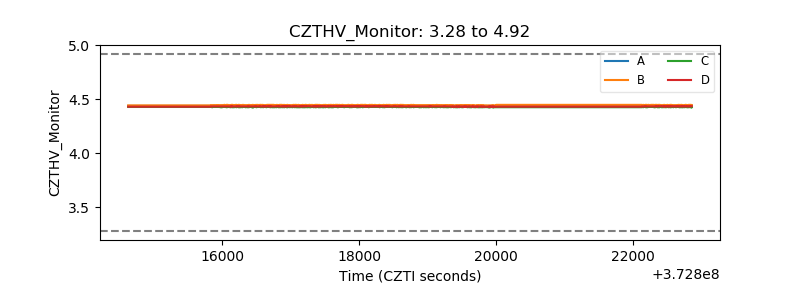 |
| D_VDD | 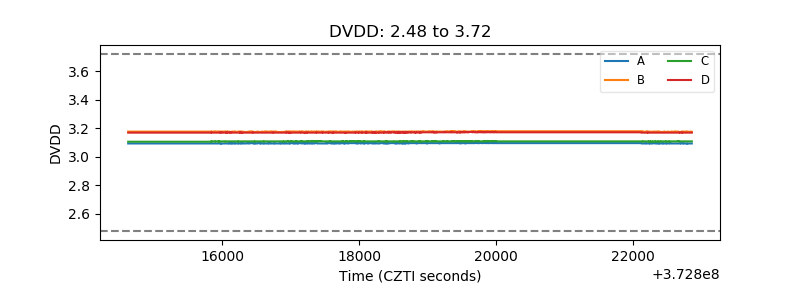 |
| Temperature 1 | 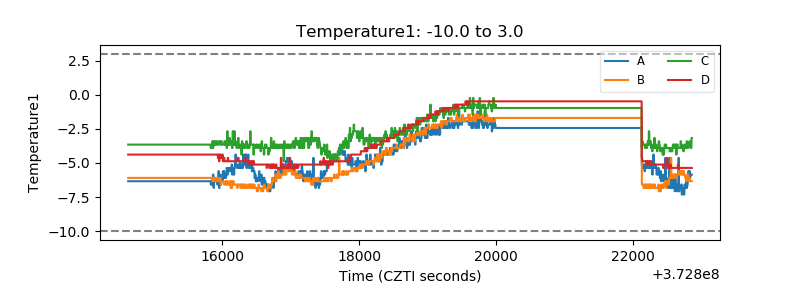 |
| Veto HV Monitor | 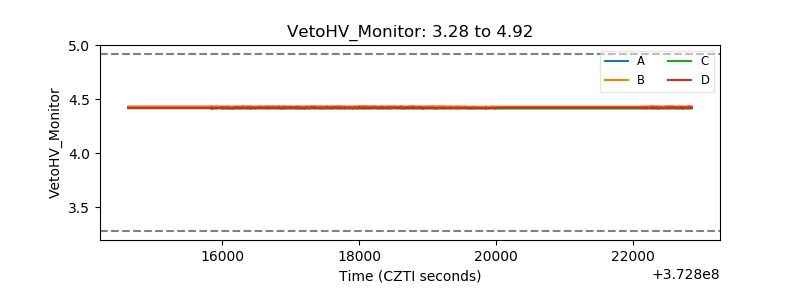 |
| Veto LLD | 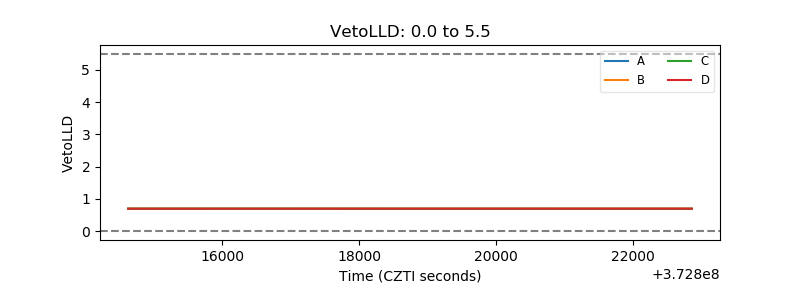 |
| Alpha Counter | 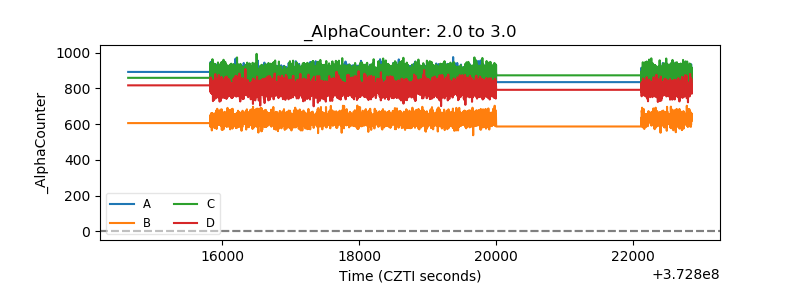 |
| _CPM_Rate | 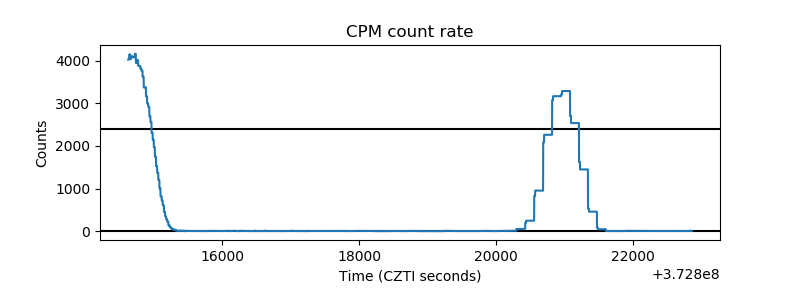 |
| CZT Counter | 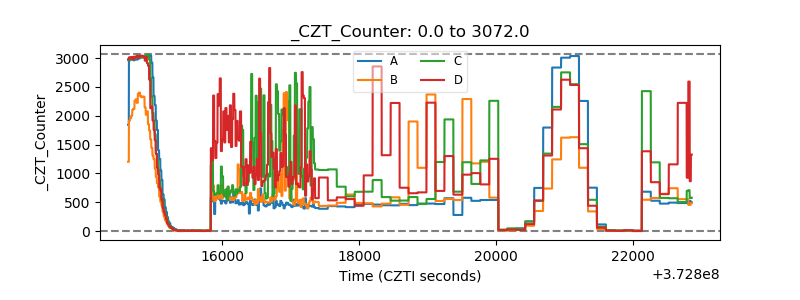 |
| +2.5 Volts monitor | 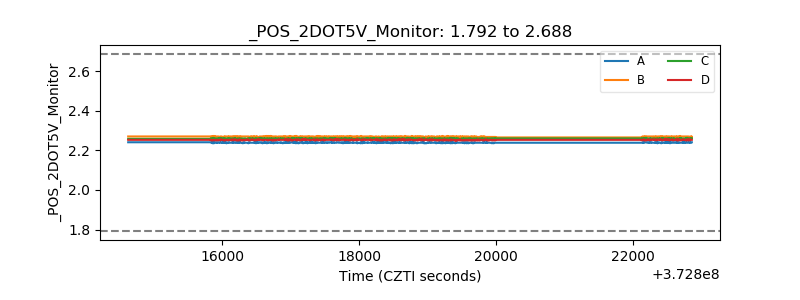 |
| +5 Volts monitor |  |
| _ROLL_ROT | 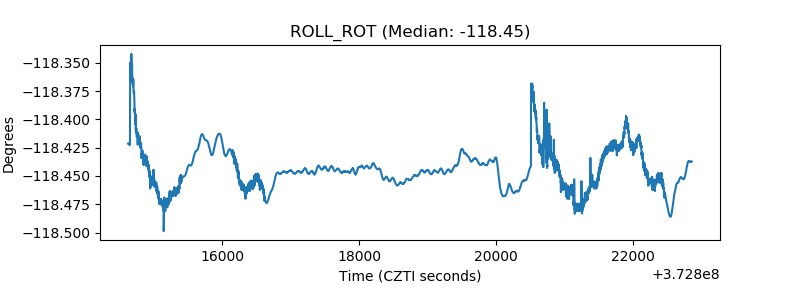 |
| _Roll_DEC | 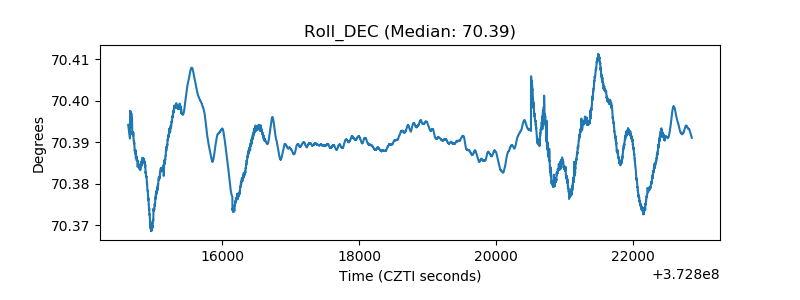 |
| _Roll_RA |  |
| Veto Counter | 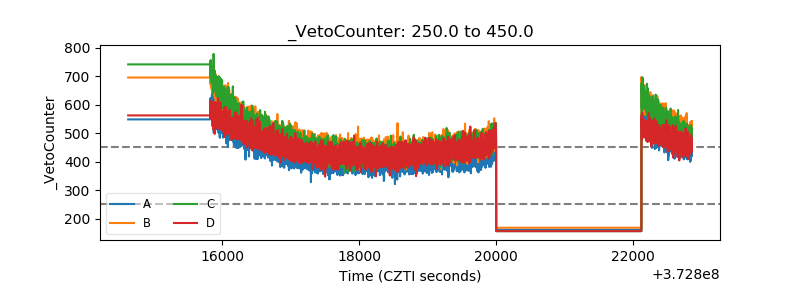 |