| Param | Original file | Final file |
|---|---|---|
| Filename | modeM0/AS1A11_005T04_9000004742cztM0_level2.fits | modeM0/AS1A11_005T04_9000004742cztM0_level2_quad_clean.evt |
| Size (bytes) | 977,690,880 | 775,252,800 |
| Size | 932.4 MB | 739.3 MB |
| Events in quadrant A | 6,107,256 | 4,451,793 |
| Events in quadrant B | 5,734,284 | 4,179,495 |
| Events in quadrant C | 5,994,893 | 4,320,489 |
| Events in quadrant D | 4,799,318 | 3,556,305 |
| Mode M9 | |||
|---|---|---|---|
| Quadrant | BADHDUFLAG | Total packets | Discarded packets |
| A | 0 | 409 | 0 |
| B | 0 | 409 | 0 |
| C | 0 | 409 | 0 |
| D | 0 | 409 | 0 |
| Mode M0 | |||
|---|---|---|---|
| Quadrant | BADHDUFLAG | Total packets | Discarded packets |
| A | 0 | 216561 | 0 |
| B | 0 | 262545 | 0 |
| C | 0 | 218540 | 0 |
| D | 0 | 368947 | 0 |
| Mode SS | |||
|---|---|---|---|
| Quadrant | BADHDUFLAG | Total packets | Discarded packets |
| A | 0 | 2078 | 0 |
| B | 0 | 2078 | 0 |
| C | 0 | 2078 | 0 |
| D | 0 | 2078 | 0 |
| Quadrant | Total seconds | Saturated seconds | Saturation percentage |
|---|---|---|---|
| A | 101834 | 419 | 0.411454% |
| B | 101712 | 6226 | 6.121205% |
| C | 101830 | 719 | 0.706079% |
| D | 101244 | 9586 | 9.468215% |
Noise dominated data is calculated using 1-second bins in cleaned event files. If a bin has >2000 counts, and if more than 50% of those come from <1% of pixels, then it is considered to be noise-dominated and hence unusable.
| Quadrant | # 1 sec bins | Bins with >0 counts | Bins with >2000 counts | High rate bins dominated by noise | Noise dominated (total time) | Noise dominated (detector-on time) | Marked lightcurve |
|---|---|---|---|---|---|---|---|
| A | 144877 | 102448 | 0 | 0 | 0.00% | 0.00% | 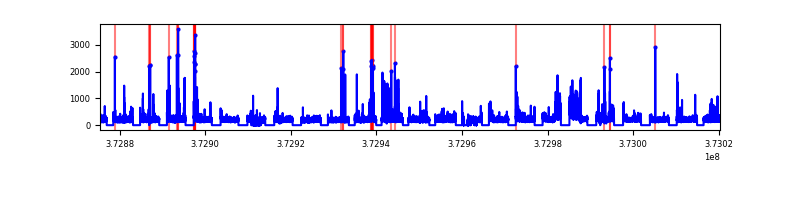 |
| B | 144877 | 102246 | 0 | 0 | 0.00% | 0.00% |  |
| C | 144877 | 102432 | 0 | 0 | 0.00% | 0.00% | 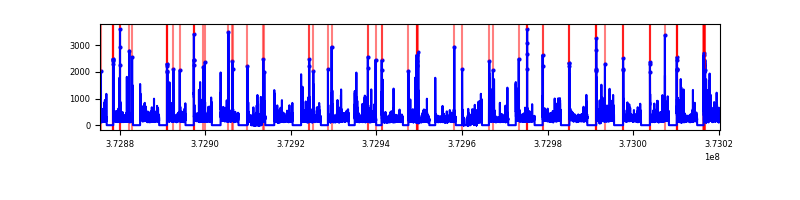 |
| D | 144877 | 101791 | 0 | 0 | 0.00% | 0.00% |  |
Top three noisy pixels from each quadrant. If the there are fewer than three noisy pixels in the level2.evt file, extra rows are filled as -1
| Pixel properties | Quadrant properties | ||||||
|---|---|---|---|---|---|---|---|
| Quadrant | DetID | PixID | Counts | Sigma | Mean | Median | Sigma |
| A | 9 | 19 | 4888 | 8.74 | 1594 | 1503 | 387.4 |
| A | 0 | 29 | 4791 | 8.49 | 1594 | 1503 | 387.4 |
| A | 7 | 110 | 4752 | 8.39 | 1594 | 1503 | 387.4 |
| B | 2 | 9 | 4760 | 11.15 | 1521 | 1456 | 296.4 |
| B | 3 | 80 | 4420 | 10.0 | 1521 | 1456 | 296.4 |
| B | 5 | 128 | 4005 | 8.6 | 1521 | 1456 | 296.4 |
| C | 1 | 81 | 5012 | 8.79 | 1586 | 1499 | 399.5 |
| C | 1 | 80 | 4793 | 8.25 | 1586 | 1499 | 399.5 |
| C | 3 | 203 | 4770 | 8.19 | 1586 | 1499 | 399.5 |
| D | 10 | 113 | 3590 | 6.38 | 1377 | 1260 | 365.2 |
| D | 7 | 3 | 3541 | 6.25 | 1377 | 1260 | 365.2 |
| D | 10 | 189 | 3468 | 6.05 | 1377 | 1260 | 365.2 |
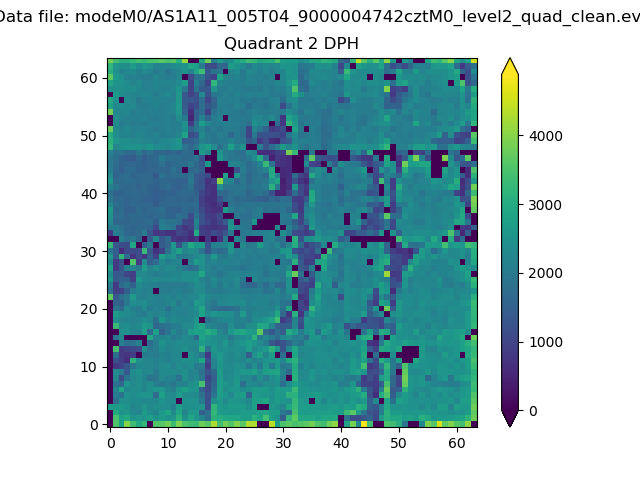
Histogram calculated using DETX and DETY for each event in the final _common_clean file
| Quadrant A | 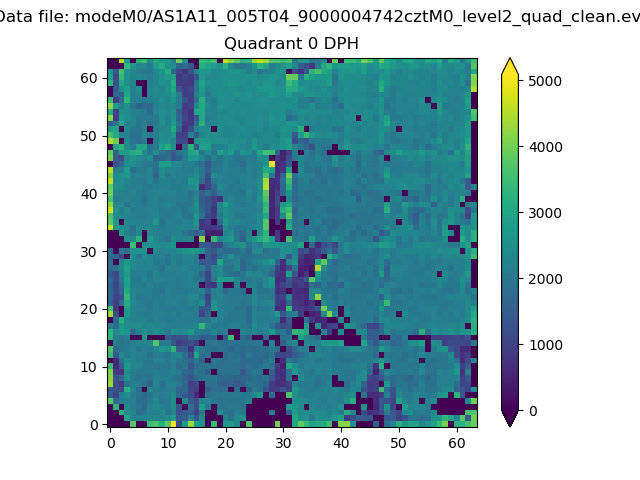 |
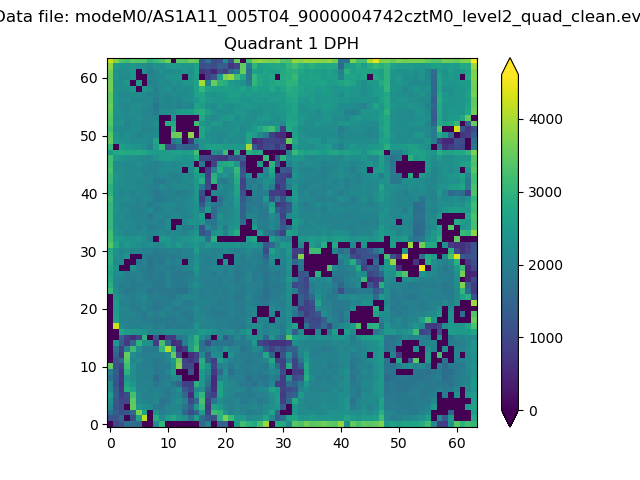 |
Quadrant B |
|---|---|---|---|
| Quadrant D |  |
 |
Quadrant C |
| Plot type | Count rate plots | Images |
|---|---|---|
| Comparison with Poisson distribution Blue bars denote a histogram of data divided into 1 sec bins. Red curve is a Poisson curve with rate = median count rate of data. |
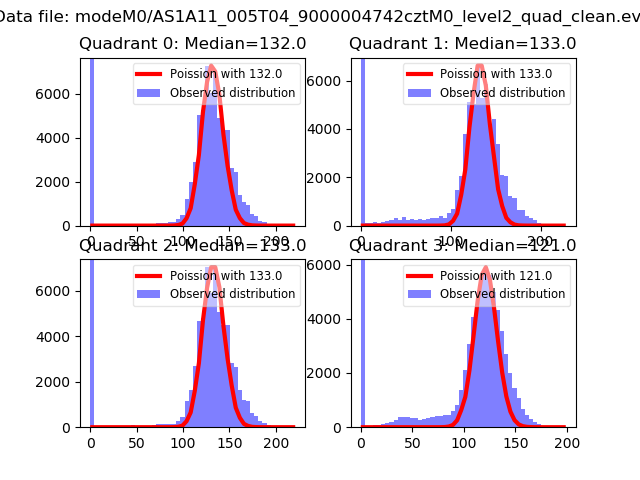 |
 |
| Quadrant-wise count rates Data is divided into 100 sec bins |
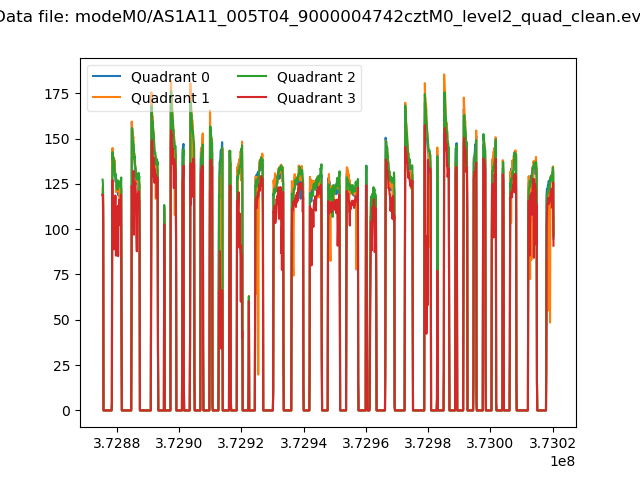 |
|
| Module-wise count rates for Quadrant A Data is divided into 100 sec bins |
 |
 |
| Module-wise count rates for Quadrant B Data is divided into 100 sec bins |
 |
 |
| Module-wise count rates for Quadrant C Data is divided into 100 sec bins |
 |
 |
| Module-wise count rates for Quadrant D Data is divided into 100 sec bins |
 |
 |
| Parameter | Plot |
|---|---|
| CZT HV Monitor | 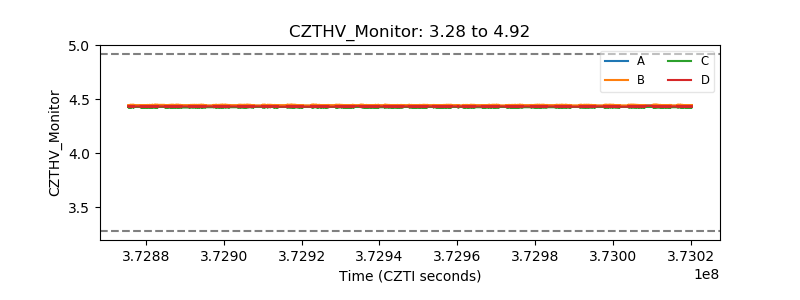 |
| D_VDD | 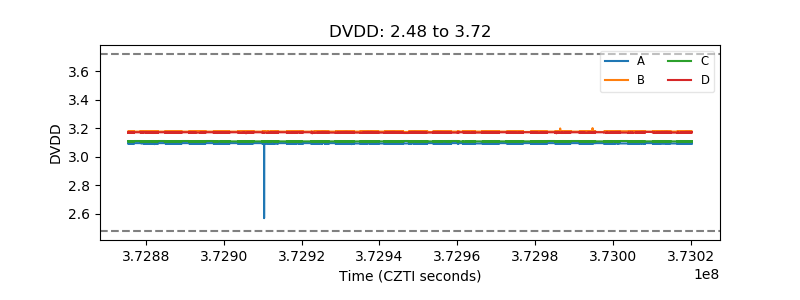 |
| Temperature 1 |  |
| Veto HV Monitor |  |
| Veto LLD |  |
| Alpha Counter |  |
| _CPM_Rate |  |
| CZT Counter |  |
| +2.5 Volts monitor |  |
| +5 Volts monitor |  |
| _ROLL_ROT | 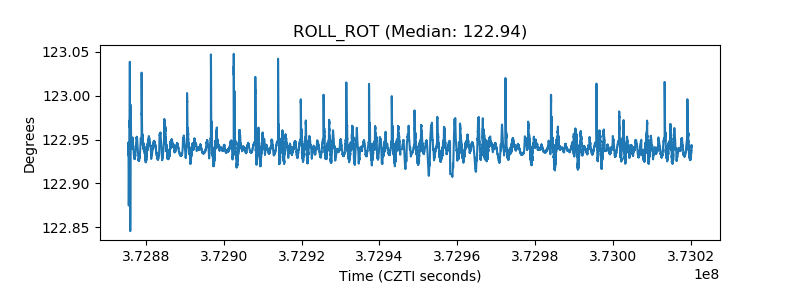 |
| _Roll_DEC |  |
| _Roll_RA |  |
| Veto Counter | 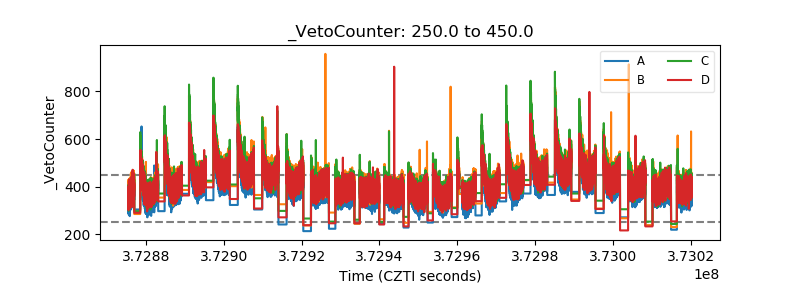 |