| Param | Original file | Final file |
|---|---|---|
| Filename | modeM0/AS1A11_005T04_9000004742_32853cztM0_level2.evt | modeM0/AS1A11_005T04_9000004742_32853cztM0_level2_quad_clean.evt |
| Size (bytes) | 243,878,400 | 26,884,800 |
| Size | 232.6 MB | 25.6 MB |
| Events in quadrant A | 1,205,335 | 164,485 |
| Events in quadrant B | 1,574,997 | 166,577 |
| Events in quadrant C | 1,386,996 | 163,382 |
| Events in quadrant D | 3,048,214 | 140,357 |
| Mode M9 | |||
|---|---|---|---|
| Quadrant | BADHDUFLAG | Total packets | Discarded packets |
| A | 0 | 16 | 0 |
| B | 0 | 16 | 0 |
| C | 0 | 16 | 0 |
| D | 0 | 16 | 0 |
| Mode M0 | |||
|---|---|---|---|
| Quadrant | BADHDUFLAG | Total packets | Discarded packets |
| A | 0 | 5107 | 1 |
| B | 0 | 6315 | 0 |
| C | 0 | 5629 | 0 |
| D | 0 | 10791 | 0 |
| Mode SS | |||
|---|---|---|---|
| Quadrant | BADHDUFLAG | Total packets | Discarded packets |
| A | 0 | 50 | 0 |
| B | 0 | 50 | 0 |
| C | 0 | 50 | 0 |
| D | 0 | 50 | 0 |
| Quadrant | Total seconds | Saturated seconds | Saturation percentage |
|---|---|---|---|
| A | 2490 | 9 | 0.361446% |
| B | 2490 | 54 | 2.168675% |
| C | 2490 | 49 | 1.967871% |
| D | 2490 | 479 | 19.236948% |
Noise dominated data is calculated using 1-second bins in cleaned event files. If a bin has >2000 counts, and if more than 50% of those come from <1% of pixels, then it is considered to be noise-dominated and hence unusable.
| Quadrant | # 1 sec bins | Bins with >0 counts | Bins with >2000 counts | High rate bins dominated by noise | Noise dominated (total time) | Noise dominated (detector-on time) | Marked lightcurve |
|---|---|---|---|---|---|---|---|
| A | 4043 | 2491 | 2 | 2 | 0.05% | 0.08% | 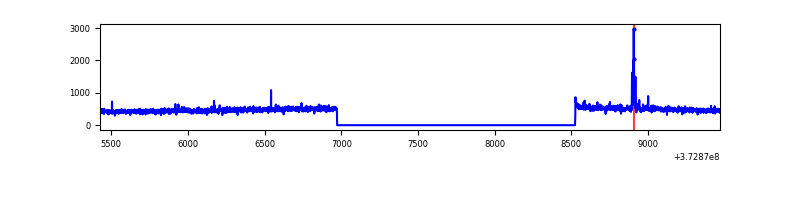 |
| B | 4043 | 2491 | 26 | 26 | 0.64% | 1.04% | 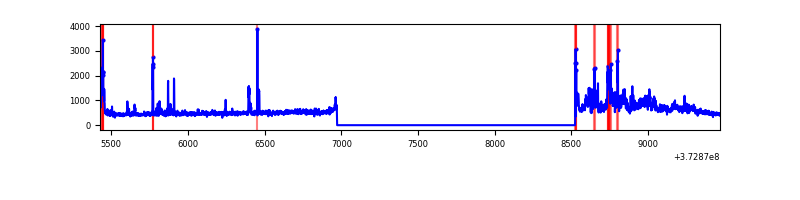 |
| C | 4043 | 2491 | 32 | 32 | 0.79% | 1.28% | 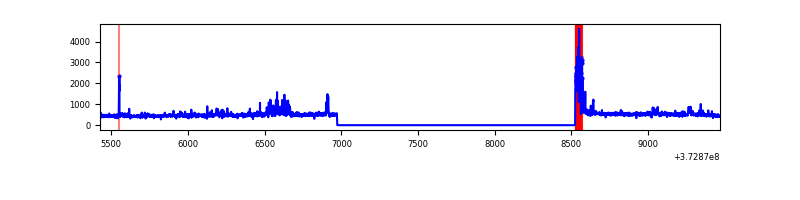 |
| D | 4043 | 2491 | 395 | 395 | 9.77% | 15.86% | 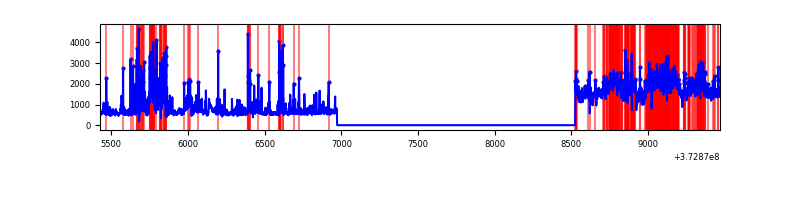 |
Top three noisy pixels from each quadrant. If the there are fewer than three noisy pixels in the level2.evt file, extra rows are filled as -1
| Pixel properties | Quadrant properties | ||||||
|---|---|---|---|---|---|---|---|
| Quadrant | DetID | PixID | Counts | Sigma | Mean | Median | Sigma |
| A | 14 | 239 | 22663 | 358.15 | 304 | 297 | 62.4 |
| A | 13 | 254 | 4870 | 73.23 | 304 | 297 | 62.4 |
| A | 13 | 6 | 3793 | 55.98 | 304 | 297 | 62.4 |
| B | 0 | 219 | 175539 | 2921.74 | 305 | 298 | 60.0 |
| B | 5 | 172 | 152641 | 2539.97 | 305 | 298 | 60.0 |
| B | 0 | 230 | 16481 | 269.81 | 305 | 298 | 60.0 |
| C | 0 | 10 | 106575 | 1549.28 | 293 | 295 | 68.6 |
| C | 3 | 233 | 88852 | 1290.93 | 293 | 295 | 68.6 |
| C | 1 | 241 | 21072 | 302.87 | 293 | 295 | 68.6 |
| D | 12 | 227 | 629464 | 8656.9 | 279 | 273 | 72.7 |
| D | 8 | 195 | 460150 | 6327.34 | 279 | 273 | 72.7 |
| D | 12 | 6 | 322307 | 4430.79 | 279 | 273 | 72.7 |
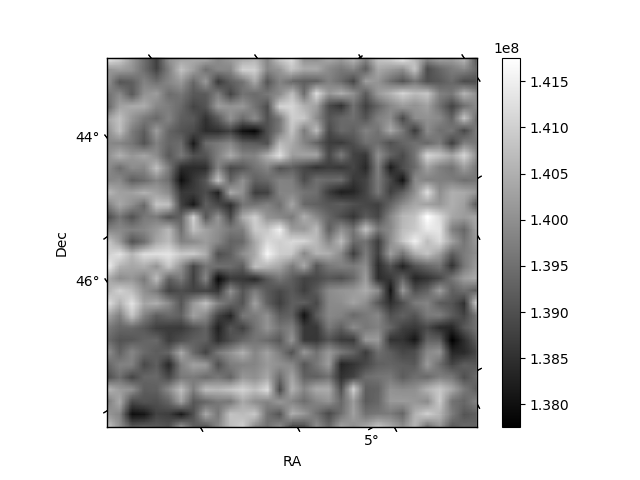
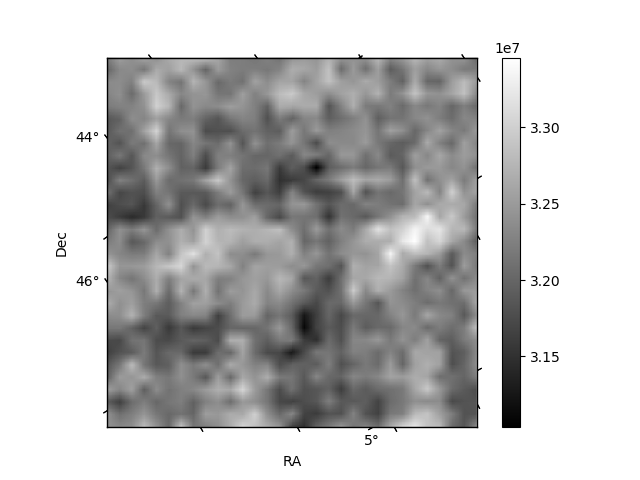
Histogram calculated using DETX and DETY for each event in the final _common_clean file
| Quadrant A | 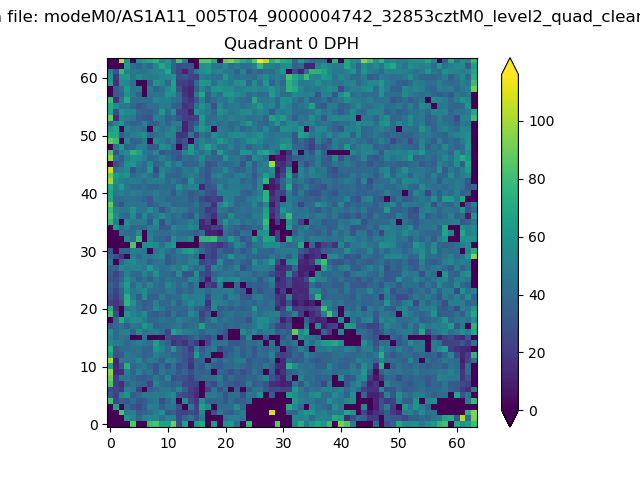 |
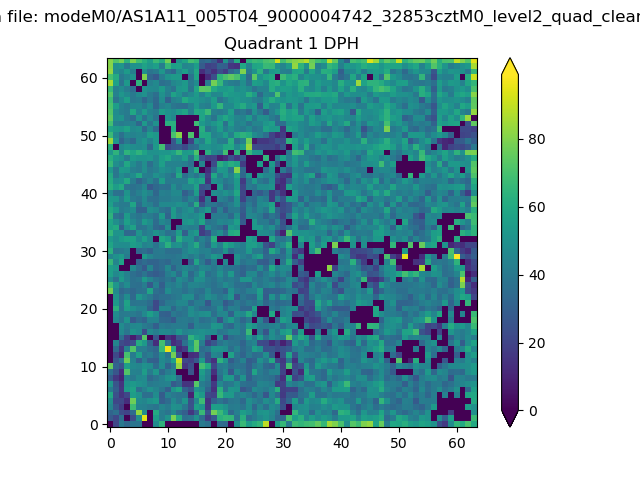 |
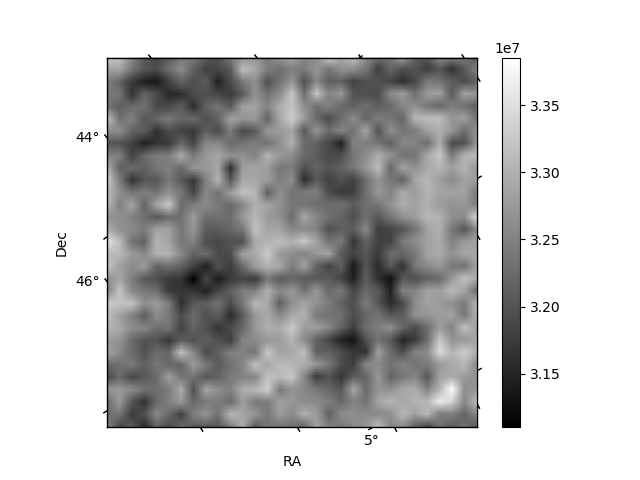
Quadrant B |
|---|---|---|---|
| Quadrant D | 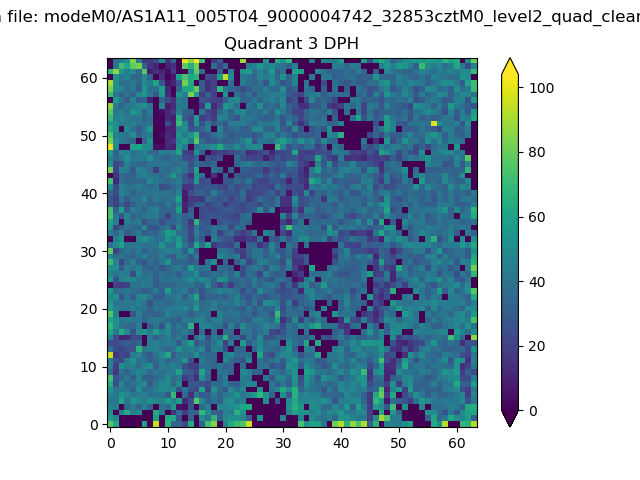 |
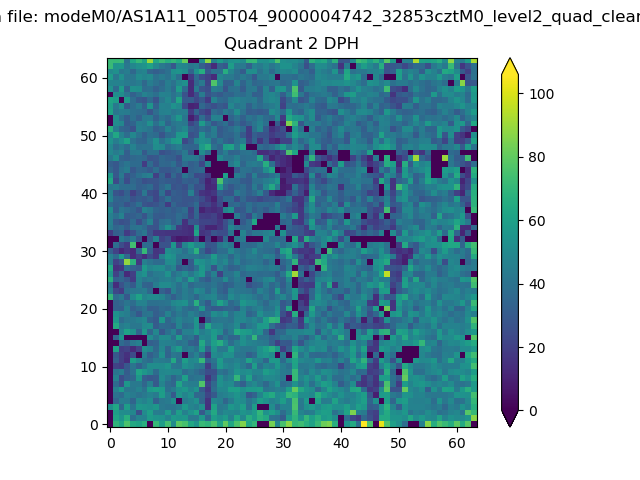 |
Quadrant C |
| Plot type | Count rate plots | Images |
|---|---|---|
| Comparison with Poisson distribution Blue bars denote a histogram of data divided into 1 sec bins. Red curve is a Poisson curve with rate = median count rate of data. |
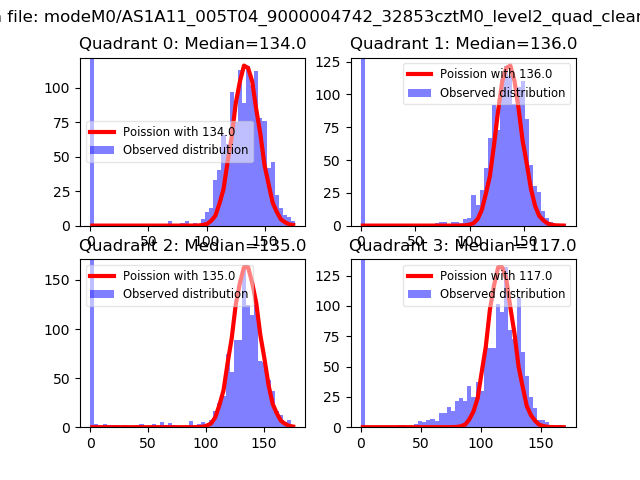 |
 |
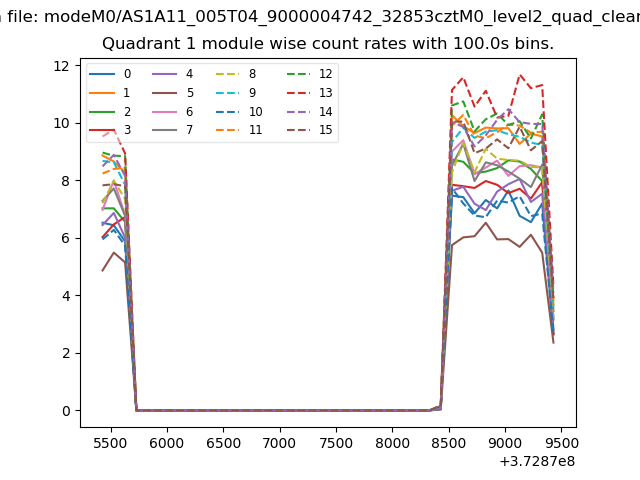
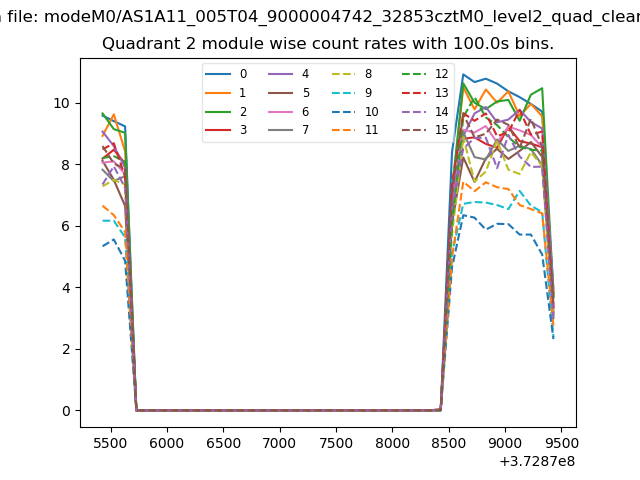
| Quadrant-wise count rates Data is divided into 100 sec bins |
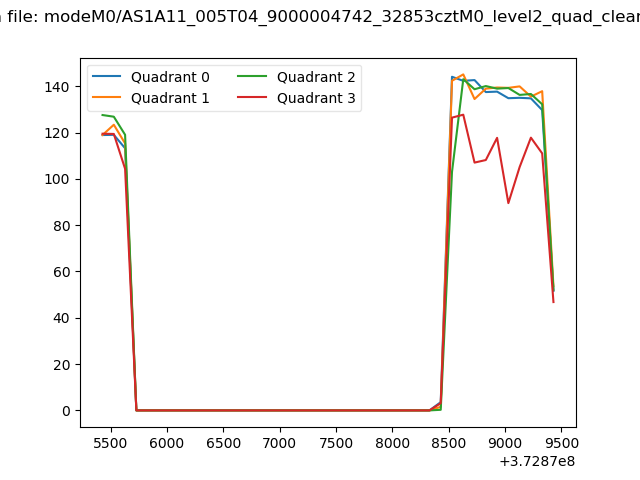 |
|
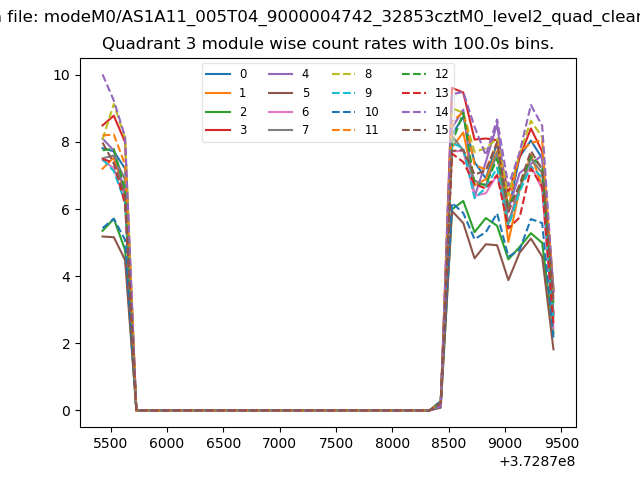
| Module-wise count rates for Quadrant A Data is divided into 100 sec bins |
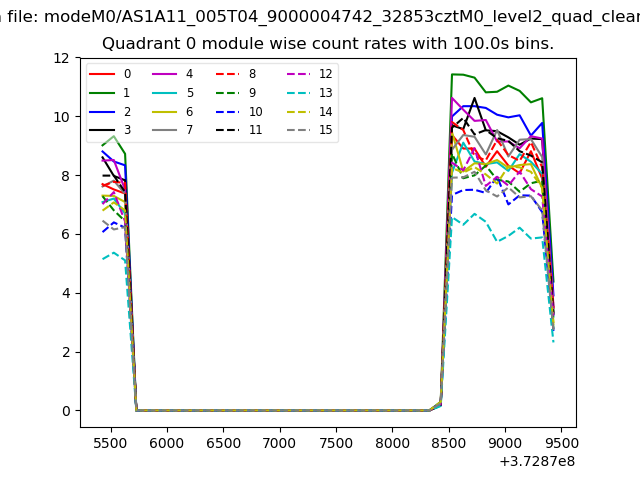 |
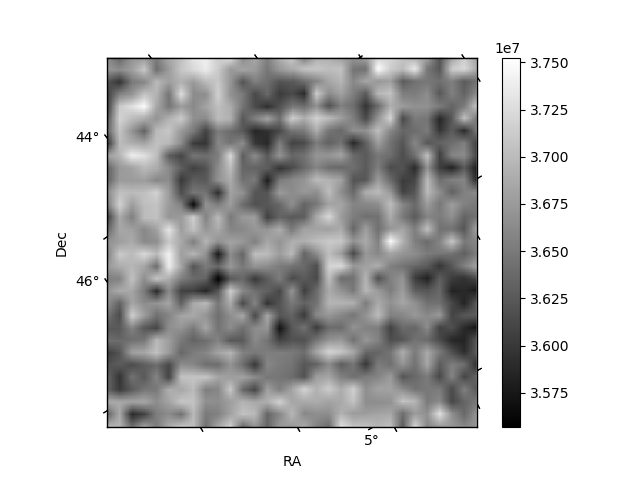 |
| Module-wise count rates for Quadrant B Data is divided into 100 sec bins |
 |
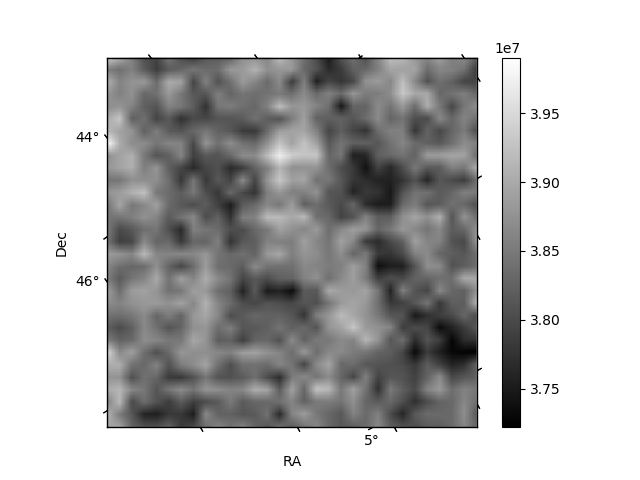 |
| Module-wise count rates for Quadrant C Data is divided into 100 sec bins |
 |
 |
| Module-wise count rates for Quadrant D Data is divided into 100 sec bins |
 |
 |
| Parameter | Plot |
|---|---|
| CZT HV Monitor | 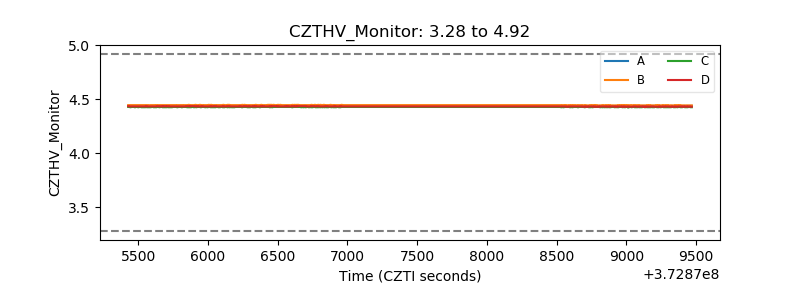 |
| D_VDD | 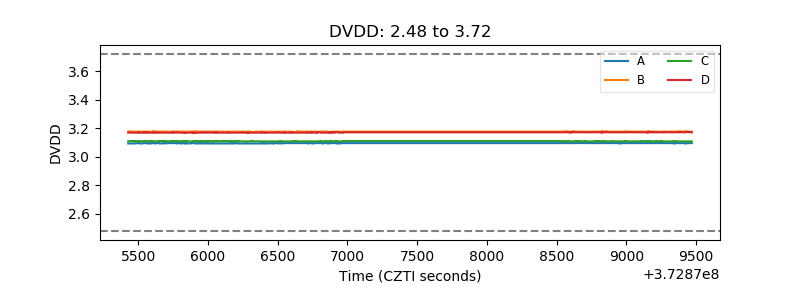 |
| Temperature 1 | 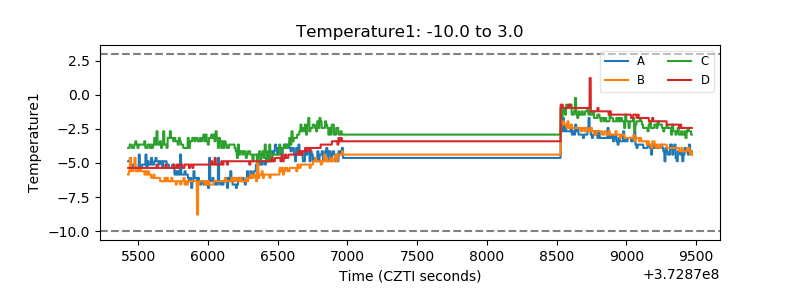 |
| Veto HV Monitor | 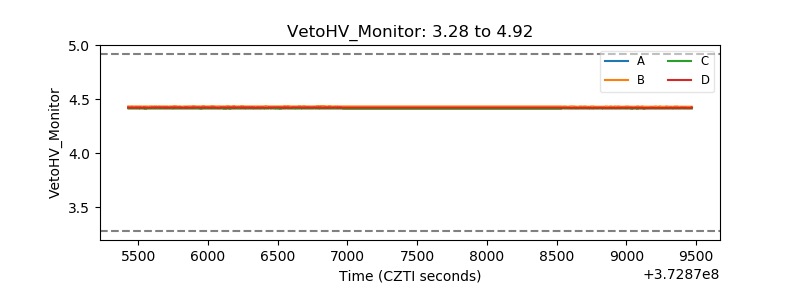 |
| Veto LLD | 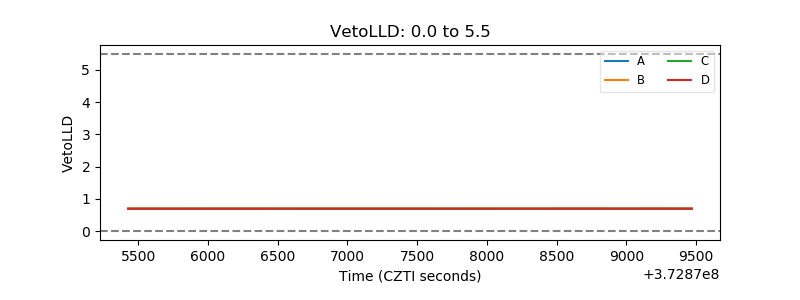 |
| Alpha Counter | 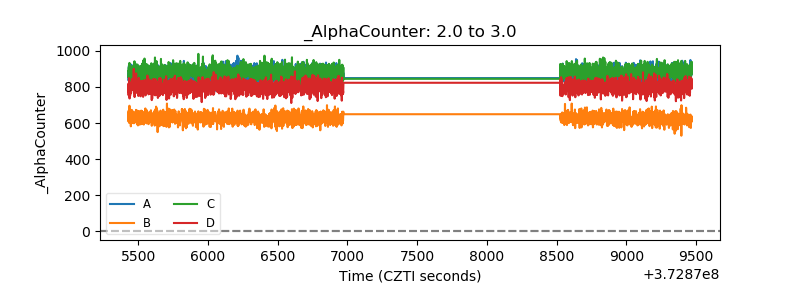 |
| _CPM_Rate | 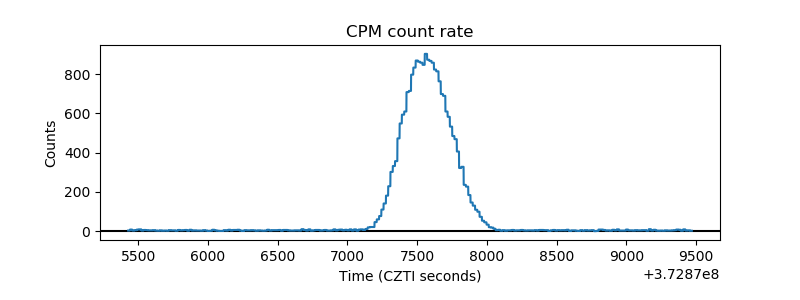 |
| CZT Counter | 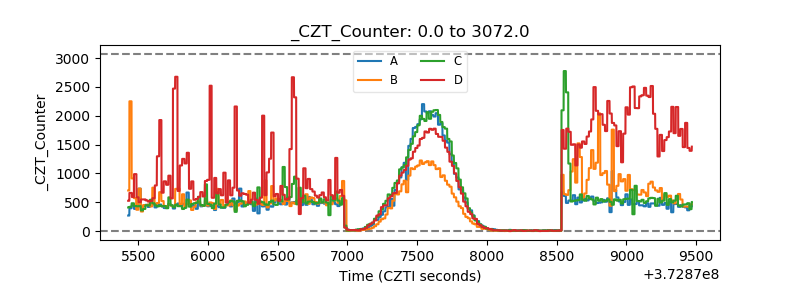 |
| +2.5 Volts monitor |  |
| +5 Volts monitor |  |
| _ROLL_ROT | 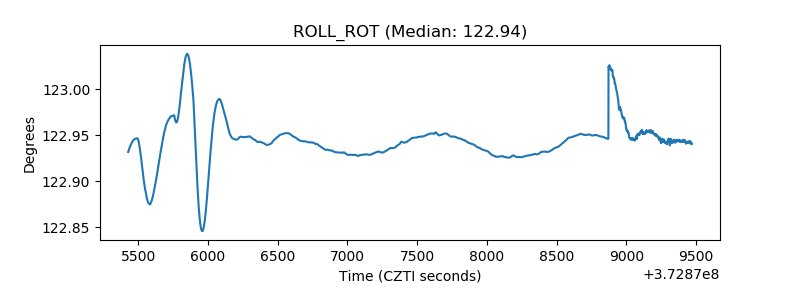 |
| _Roll_DEC | 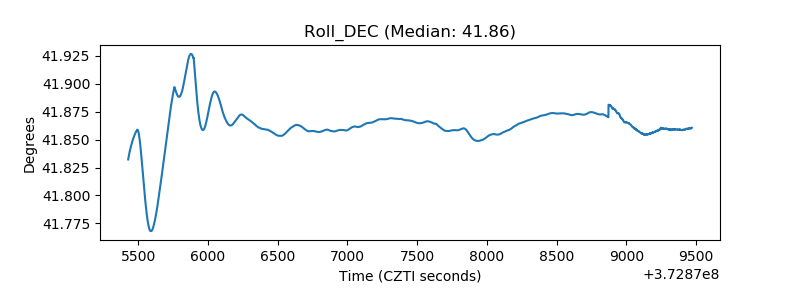 |
| _Roll_RA | 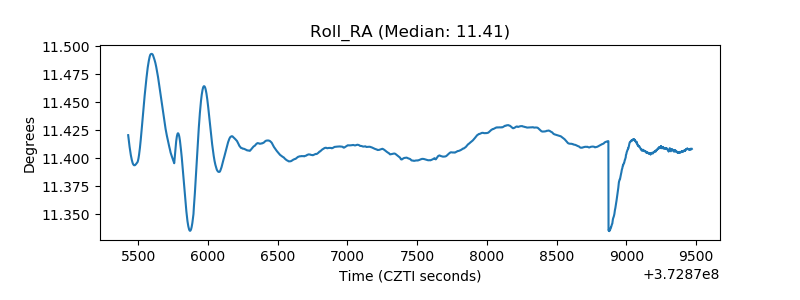 |
| Veto Counter | 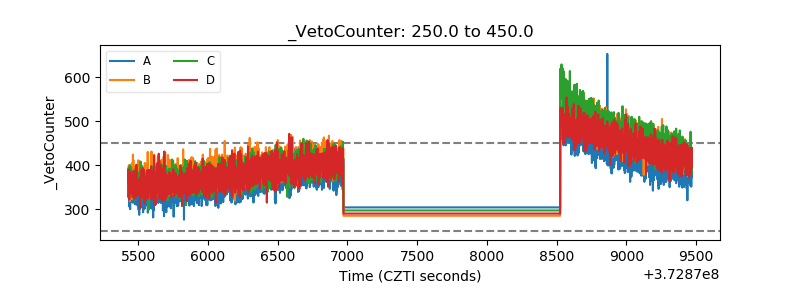 |