| Param | Original file | Final file |
|---|---|---|
| Filename | modeM0/AS1A11_005T04_9000004742_32858cztM0_level2.evt | modeM0/AS1A11_005T04_9000004742_32858cztM0_level2_quad_clean.evt |
| Size (bytes) | 476,205,120 | 70,534,080 |
| Size | 454.1 MB | 67.3 MB |
| Events in quadrant A | 2,494,555 | 458,155 |
| Events in quadrant B | 3,282,115 | 459,557 |
| Events in quadrant C | 2,750,270 | 463,975 |
| Events in quadrant D | 5,556,751 | 404,047 |
| Mode M9 | |||
|---|---|---|---|
| Quadrant | BADHDUFLAG | Total packets | Discarded packets |
| A | 0 | 29 | 0 |
| B | 0 | 29 | 0 |
| C | 0 | 29 | 0 |
| D | 0 | 30 | 0 |
| Mode M0 | |||
|---|---|---|---|
| Quadrant | BADHDUFLAG | Total packets | Discarded packets |
| A | 0 | 10374 | 3 |
| B | 0 | 12821 | 2 |
| C | 0 | 11134 | 2 |
| D | 0 | 19914 | 2 |
| Mode SS | |||
|---|---|---|---|
| Quadrant | BADHDUFLAG | Total packets | Discarded packets |
| A | 0 | 102 | 0 |
| B | 0 | 102 | 0 |
| C | 0 | 102 | 0 |
| D | 0 | 102 | 0 |
| Quadrant | Total seconds | Saturated seconds | Saturation percentage |
|---|---|---|---|
| A | 4987 | 25 | 0.501303% |
| B | 4987 | 274 | 5.494285% |
| C | 4987 | 45 | 0.902346% |
| D | 4987 | 512 | 10.266693% |
Noise dominated data is calculated using 1-second bins in cleaned event files. If a bin has >2000 counts, and if more than 50% of those come from <1% of pixels, then it is considered to be noise-dominated and hence unusable.
| Quadrant | # 1 sec bins | Bins with >0 counts | Bins with >2000 counts | High rate bins dominated by noise | Noise dominated (total time) | Noise dominated (detector-on time) | Marked lightcurve |
|---|---|---|---|---|---|---|---|
| A | 7049 | 4988 | 17 | 17 | 0.24% | 0.34% | 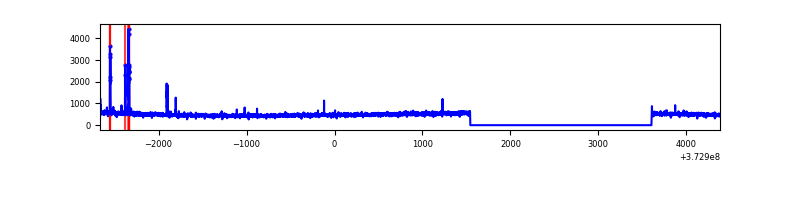 |
| B | 7049 | 4988 | 178 | 178 | 2.53% | 3.57% | 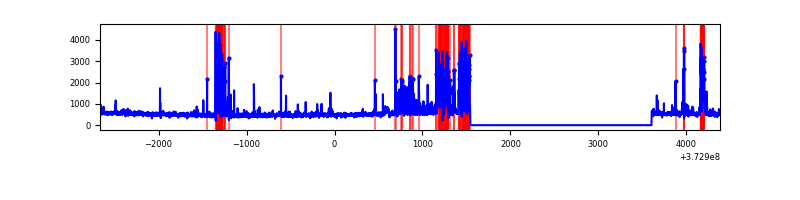 |
| C | 7049 | 4988 | 38 | 38 | 0.54% | 0.76% | 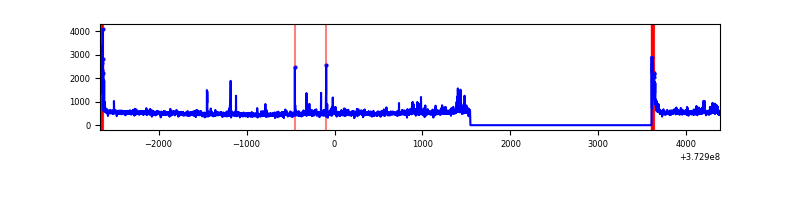 |
| D | 7049 | 4988 | 618 | 618 | 8.77% | 12.39% | 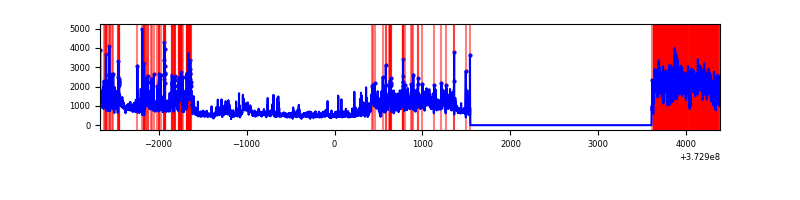 |
Top three noisy pixels from each quadrant. If the there are fewer than three noisy pixels in the level2.evt file, extra rows are filled as -1
| Pixel properties | Quadrant properties | ||||||
|---|---|---|---|---|---|---|---|
| Quadrant | DetID | PixID | Counts | Sigma | Mean | Median | Sigma |
| A | 9 | 143 | 87564 | 712.23 | 621 | 612 | 122.1 |
| A | 13 | 254 | 9119 | 69.68 | 621 | 612 | 122.1 |
| A | 13 | 6 | 7098 | 53.13 | 621 | 612 | 122.1 |
| B | 5 | 172 | 753373 | 6566.62 | 617 | 603 | 114.6 |
| B | 0 | 197 | 28496 | 243.31 | 617 | 603 | 114.6 |
| B | 0 | 230 | 27226 | 232.24 | 617 | 603 | 114.6 |
| C | 3 | 233 | 155634 | 1108.61 | 609 | 615 | 139.8 |
| C | 0 | 10 | 139823 | 995.54 | 609 | 615 | 139.8 |
| C | 1 | 23 | 30947 | 216.92 | 609 | 615 | 139.8 |
| D | 8 | 195 | 1245697 | 8505.2 | 580 | 568 | 146.4 |
| D | 12 | 227 | 1088958 | 7434.55 | 580 | 568 | 146.4 |
| D | 12 | 79 | 408219 | 2784.57 | 580 | 568 | 146.4 |
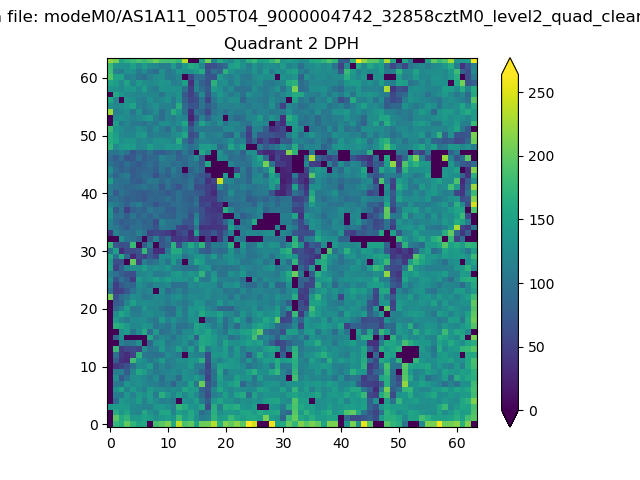
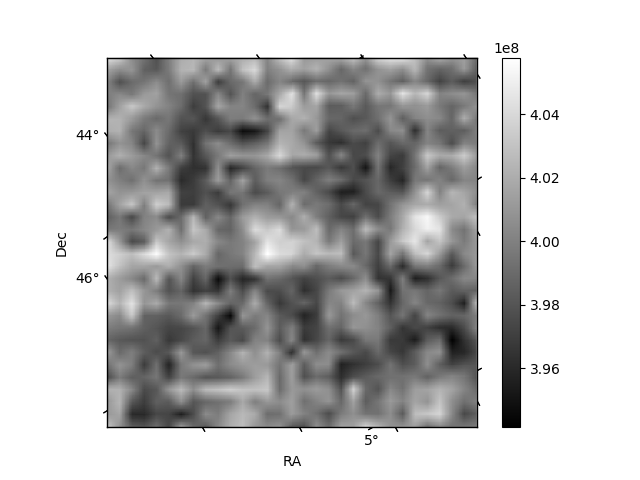
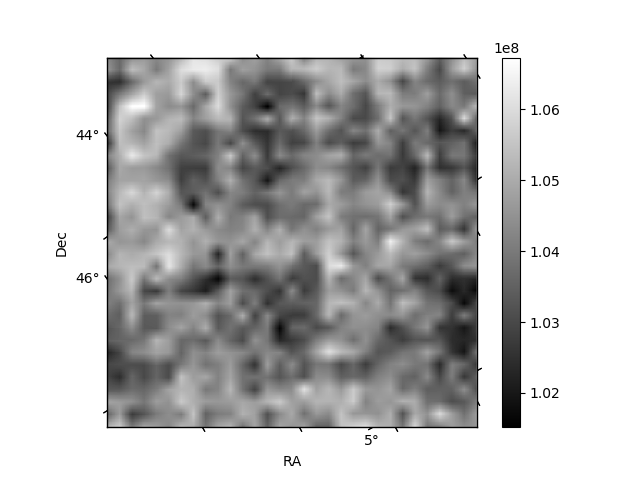
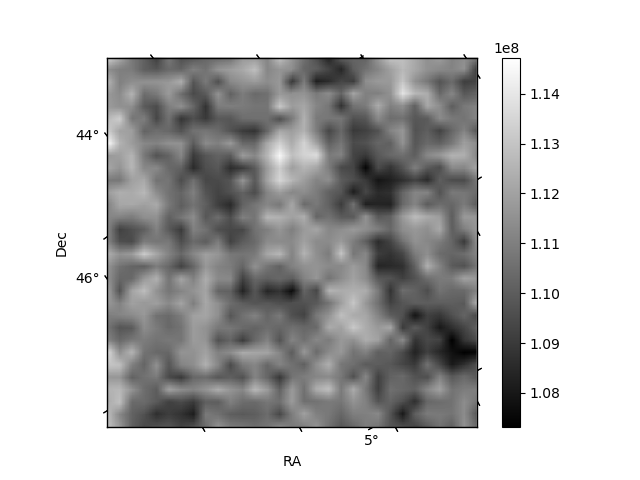
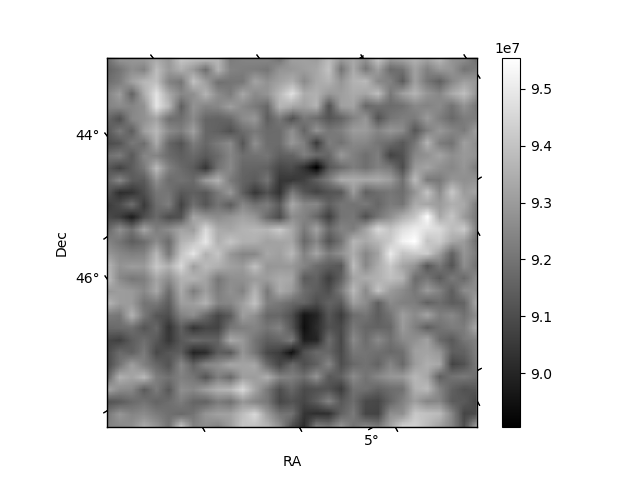
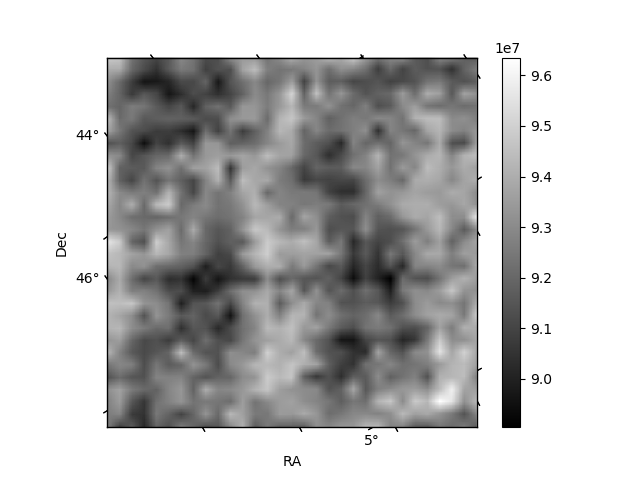
Histogram calculated using DETX and DETY for each event in the final _common_clean file
| Quadrant A | 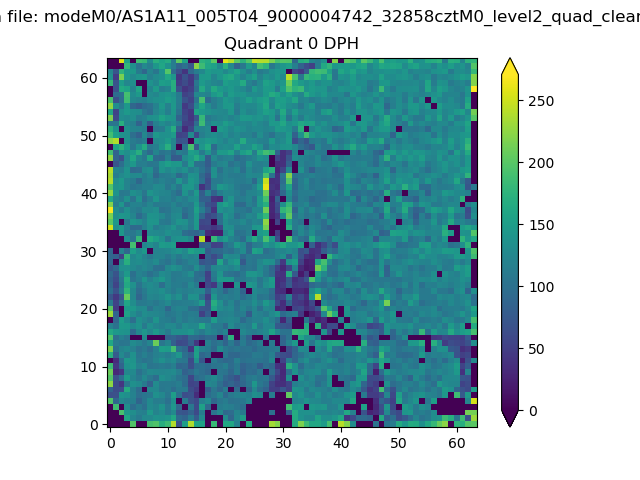 |
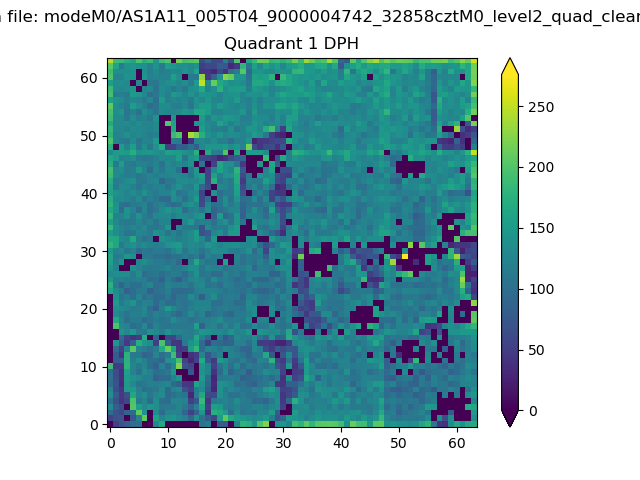 |
Quadrant B |
|---|---|---|---|
| Quadrant D | 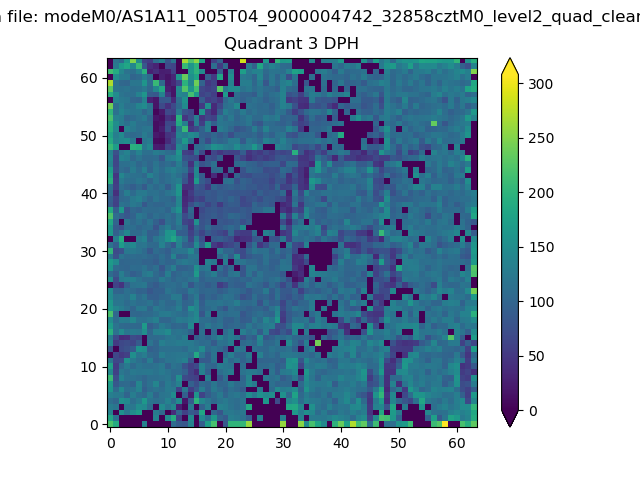 |
 |
Quadrant C |
| Plot type | Count rate plots | Images |
|---|---|---|
| Comparison with Poisson distribution Blue bars denote a histogram of data divided into 1 sec bins. Red curve is a Poisson curve with rate = median count rate of data. |
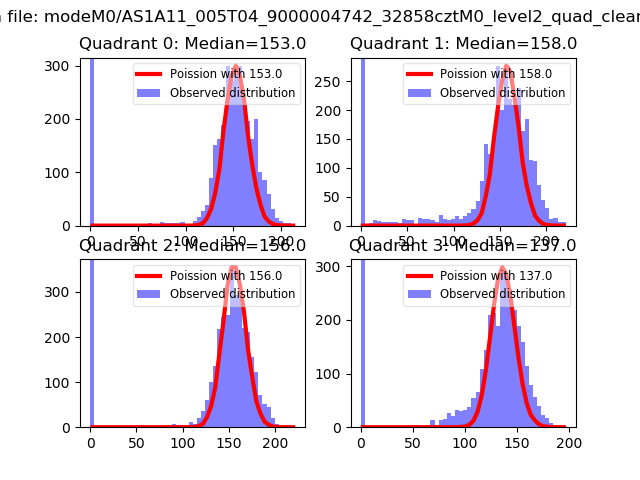 |
 |
| Quadrant-wise count rates Data is divided into 100 sec bins |
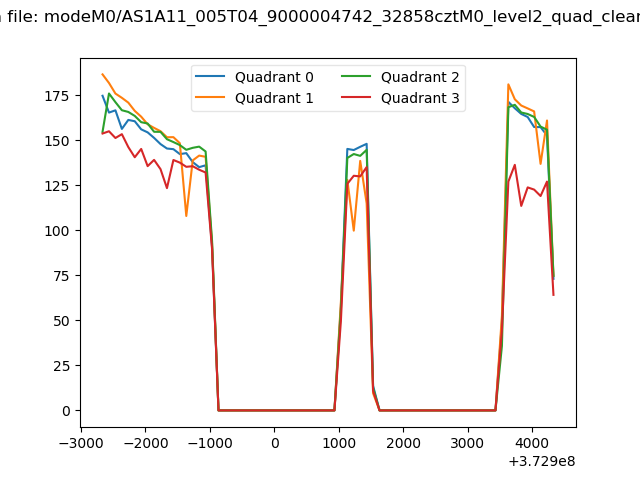 |
|
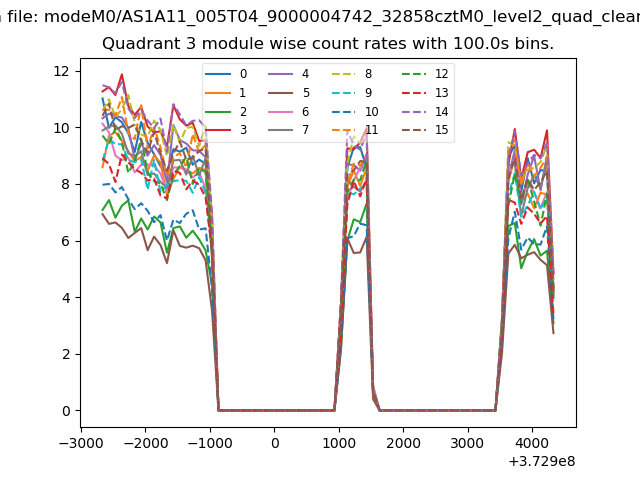
| Module-wise count rates for Quadrant A Data is divided into 100 sec bins |
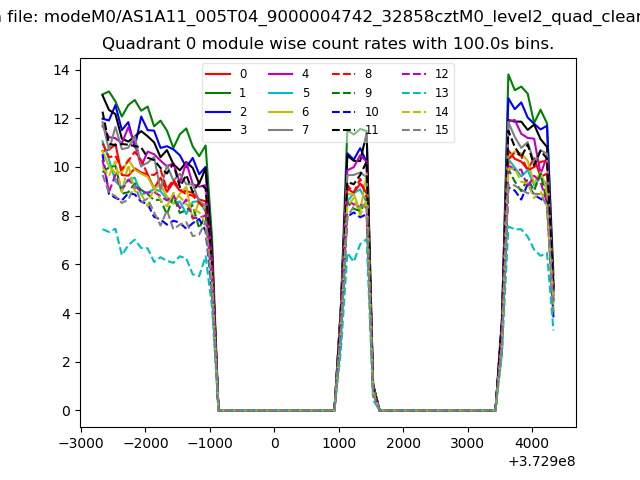 |
 |
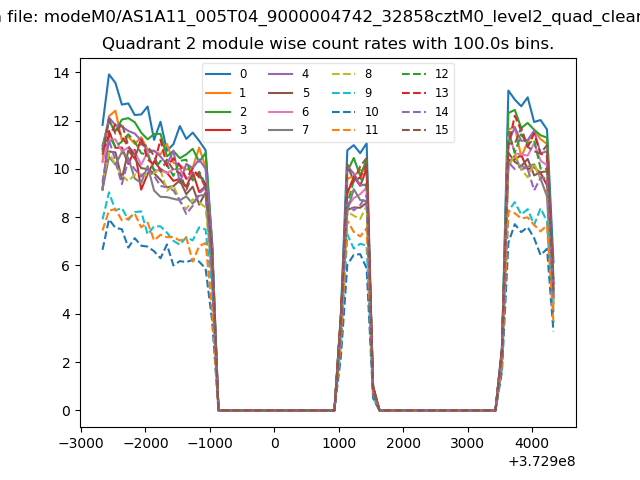
| Module-wise count rates for Quadrant B Data is divided into 100 sec bins |
 |
 |
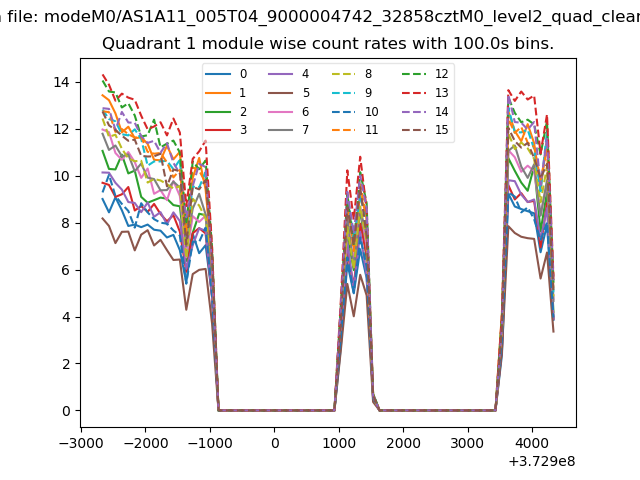
| Module-wise count rates for Quadrant C Data is divided into 100 sec bins |
 |
 |
| Module-wise count rates for Quadrant D Data is divided into 100 sec bins |
 |
 |
| Parameter | Plot |
|---|---|
| CZT HV Monitor | 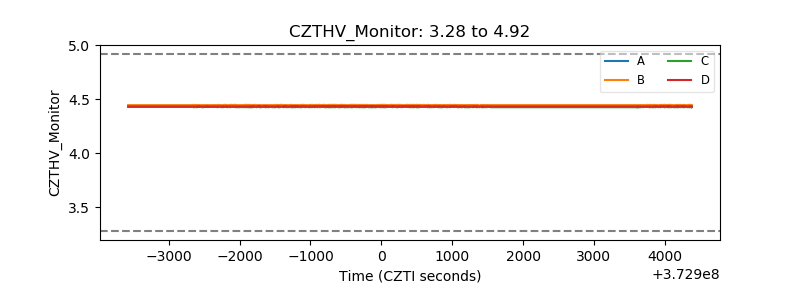 |
| D_VDD | 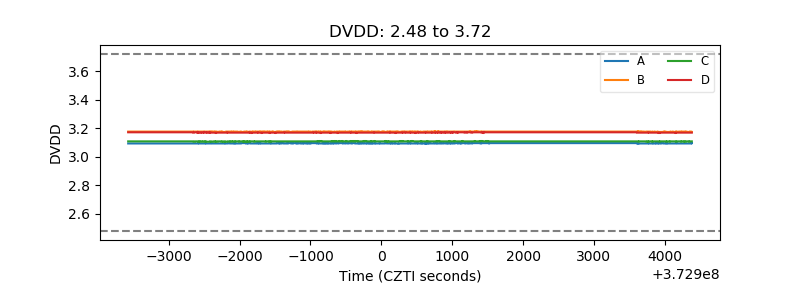 |
| Temperature 1 | 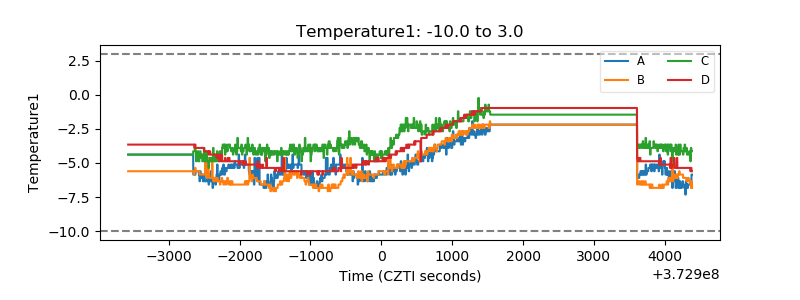 |
| Veto HV Monitor | 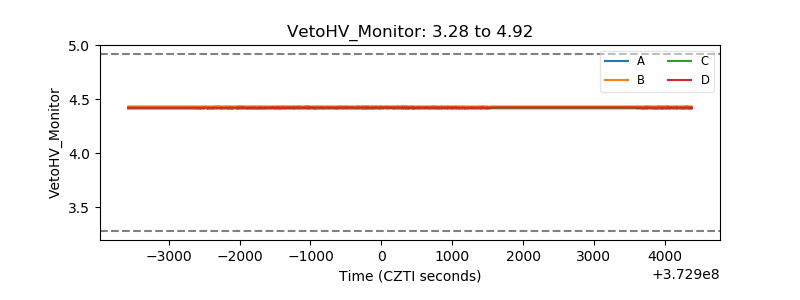 |
| Veto LLD | 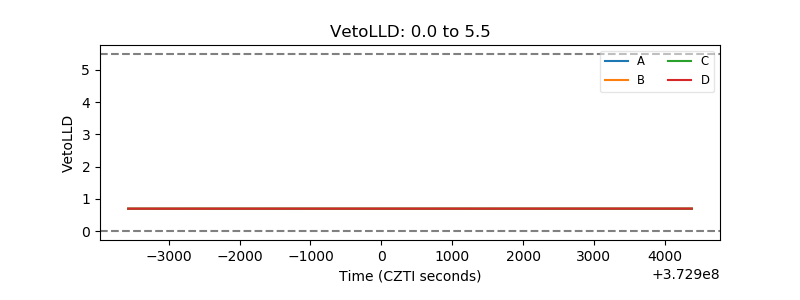 |
| Alpha Counter | 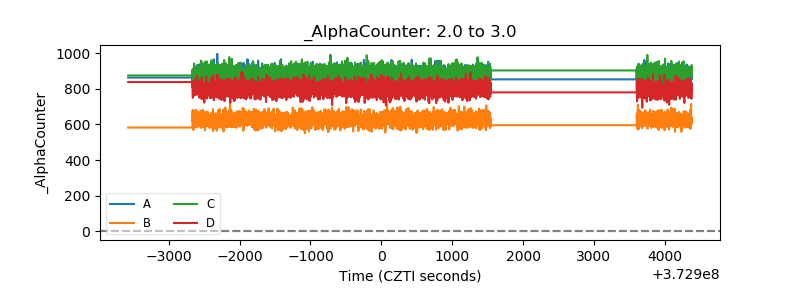 |
| _CPM_Rate | 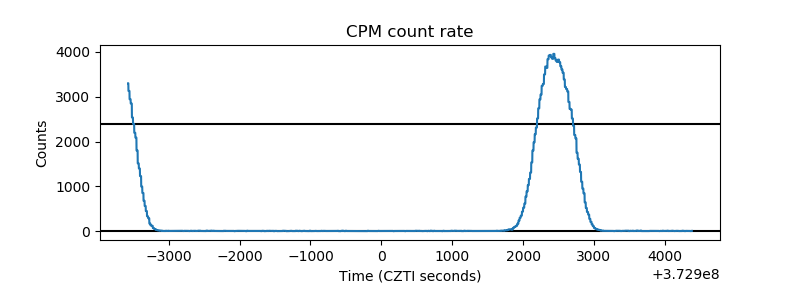 |
| CZT Counter | 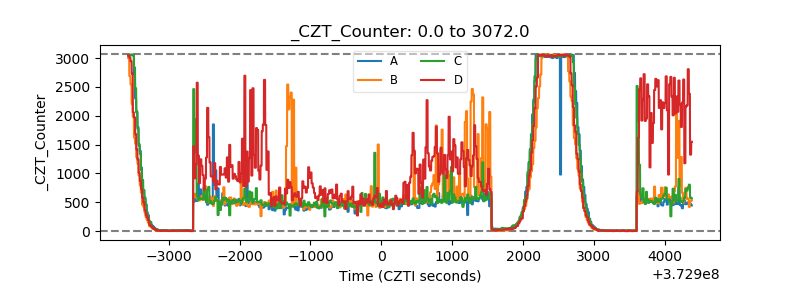 |
| +2.5 Volts monitor | 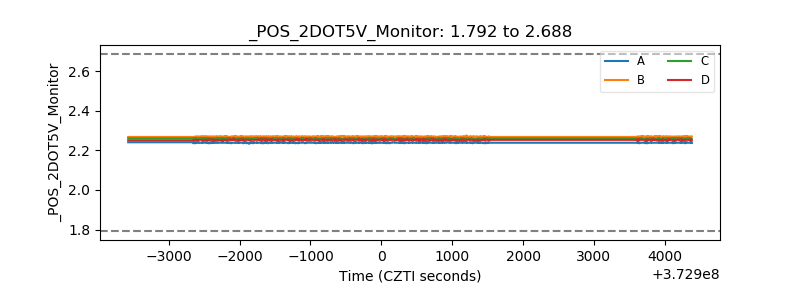 |
| +5 Volts monitor | 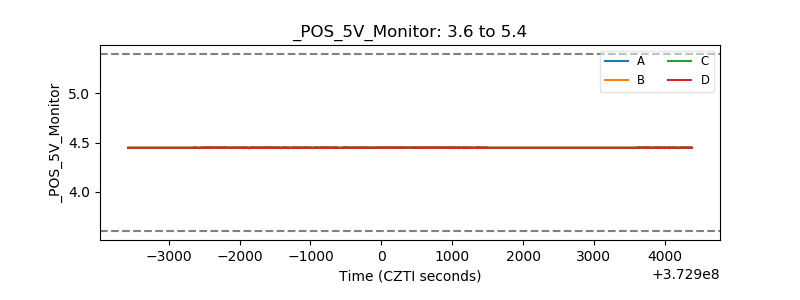 |
| _ROLL_ROT | 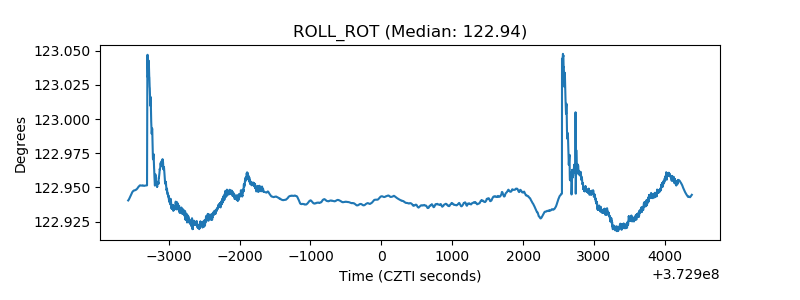 |
| _Roll_DEC | 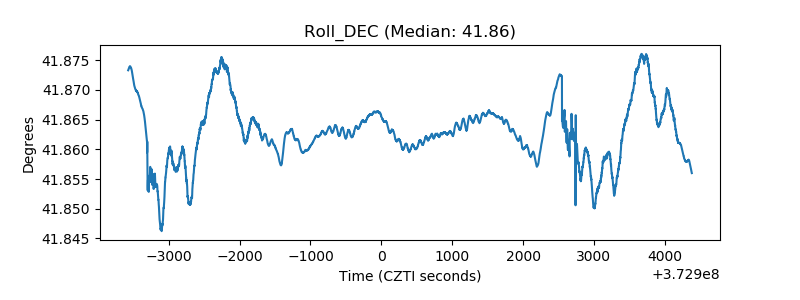 |
| _Roll_RA | 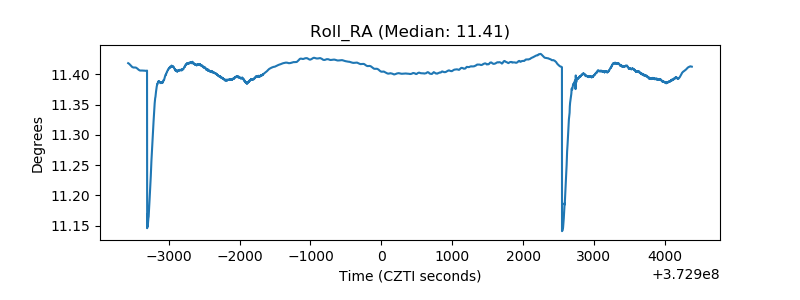 |
| Veto Counter | 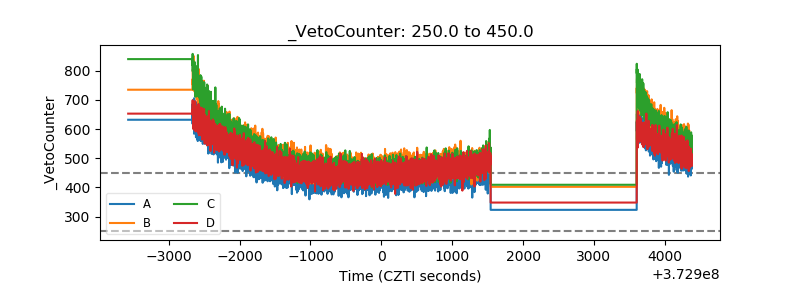 |