| Param | Original file | Final file |
|---|---|---|
| Filename | modeM0/AS1A11_005T04_9000004742_32860cztM0_level2.evt | modeM0/AS1A11_005T04_9000004742_32860cztM0_level2_quad_clean.evt |
| Size (bytes) | 369,861,120 | 37,382,400 |
| Size | 352.7 MB | 35.7 MB |
| Events in quadrant A | 1,615,170 | 272,044 |
| Events in quadrant B | 2,645,590 | 239,434 |
| Events in quadrant C | 1,838,642 | 256,528 |
| Events in quadrant D | 4,885,667 | 137,826 |
| Mode M9 | |||
|---|---|---|---|
| Quadrant | BADHDUFLAG | Total packets | Discarded packets |
| A | 0 | 22 | 0 |
| B | 0 | 22 | 0 |
| C | 0 | 22 | 0 |
| D | 0 | 23 | 1 |
| Mode M0 | |||
|---|---|---|---|
| Quadrant | BADHDUFLAG | Total packets | Discarded packets |
| A | 0 | 9885 | 3086 |
| B | 0 | 14644 | 4720 |
| C | 0 | 11165 | 3702 |
| D | 0 | 26450 | 10003 |
| Mode SS | |||
|---|---|---|---|
| Quadrant | BADHDUFLAG | Total packets | Discarded packets |
| A | 0 | 96 | 30 |
| B | 0 | 98 | 34 |
| C | 0 | 99 | 33 |
| D | 0 | 100 | 34 |
| Quadrant | Total seconds | Saturated seconds | Saturation percentage |
|---|---|---|---|
| A | 3330 | 7 | 0.210210% |
| B | 3236 | 438 | 13.535229% |
| C | 3257 | 63 | 1.934295% |
| D | 2817 | 1335 | 47.390841% |
Noise dominated data is calculated using 1-second bins in cleaned event files. If a bin has >2000 counts, and if more than 50% of those come from <1% of pixels, then it is considered to be noise-dominated and hence unusable.
| Quadrant | # 1 sec bins | Bins with >0 counts | Bins with >2000 counts | High rate bins dominated by noise | Noise dominated (total time) | Noise dominated (detector-on time) | Marked lightcurve |
|---|---|---|---|---|---|---|---|
| A | 7071 | 3767 | 0 | 0 | 0.00% | 0.00% | 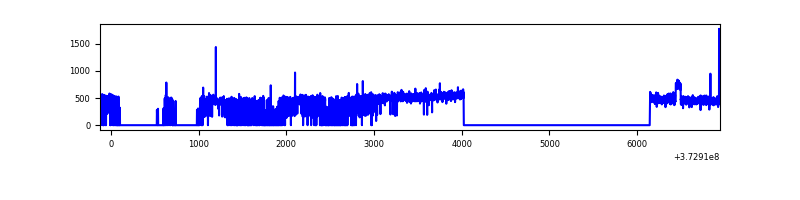 |
| B | 7068 | 3704 | 296 | 296 | 4.19% | 7.99% | 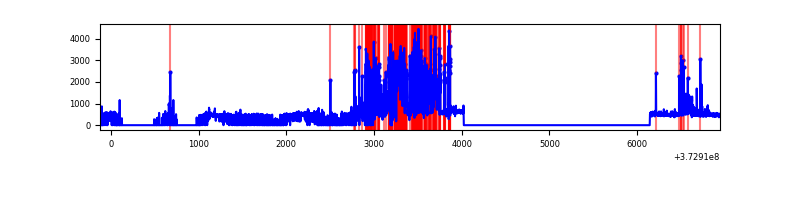 |
| C | 7071 | 3688 | 36 | 36 | 0.51% | 0.98% | 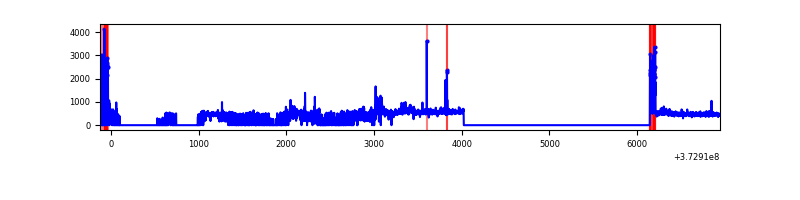 |
| D | 7071 | 3221 | 1177 | 1177 | 16.65% | 36.54% | 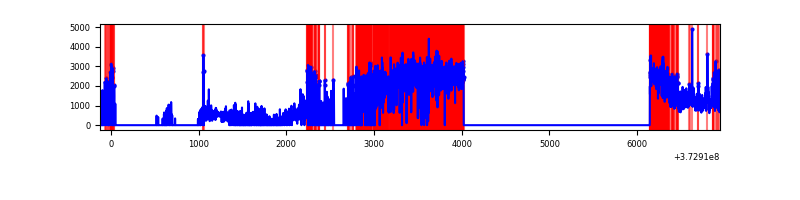 |
Top three noisy pixels from each quadrant. If the there are fewer than three noisy pixels in the level2.evt file, extra rows are filled as -1
| Pixel properties | Quadrant properties | ||||||
|---|---|---|---|---|---|---|---|
| Quadrant | DetID | PixID | Counts | Sigma | Mean | Median | Sigma |
| A | 14 | 238 | 17318 | 203.46 | 411 | 404 | 83.1 |
| A | 9 | 143 | 7529 | 85.71 | 411 | 404 | 83.1 |
| A | 13 | 254 | 5863 | 65.67 | 411 | 404 | 83.1 |
| B | 5 | 172 | 1094046 | 15157.31 | 375 | 367 | 72.2 |
| B | 0 | 197 | 19343 | 262.99 | 375 | 367 | 72.2 |
| B | 0 | 230 | 16509 | 223.71 | 375 | 367 | 72.2 |
| C | 0 | 10 | 144625 | 1631.99 | 384 | 387 | 88.4 |
| C | 3 | 233 | 120300 | 1356.76 | 384 | 387 | 88.4 |
| C | 14 | 67 | 35624 | 398.69 | 384 | 387 | 88.4 |
| D | 12 | 227 | 2619496 | 41662.23 | 258 | 253 | 62.9 |
| D | 2 | 16 | 724233 | 11515.78 | 258 | 253 | 62.9 |
| D | 8 | 195 | 297949 | 4735.21 | 258 | 253 | 62.9 |
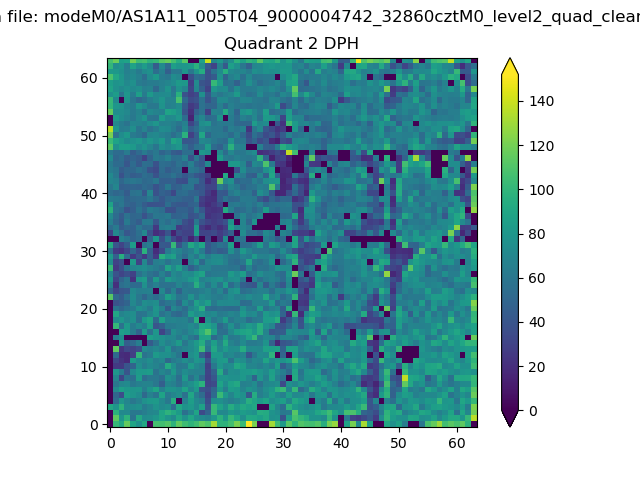
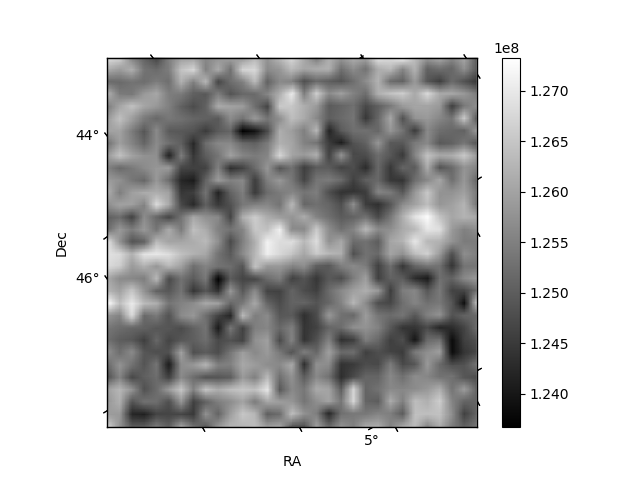
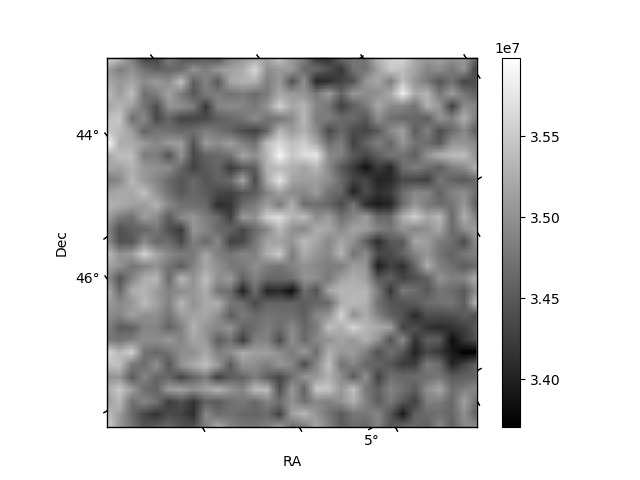
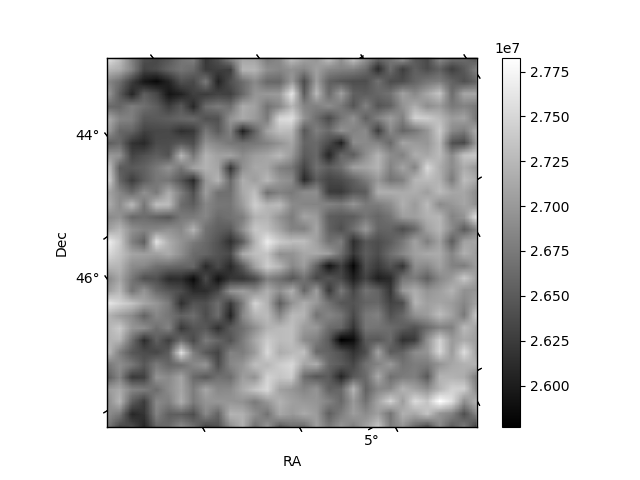
Histogram calculated using DETX and DETY for each event in the final _common_clean file
| Quadrant A | 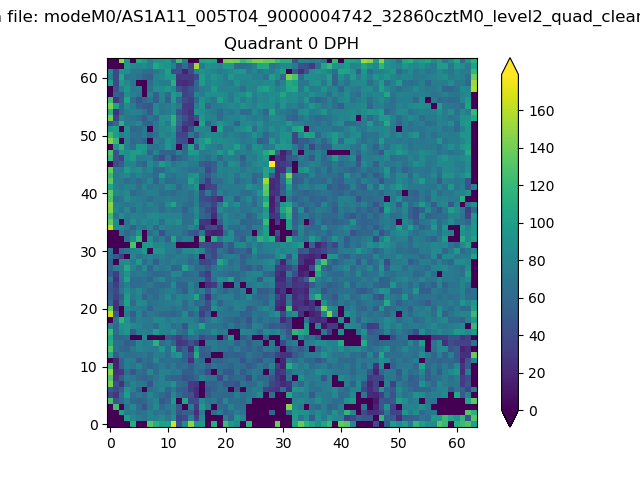 |
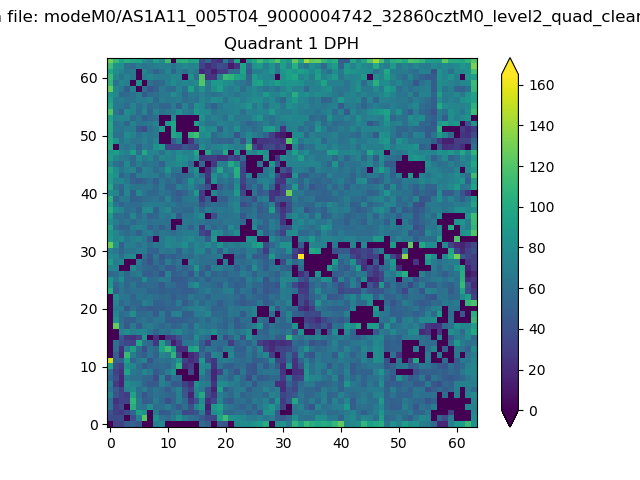 |
Quadrant B |
|---|---|---|---|
| Quadrant D | 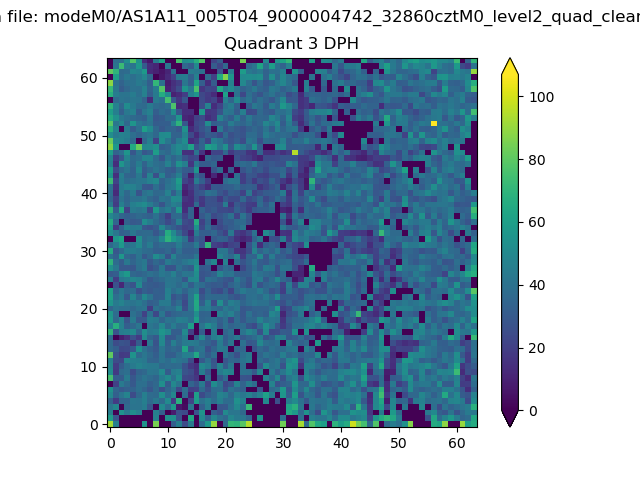 |
 |
Quadrant C |
| Plot type | Count rate plots | Images |
|---|---|---|
| Comparison with Poisson distribution Blue bars denote a histogram of data divided into 1 sec bins. Red curve is a Poisson curve with rate = median count rate of data. |
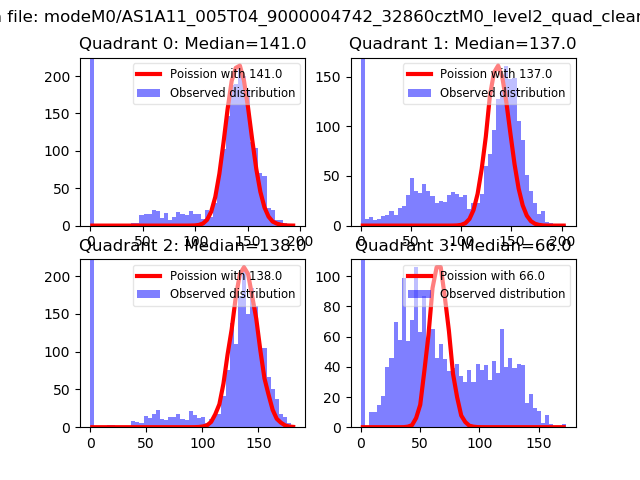 |
 |
| Quadrant-wise count rates Data is divided into 100 sec bins |
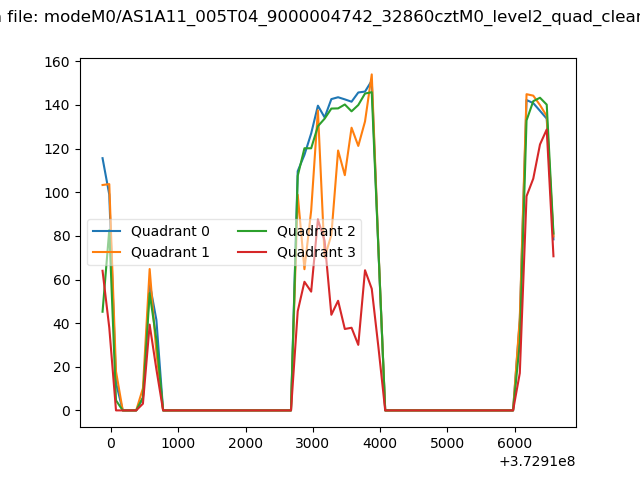 |
|
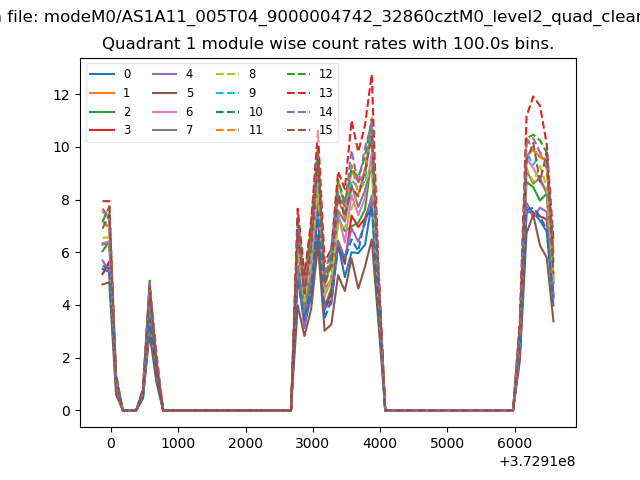
| Module-wise count rates for Quadrant A Data is divided into 100 sec bins |
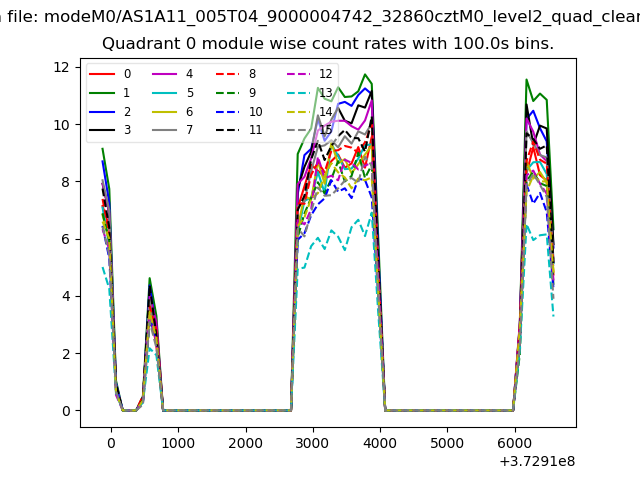 |
 |
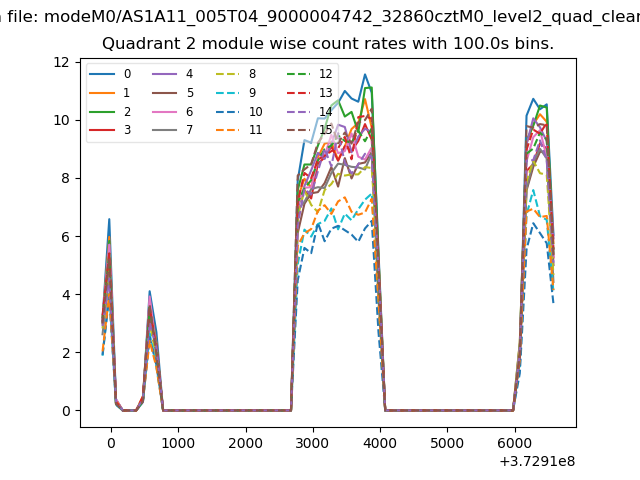
| Module-wise count rates for Quadrant B Data is divided into 100 sec bins |
 |
 |
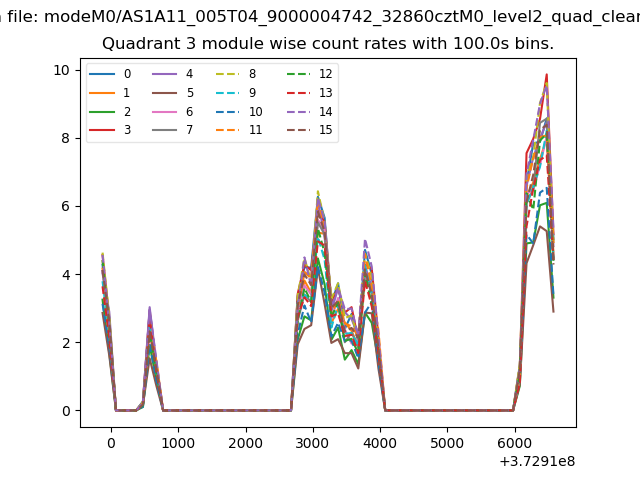
| Module-wise count rates for Quadrant C Data is divided into 100 sec bins |
 |
 |
| Module-wise count rates for Quadrant D Data is divided into 100 sec bins |
 |
 |
| Parameter | Plot |
|---|---|
| CZT HV Monitor | 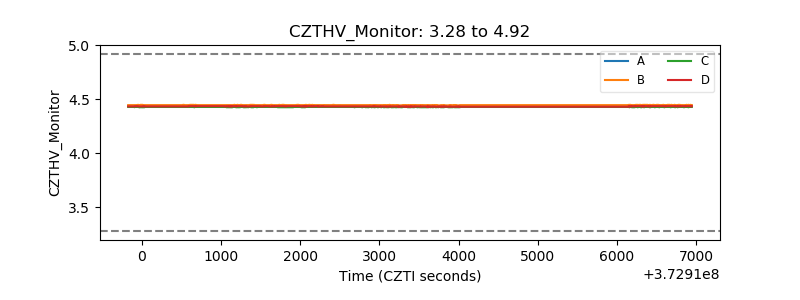 |
| D_VDD | 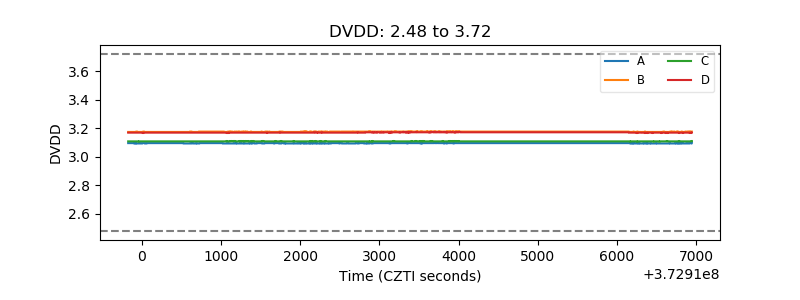 |
| Temperature 1 | 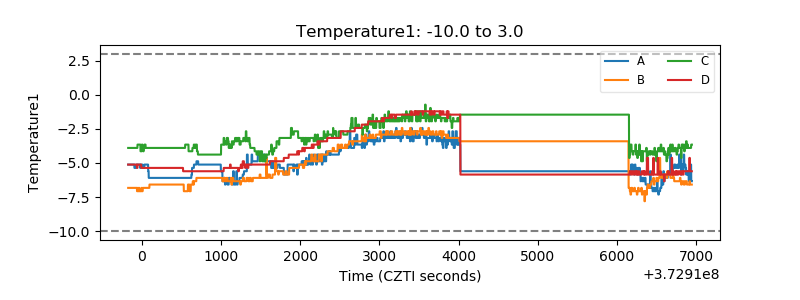 |
| Veto HV Monitor |  |
| Veto LLD | 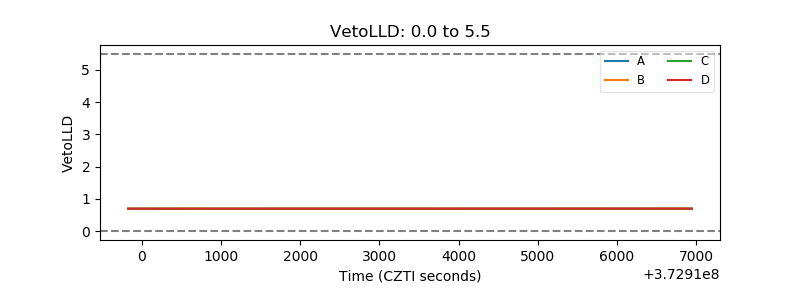 |
| Alpha Counter | 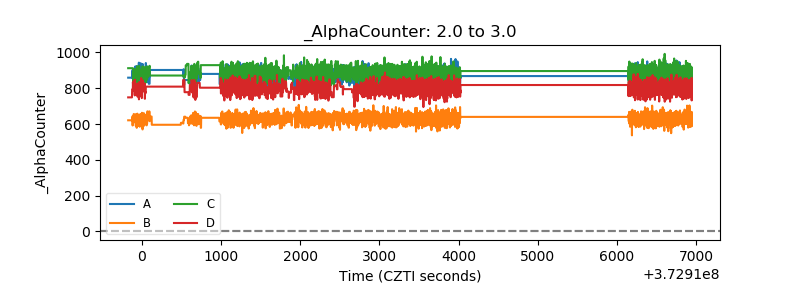 |
| _CPM_Rate | 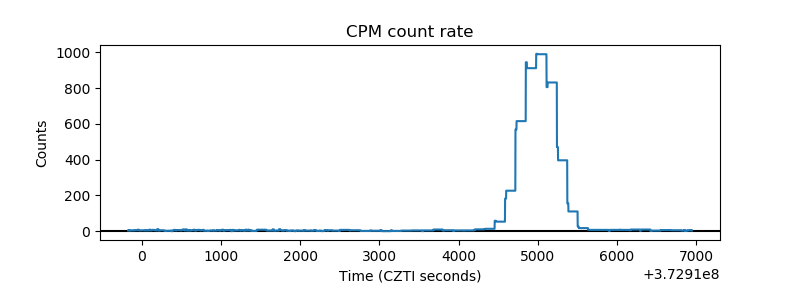 |
| CZT Counter |  |
| +2.5 Volts monitor |  |
| +5 Volts monitor |  |
| _ROLL_ROT | 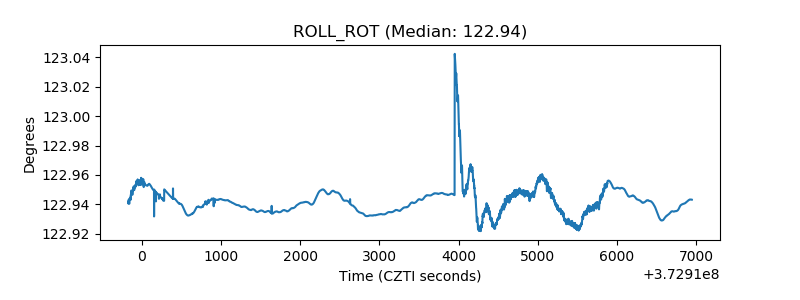 |
| _Roll_DEC | 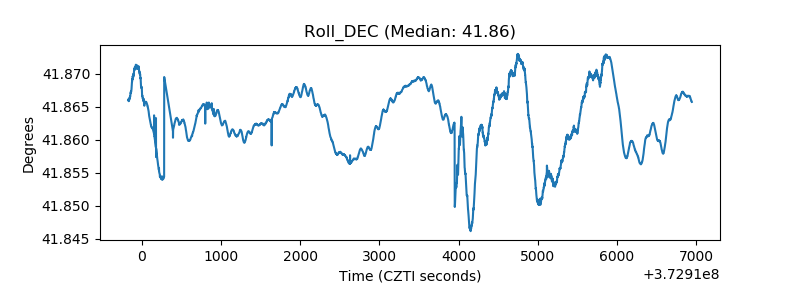 |
| _Roll_RA |  |
| Veto Counter | 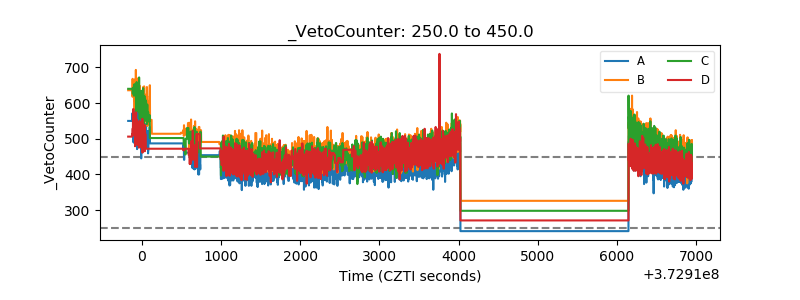 |