| Param | Original file | Final file |
|---|---|---|
| Filename | modeM0/AS1A11_005T04_9000004742_32861cztM0_level2.evt | modeM0/AS1A11_005T04_9000004742_32861cztM0_level2_quad_clean.evt |
| Size (bytes) | 479,024,640 | 43,646,400 |
| Size | 456.8 MB | 41.6 MB |
| Events in quadrant A | 2,142,206 | 271,719 |
| Events in quadrant B | 2,954,077 | 265,598 |
| Events in quadrant C | 2,259,942 | 269,612 |
| Events in quadrant D | 6,837,114 | 188,510 |
| Mode M9 | |||
|---|---|---|---|
| Quadrant | BADHDUFLAG | Total packets | Discarded packets |
| A | 0 | 20 | 0 |
| B | 0 | 20 | 0 |
| C | 0 | 20 | 0 |
| D | 0 | 20 | 0 |
| Mode M0 | |||
|---|---|---|---|
| Quadrant | BADHDUFLAG | Total packets | Discarded packets |
| A | 0 | 9394 | 102 |
| B | 0 | 11831 | 148 |
| C | 0 | 9627 | 59 |
| D | 0 | 23791 | 336 |
| Mode SS | |||
|---|---|---|---|
| Quadrant | BADHDUFLAG | Total packets | Discarded packets |
| A | 0 | 96 | 0 |
| B | 0 | 96 | 0 |
| C | 0 | 96 | 0 |
| D | 0 | 96 | 0 |
| Quadrant | Total seconds | Saturated seconds | Saturation percentage |
|---|---|---|---|
| A | 4624 | 4 | 0.086505% |
| B | 4624 | 190 | 4.108997% |
| C | 4638 | 7 | 0.150927% |
| D | 4592 | 1241 | 27.025261% |
Noise dominated data is calculated using 1-second bins in cleaned event files. If a bin has >2000 counts, and if more than 50% of those come from <1% of pixels, then it is considered to be noise-dominated and hence unusable.
| Quadrant | # 1 sec bins | Bins with >0 counts | Bins with >2000 counts | High rate bins dominated by noise | Noise dominated (total time) | Noise dominated (detector-on time) | Marked lightcurve |
|---|---|---|---|---|---|---|---|
| A | 6670 | 4658 | 0 | 0 | 0.00% | 0.00% | 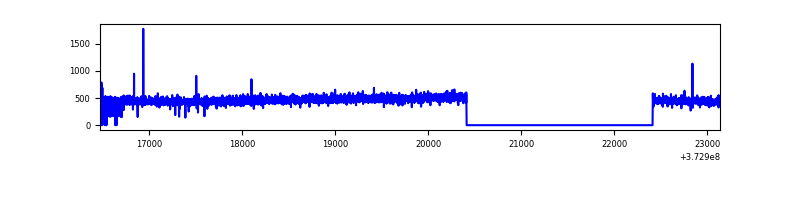 |
| B | 6670 | 4656 | 131 | 131 | 1.96% | 2.81% | 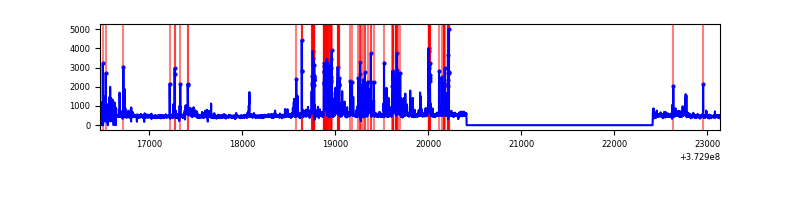 |
| C | 6670 | 4663 | 6 | 6 | 0.09% | 0.13% |  |
| D | 6669 | 4648 | 1106 | 1106 | 16.58% | 23.80% | 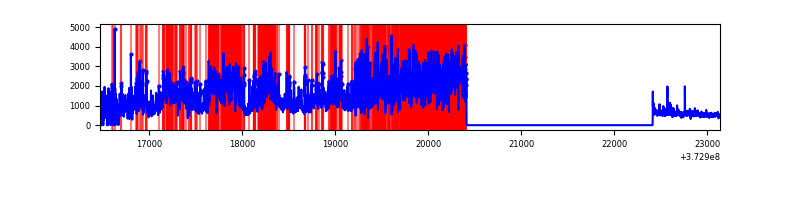 |
Top three noisy pixels from each quadrant. If the there are fewer than three noisy pixels in the level2.evt file, extra rows are filled as -1
| Pixel properties | Quadrant properties | ||||||
|---|---|---|---|---|---|---|---|
| Quadrant | DetID | PixID | Counts | Sigma | Mean | Median | Sigma |
| A | 13 | 254 | 8239 | 69.87 | 552 | 540 | 110.2 |
| A | 3 | 137 | 4989 | 40.37 | 552 | 540 | 110.2 |
| A | 0 | 226 | 4733 | 38.05 | 552 | 540 | 110.2 |
| B | 5 | 172 | 494402 | 4800.74 | 544 | 532 | 102.9 |
| B | 15 | 85 | 100107 | 967.93 | 544 | 532 | 102.9 |
| B | 0 | 190 | 67396 | 649.96 | 544 | 532 | 102.9 |
| C | 3 | 233 | 71272 | 575.14 | 535 | 540 | 123.0 |
| C | 14 | 67 | 41909 | 336.38 | 535 | 540 | 123.0 |
| C | 0 | 10 | 28354 | 226.16 | 535 | 540 | 123.0 |
| D | 12 | 227 | 2684711 | 23695.51 | 469 | 456 | 113.3 |
| D | 2 | 16 | 785380 | 6928.99 | 469 | 456 | 113.3 |
| D | 8 | 195 | 654024 | 5769.43 | 469 | 456 | 113.3 |
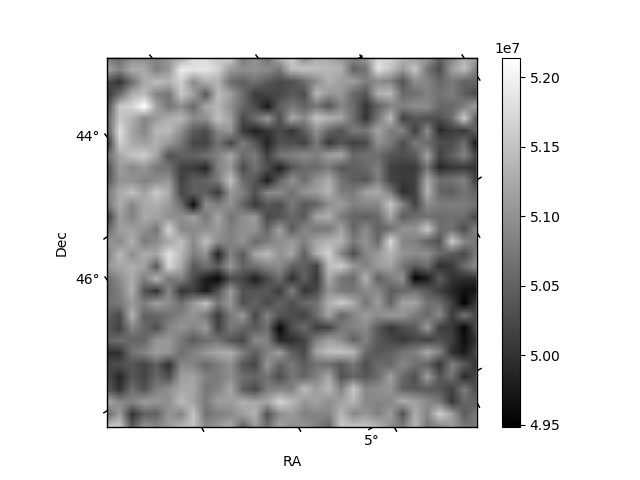
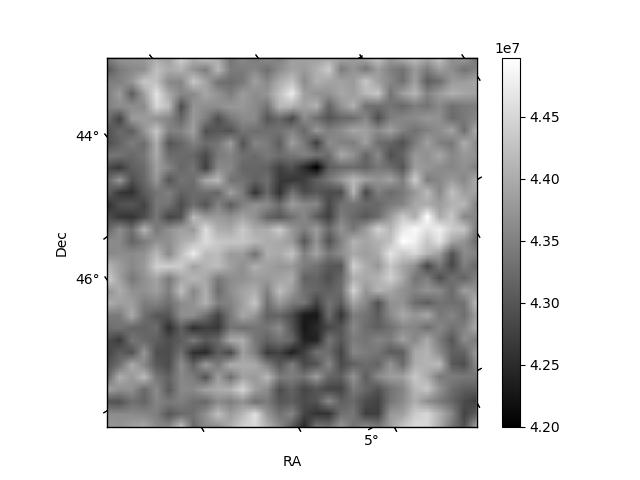
Histogram calculated using DETX and DETY for each event in the final _common_clean file
| Quadrant A | 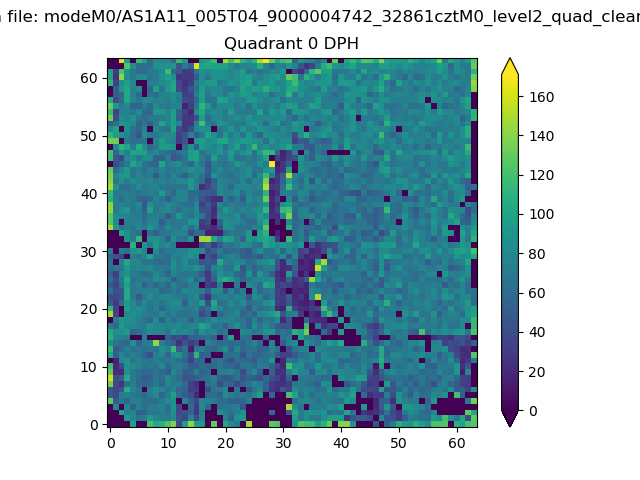 |
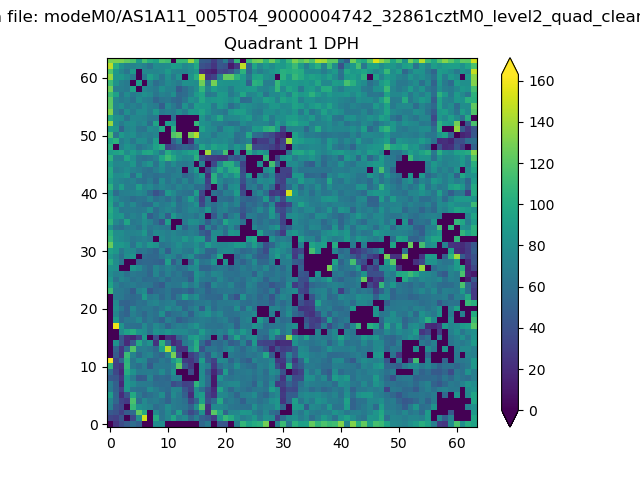 |
Quadrant B |
|---|---|---|---|
| Quadrant D |  |
 |
Quadrant C |
| Plot type | Count rate plots | Images |
|---|---|---|
| Comparison with Poisson distribution Blue bars denote a histogram of data divided into 1 sec bins. Red curve is a Poisson curve with rate = median count rate of data. |
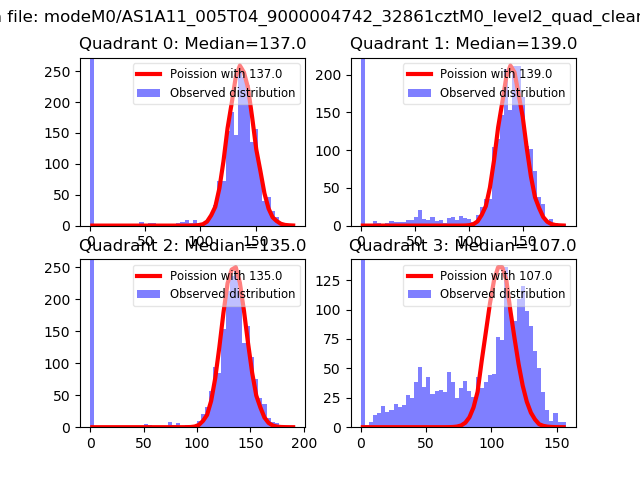 |
 |
| Quadrant-wise count rates Data is divided into 100 sec bins |
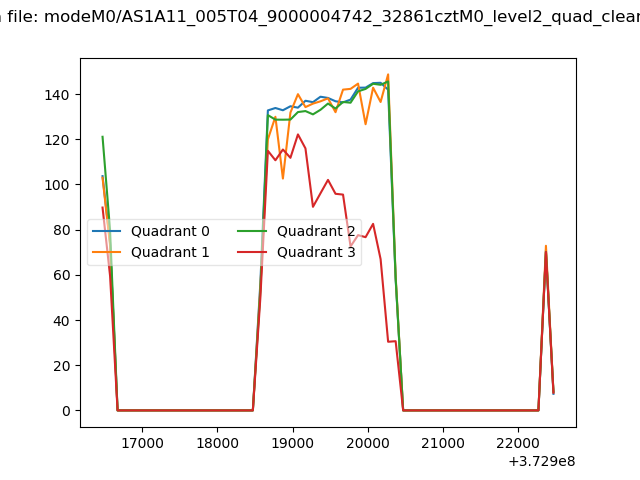 |
|
| Module-wise count rates for Quadrant A Data is divided into 100 sec bins |
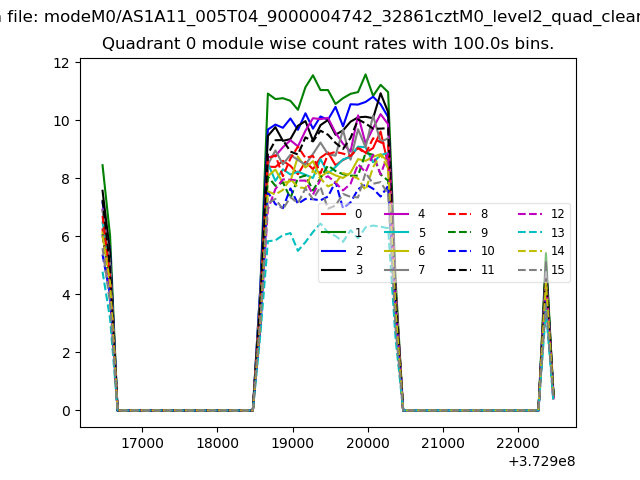 |
 |
| Module-wise count rates for Quadrant B Data is divided into 100 sec bins |
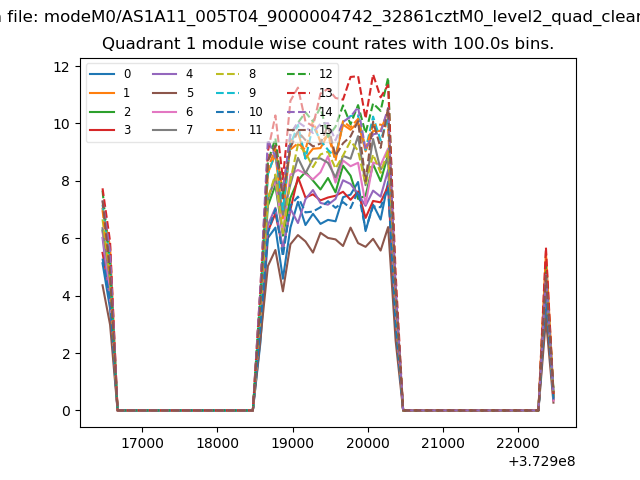 |
 |
| Module-wise count rates for Quadrant C Data is divided into 100 sec bins |
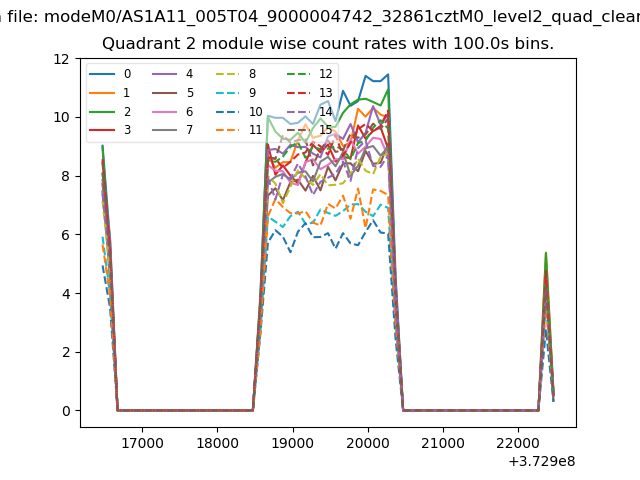 |
 |
| Module-wise count rates for Quadrant D Data is divided into 100 sec bins |
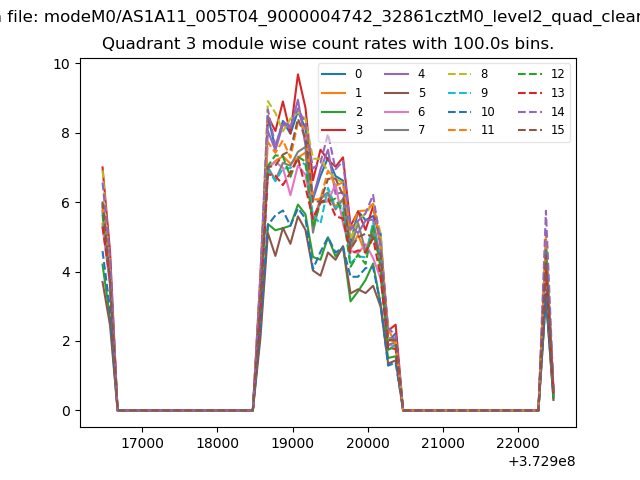 |
 |
| Parameter | Plot |
|---|---|
| CZT HV Monitor | 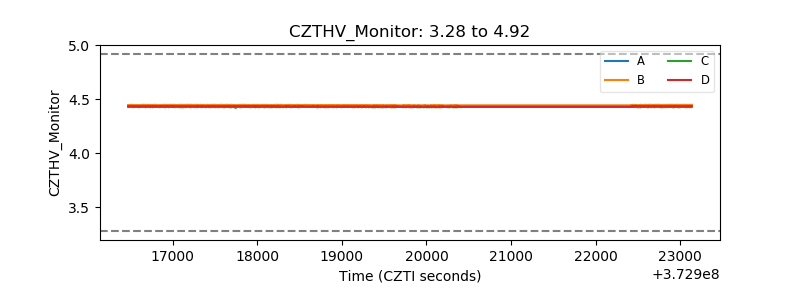 |
| D_VDD | 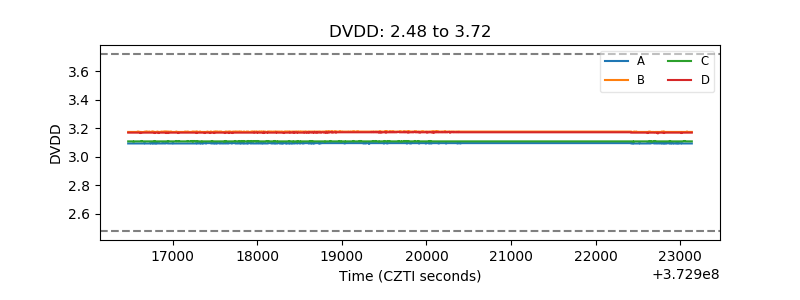 |
| Temperature 1 | 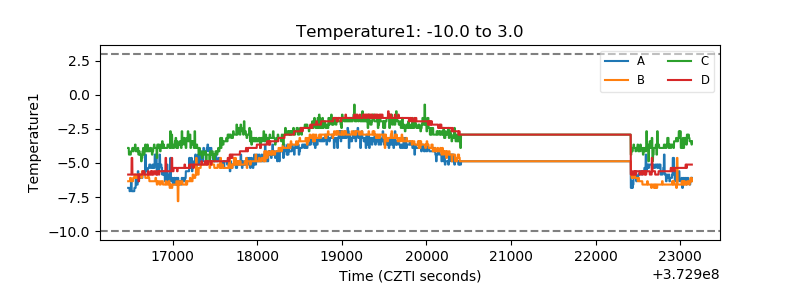 |
| Veto HV Monitor | 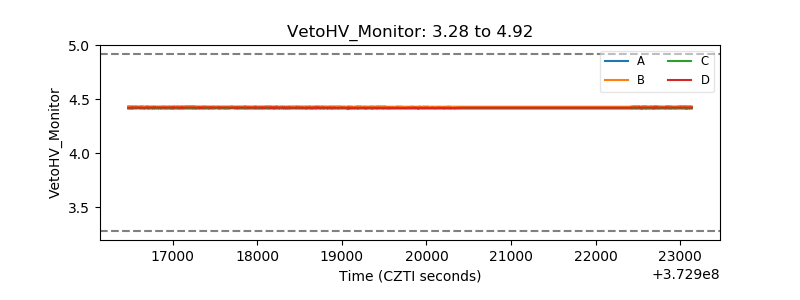 |
| Veto LLD | 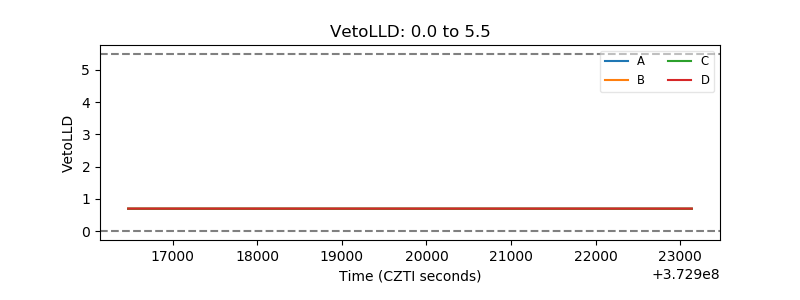 |
| Alpha Counter | 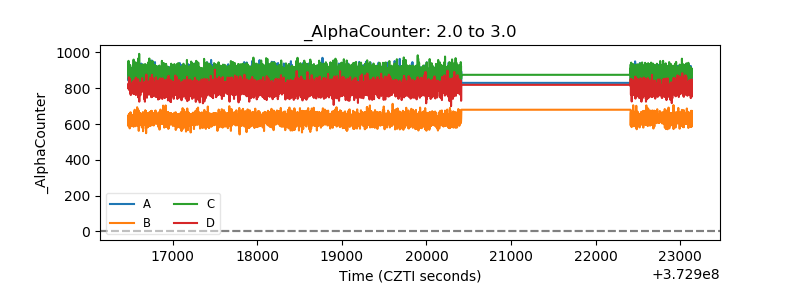 |
| _CPM_Rate | 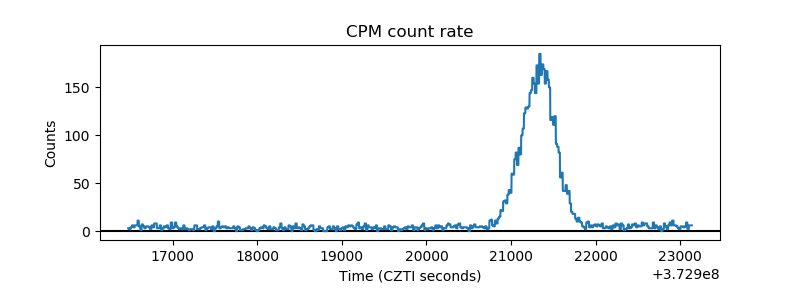 |
| CZT Counter | 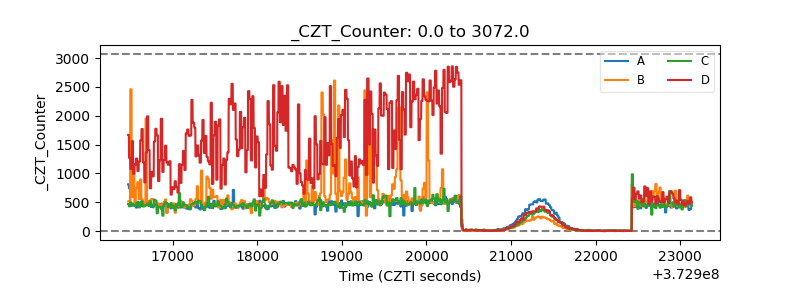 |
| +2.5 Volts monitor |  |
| +5 Volts monitor | 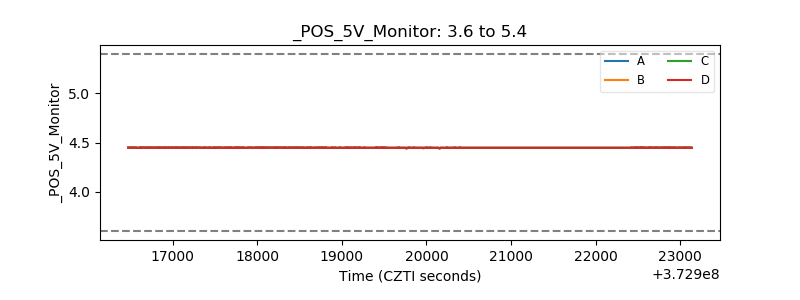 |
| _ROLL_ROT | 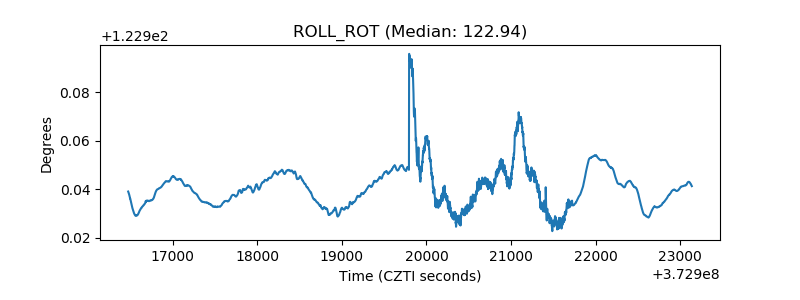 |
| _Roll_DEC | 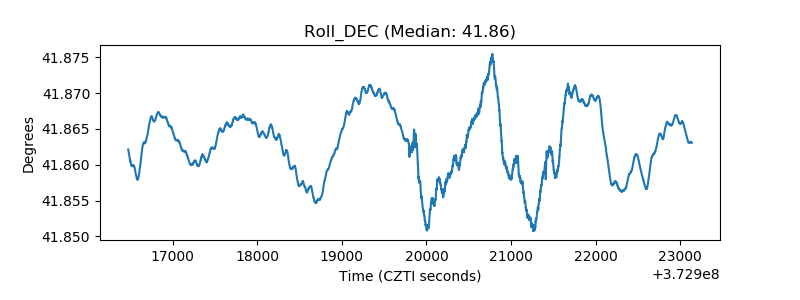 |
| _Roll_RA | 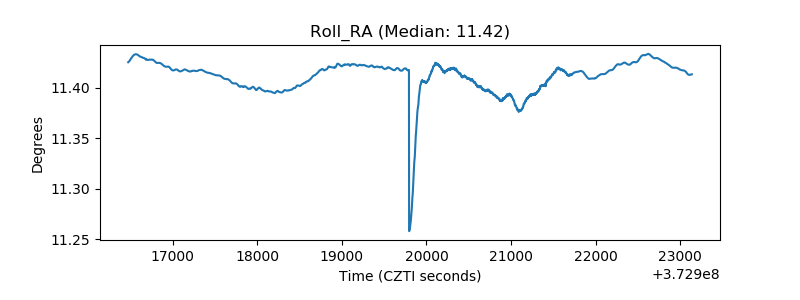 |
| Veto Counter | 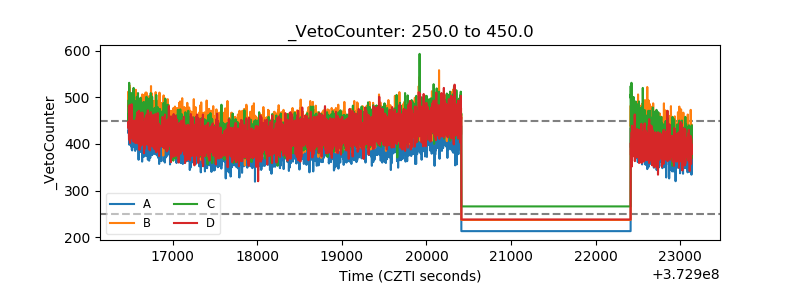 |