| Param | Original file | Final file |
|---|---|---|
| Filename | modeM0/AS1A11_005T04_9000004742_32862cztM0_level2.evt | modeM0/AS1A11_005T04_9000004742_32862cztM0_level2_quad_clean.evt |
| Size (bytes) | 484,488,000 | 57,896,640 |
| Size | 462.0 MB | 55.2 MB |
| Events in quadrant A | 2,530,674 | 360,292 |
| Events in quadrant B | 4,092,920 | 323,052 |
| Events in quadrant C | 2,726,891 | 357,876 |
| Events in quadrant D | 4,944,958 | 322,288 |
| Mode M9 | |||
|---|---|---|---|
| Quadrant | BADHDUFLAG | Total packets | Discarded packets |
| A | 0 | 37 | 0 |
| B | 0 | 37 | 0 |
| C | 0 | 37 | 0 |
| D | 0 | 37 | 0 |
| Mode M0 | |||
|---|---|---|---|
| Quadrant | BADHDUFLAG | Total packets | Discarded packets |
| A | 0 | 11149 | 3 |
| B | 0 | 15616 | 2 |
| C | 0 | 11642 | 2 |
| D | 0 | 18512 | 2 |
| Mode SS | |||
|---|---|---|---|
| Quadrant | BADHDUFLAG | Total packets | Discarded packets |
| A | 0 | 116 | 0 |
| B | 0 | 116 | 0 |
| C | 0 | 116 | 0 |
| D | 0 | 116 | 0 |
| Quadrant | Total seconds | Saturated seconds | Saturation percentage |
|---|---|---|---|
| A | 5557 | 4 | 0.071981% |
| B | 5557 | 605 | 10.887169% |
| C | 5557 | 31 | 0.557855% |
| D | 5557 | 268 | 4.822746% |
Noise dominated data is calculated using 1-second bins in cleaned event files. If a bin has >2000 counts, and if more than 50% of those come from <1% of pixels, then it is considered to be noise-dominated and hence unusable.
| Quadrant | # 1 sec bins | Bins with >0 counts | Bins with >2000 counts | High rate bins dominated by noise | Noise dominated (total time) | Noise dominated (detector-on time) | Marked lightcurve |
|---|---|---|---|---|---|---|---|
| A | 9233 | 5559 | 0 | 0 | 0.00% | 0.00% | 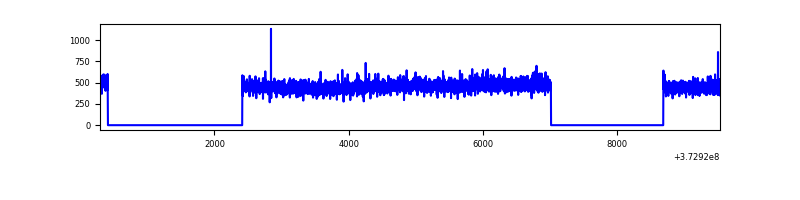 |
| B | 9233 | 5559 | 460 | 460 | 4.98% | 8.27% | 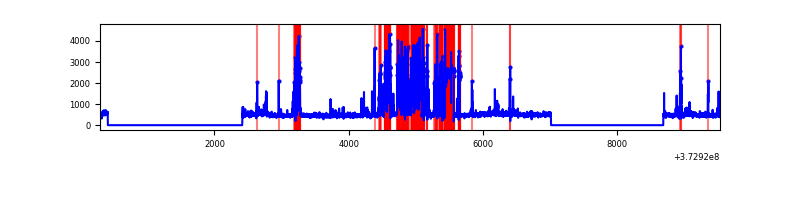 |
| C | 9233 | 5559 | 22 | 22 | 0.24% | 0.40% | 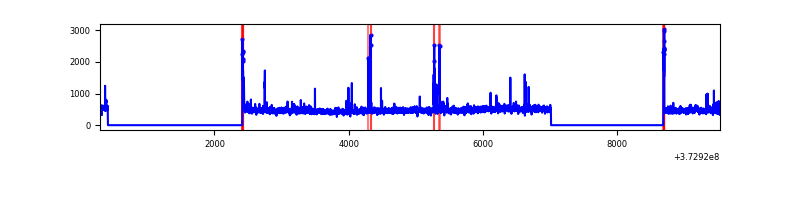 |
| D | 9233 | 5559 | 234 | 234 | 2.53% | 4.21% | 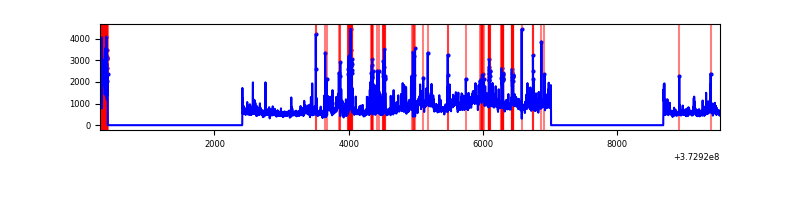 |
Top three noisy pixels from each quadrant. If the there are fewer than three noisy pixels in the level2.evt file, extra rows are filled as -1
| Pixel properties | Quadrant properties | ||||||
|---|---|---|---|---|---|---|---|
| Quadrant | DetID | PixID | Counts | Sigma | Mean | Median | Sigma |
| A | 13 | 254 | 10110 | 71.76 | 653 | 641 | 131.9 |
| A | 3 | 137 | 5851 | 39.49 | 653 | 641 | 131.9 |
| A | 0 | 226 | 5622 | 37.75 | 653 | 641 | 131.9 |
| B | 5 | 172 | 1489180 | 12706.68 | 616 | 601 | 117.1 |
| B | 0 | 197 | 59229 | 500.46 | 616 | 601 | 117.1 |
| B | 0 | 219 | 38935 | 327.22 | 616 | 601 | 117.1 |
| C | 1 | 241 | 60866 | 412.36 | 633 | 640 | 146.1 |
| C | 0 | 10 | 57068 | 386.36 | 633 | 640 | 146.1 |
| C | 3 | 233 | 49601 | 335.23 | 633 | 640 | 146.1 |
| D | 8 | 195 | 823570 | 5572.71 | 614 | 602 | 147.7 |
| D | 10 | 203 | 472144 | 3193.04 | 614 | 602 | 147.7 |
| D | 12 | 227 | 406875 | 2751.07 | 614 | 602 | 147.7 |
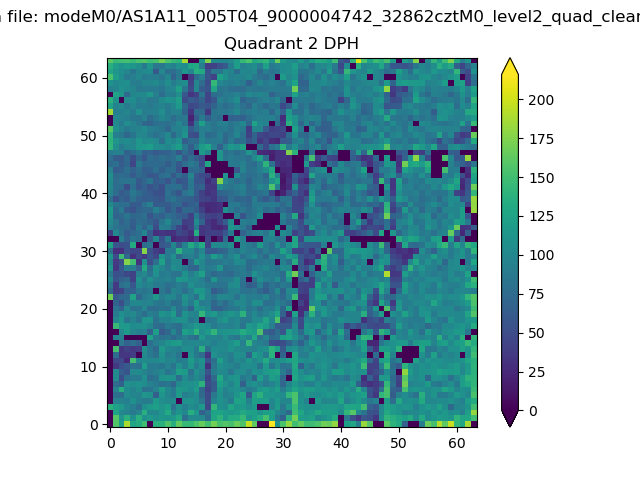
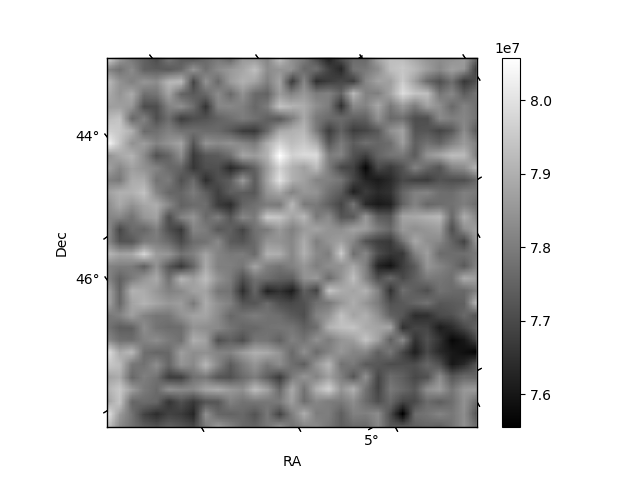
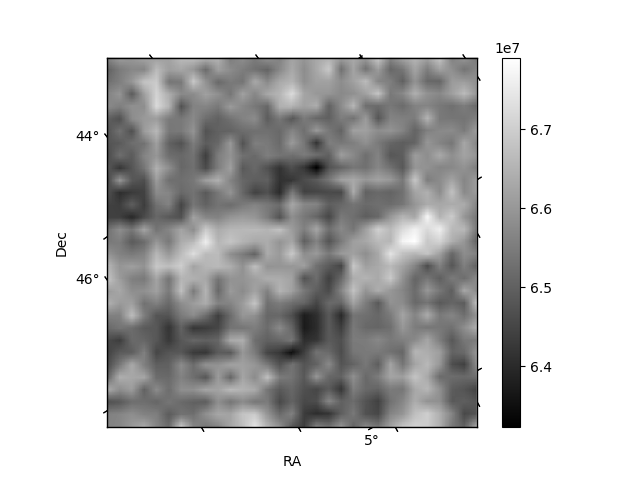
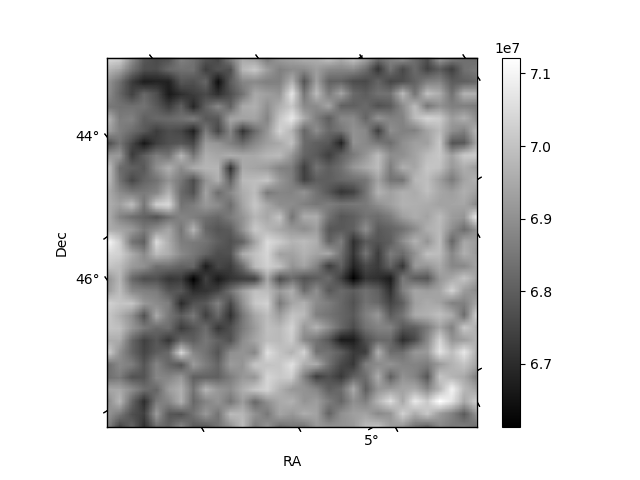
Histogram calculated using DETX and DETY for each event in the final _common_clean file
| Quadrant A | 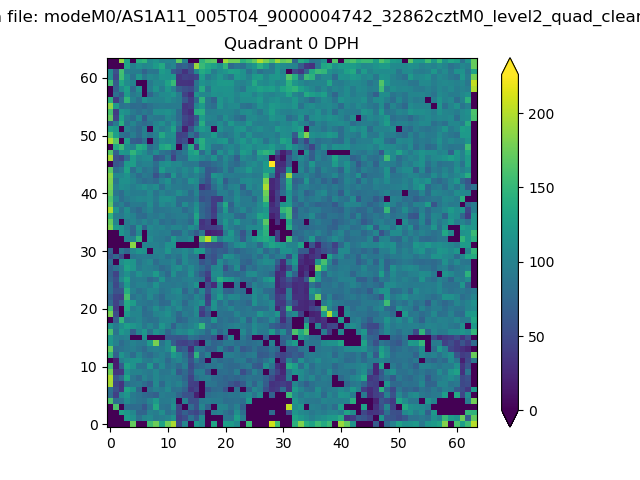 |
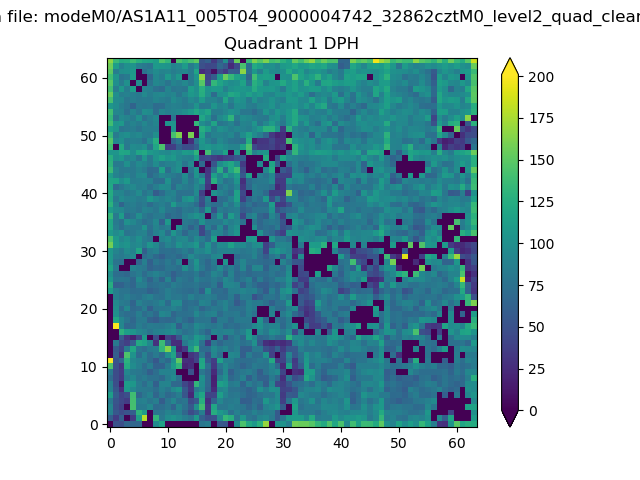 |
Quadrant B |
|---|---|---|---|
| Quadrant D | 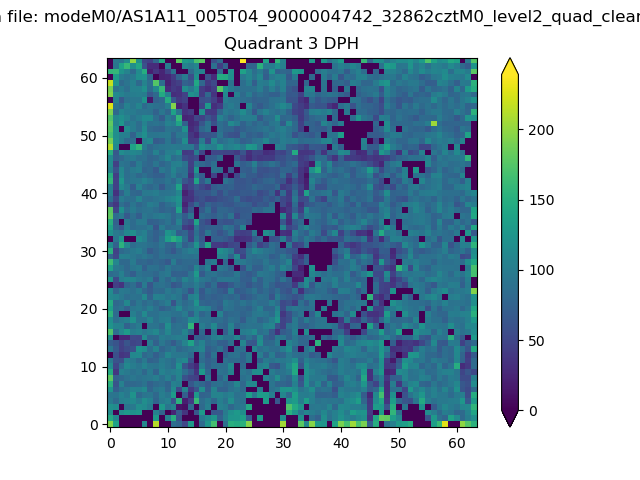 |
 |
Quadrant C |
| Plot type | Count rate plots | Images |
|---|---|---|
| Comparison with Poisson distribution Blue bars denote a histogram of data divided into 1 sec bins. Red curve is a Poisson curve with rate = median count rate of data. |
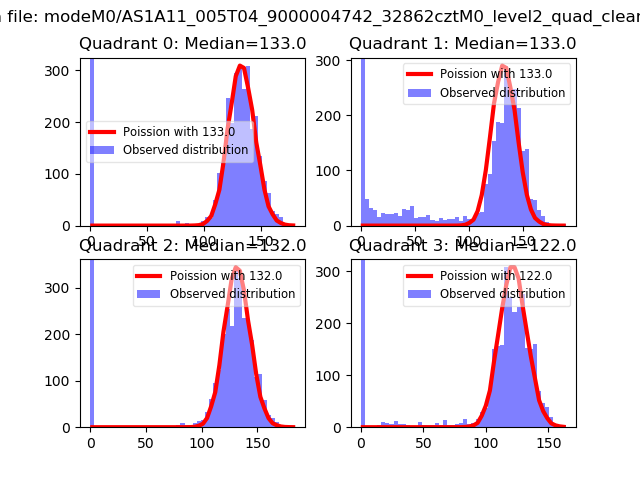 |
 |
| Quadrant-wise count rates Data is divided into 100 sec bins |
 |
|
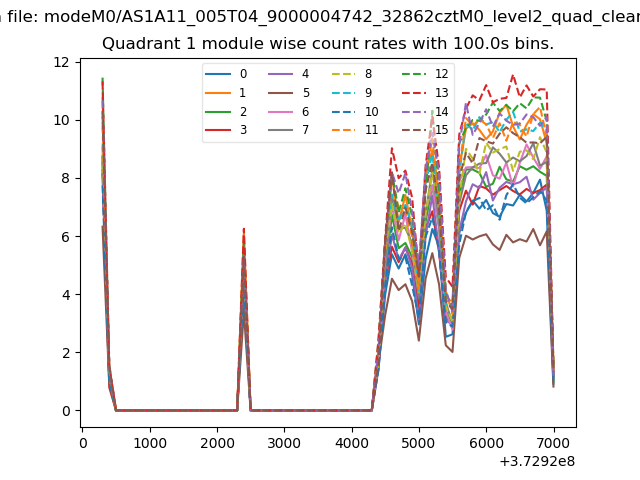
| Module-wise count rates for Quadrant A Data is divided into 100 sec bins |
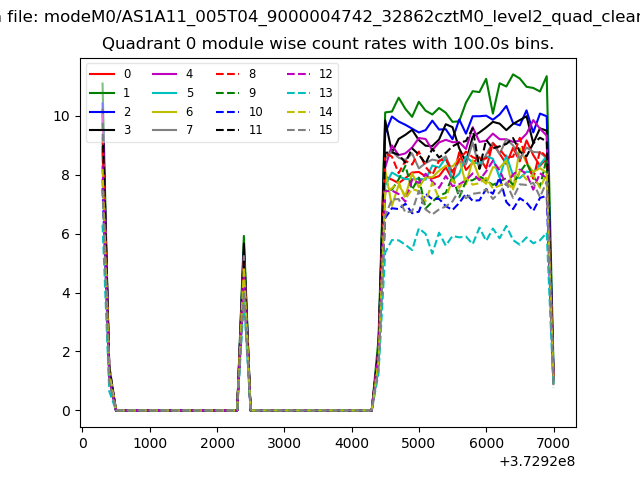 |
 |
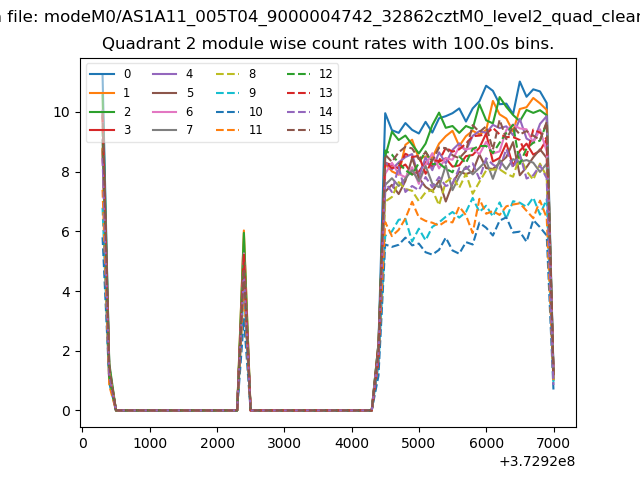
| Module-wise count rates for Quadrant B Data is divided into 100 sec bins |
 |
 |
| Module-wise count rates for Quadrant C Data is divided into 100 sec bins |
 |
 |
| Module-wise count rates for Quadrant D Data is divided into 100 sec bins |
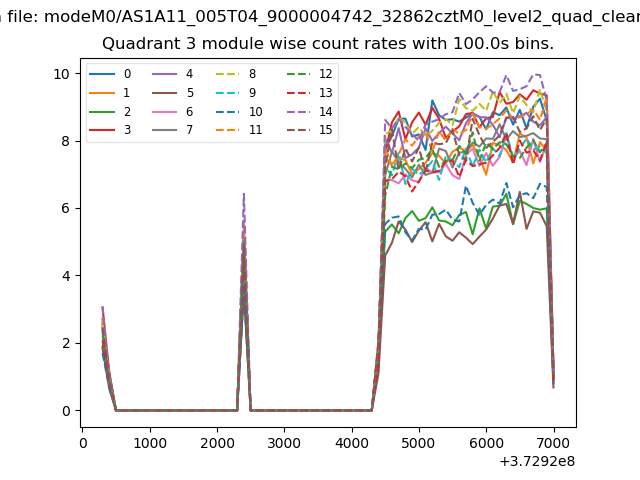 |
 |
| Parameter | Plot |
|---|---|
| CZT HV Monitor | 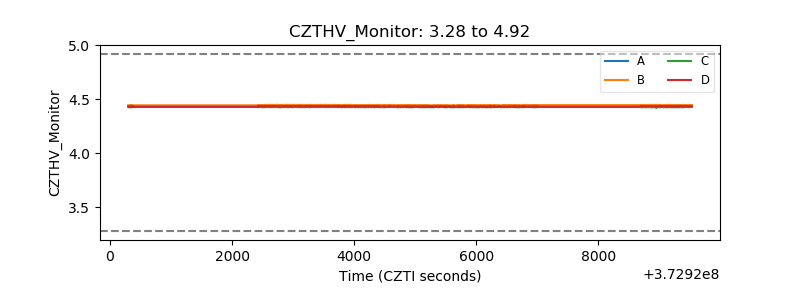 |
| D_VDD | 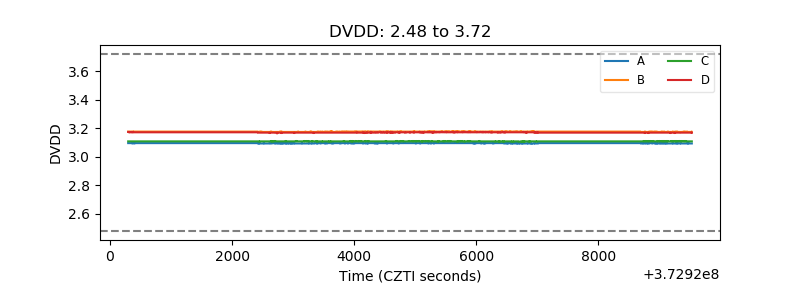 |
| Temperature 1 | 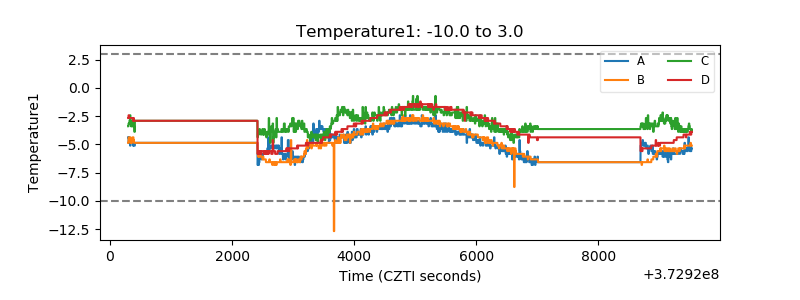 |
| Veto HV Monitor | 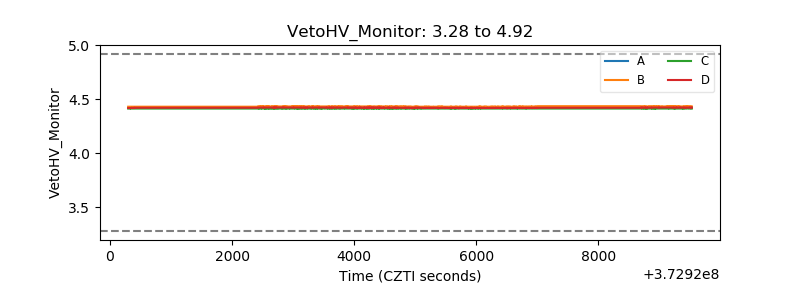 |
| Veto LLD | 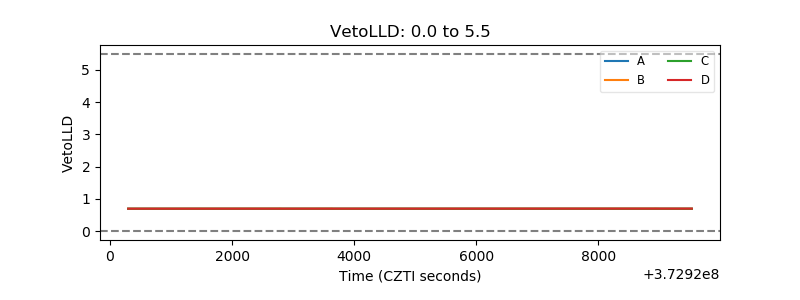 |
| Alpha Counter | 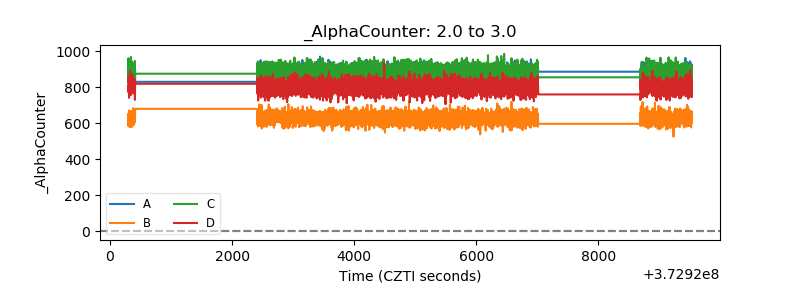 |
| _CPM_Rate | 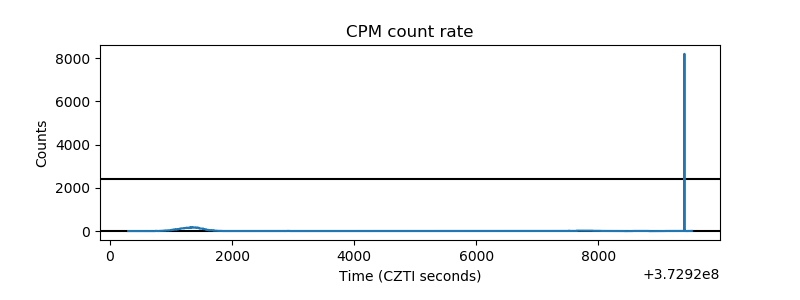 |
| CZT Counter | 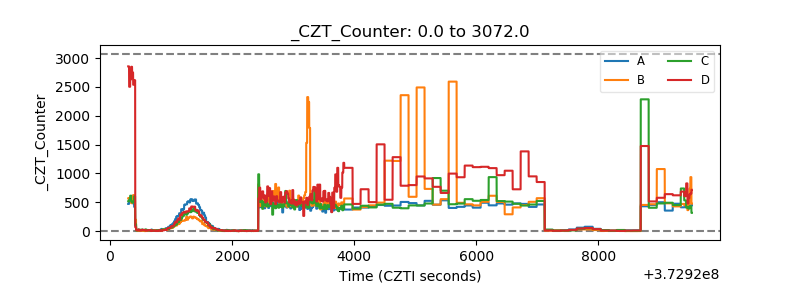 |
| +2.5 Volts monitor |  |
| +5 Volts monitor |  |
| _ROLL_ROT | 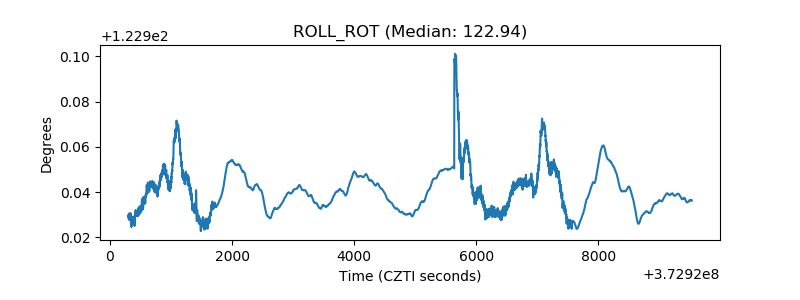 |
| _Roll_DEC | 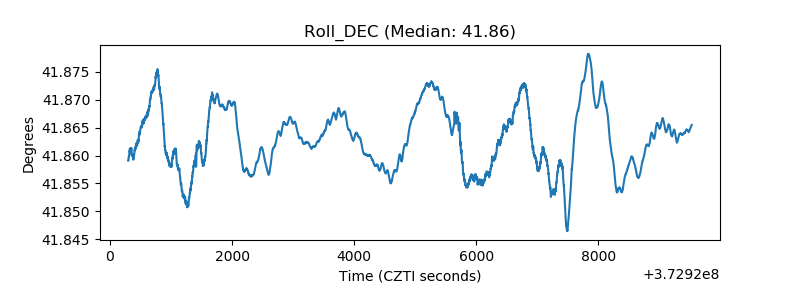 |
| _Roll_RA | 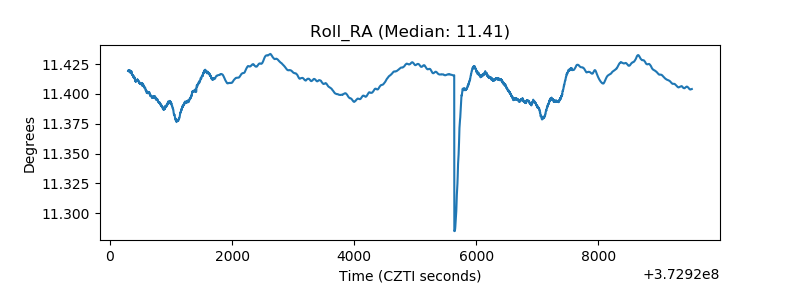 |
| Veto Counter | 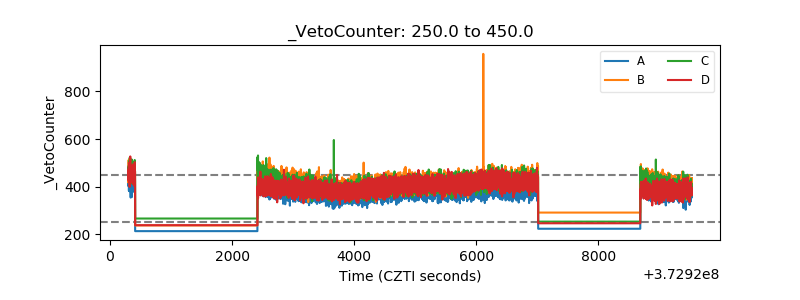 |