| Param | Original file | Final file |
|---|---|---|
| Filename | modeM0/AS1A11_005T04_9000004742_32863cztM0_level2.evt | modeM0/AS1A11_005T04_9000004742_32863cztM0_level2_quad_clean.evt |
| Size (bytes) | 485,827,200 | 66,401,280 |
| Size | 463.3 MB | 63.3 MB |
| Events in quadrant A | 2,599,613 | 415,297 |
| Events in quadrant B | 3,247,426 | 419,996 |
| Events in quadrant C | 2,875,428 | 414,416 |
| Events in quadrant D | 5,604,426 | 362,339 |
| Mode M9 | |||
|---|---|---|---|
| Quadrant | BADHDUFLAG | Total packets | Discarded packets |
| A | 0 | 22 | 0 |
| B | 0 | 22 | 0 |
| C | 0 | 22 | 0 |
| D | 0 | 23 | 0 |
| Mode M0 | |||
|---|---|---|---|
| Quadrant | BADHDUFLAG | Total packets | Discarded packets |
| A | 0 | 11518 | 3 |
| B | 0 | 13197 | 2 |
| C | 0 | 12147 | 2 |
| D | 0 | 20630 | 2 |
| Mode SS | |||
|---|---|---|---|
| Quadrant | BADHDUFLAG | Total packets | Discarded packets |
| A | 0 | 116 | 0 |
| B | 0 | 116 | 0 |
| C | 0 | 116 | 0 |
| D | 0 | 116 | 0 |
| Quadrant | Total seconds | Saturated seconds | Saturation percentage |
|---|---|---|---|
| A | 5695 | 15 | 0.263389% |
| B | 5695 | 113 | 1.984197% |
| C | 5695 | 29 | 0.509219% |
| D | 5695 | 509 | 8.937665% |
Noise dominated data is calculated using 1-second bins in cleaned event files. If a bin has >2000 counts, and if more than 50% of those come from <1% of pixels, then it is considered to be noise-dominated and hence unusable.
| Quadrant | # 1 sec bins | Bins with >0 counts | Bins with >2000 counts | High rate bins dominated by noise | Noise dominated (total time) | Noise dominated (detector-on time) | Marked lightcurve |
|---|---|---|---|---|---|---|---|
| A | 7098 | 5696 | 10 | 10 | 0.14% | 0.18% | 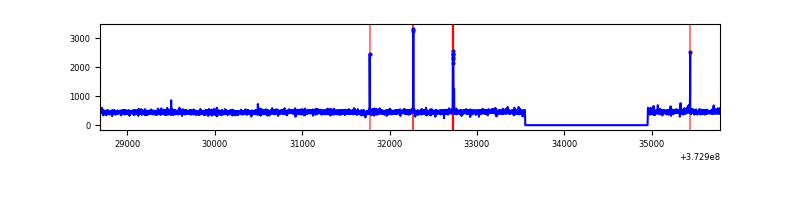 |
| B | 7098 | 5696 | 68 | 68 | 0.96% | 1.19% | 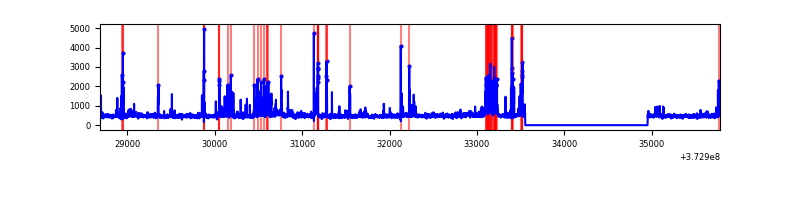 |
| C | 7098 | 5696 | 15 | 15 | 0.21% | 0.26% | 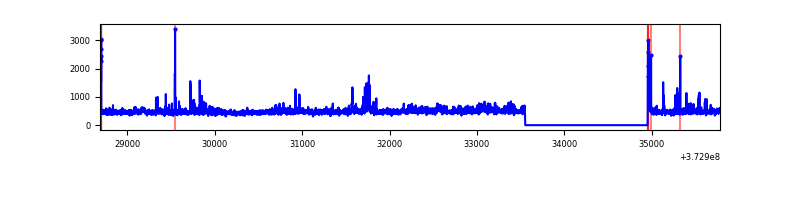 |
| D | 7098 | 5696 | 414 | 414 | 5.83% | 7.27% | 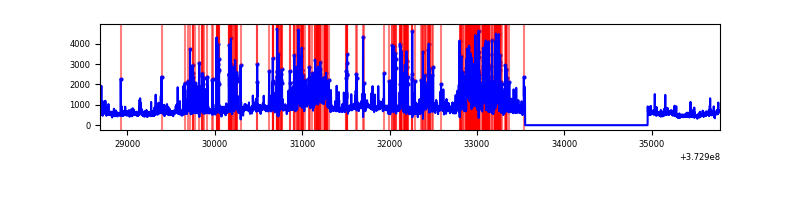 |
Top three noisy pixels from each quadrant. If the there are fewer than three noisy pixels in the level2.evt file, extra rows are filled as -1
| Pixel properties | Quadrant properties | ||||||
|---|---|---|---|---|---|---|---|
| Quadrant | DetID | PixID | Counts | Sigma | Mean | Median | Sigma |
| A | 13 | 210 | 18257 | 131.17 | 662 | 648 | 134.3 |
| A | 9 | 143 | 17587 | 126.17 | 662 | 648 | 134.3 |
| A | 13 | 254 | 9815 | 68.28 | 662 | 648 | 134.3 |
| B | 5 | 172 | 316385 | 2476.82 | 664 | 645 | 127.5 |
| B | 0 | 197 | 199377 | 1558.95 | 664 | 645 | 127.5 |
| B | 0 | 230 | 40623 | 313.6 | 664 | 645 | 127.5 |
| C | 14 | 67 | 117199 | 776.04 | 645 | 650 | 150.2 |
| C | 3 | 233 | 90532 | 598.48 | 645 | 650 | 150.2 |
| C | 0 | 10 | 79605 | 525.72 | 645 | 650 | 150.2 |
| D | 7 | 80 | 1349293 | 8971.2 | 616 | 603 | 150.3 |
| D | 8 | 195 | 792300 | 5266.2 | 616 | 603 | 150.3 |
| D | 10 | 203 | 439355 | 2918.49 | 616 | 603 | 150.3 |
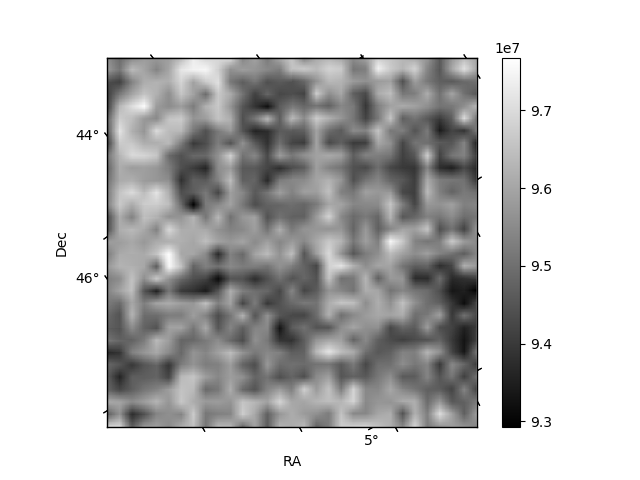
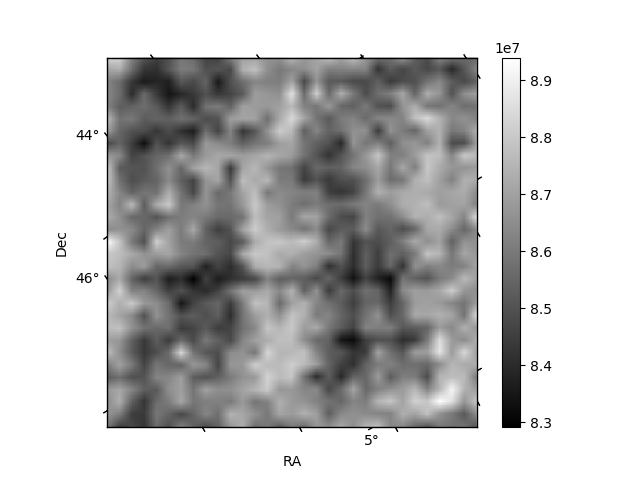
Histogram calculated using DETX and DETY for each event in the final _common_clean file
| Quadrant A | 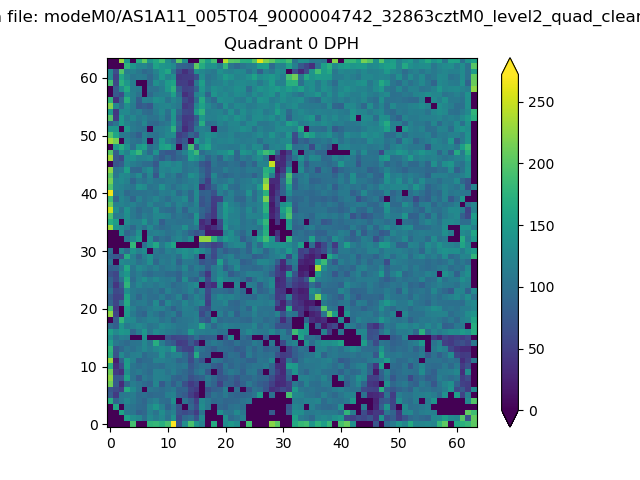 |
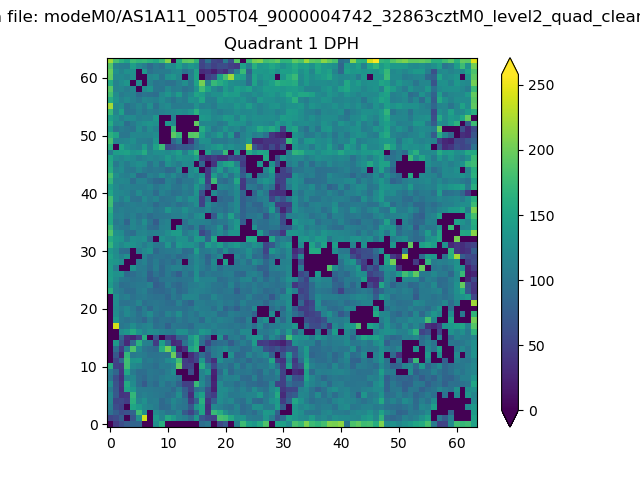 |
Quadrant B |
|---|---|---|---|
| Quadrant D | 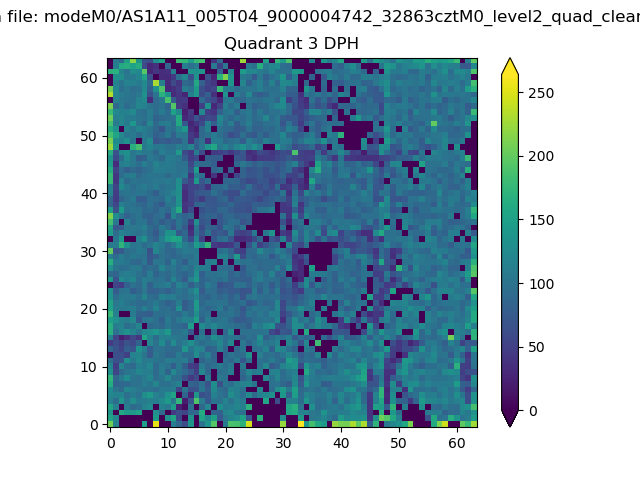 |
 |
Quadrant C |
| Plot type | Count rate plots | Images |
|---|---|---|
| Comparison with Poisson distribution Blue bars denote a histogram of data divided into 1 sec bins. Red curve is a Poisson curve with rate = median count rate of data. |
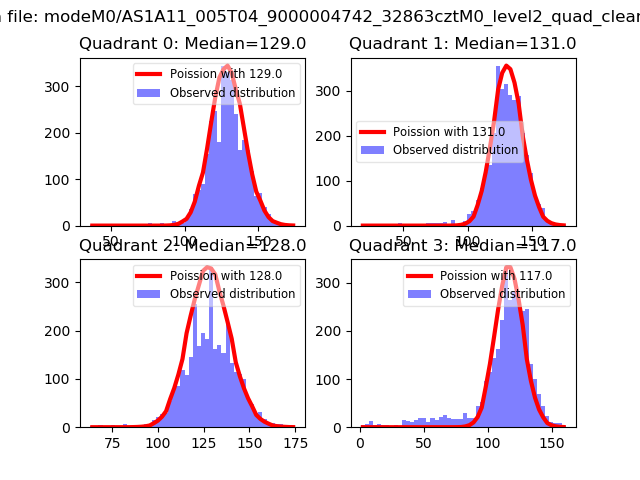 |
 |
| Quadrant-wise count rates Data is divided into 100 sec bins |
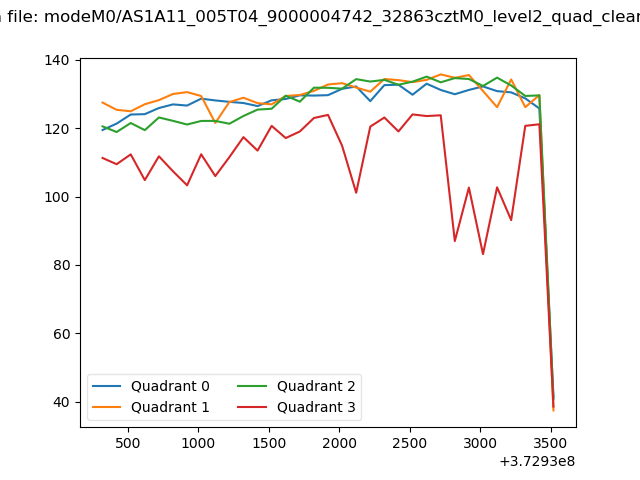 |
|
| Module-wise count rates for Quadrant A Data is divided into 100 sec bins |
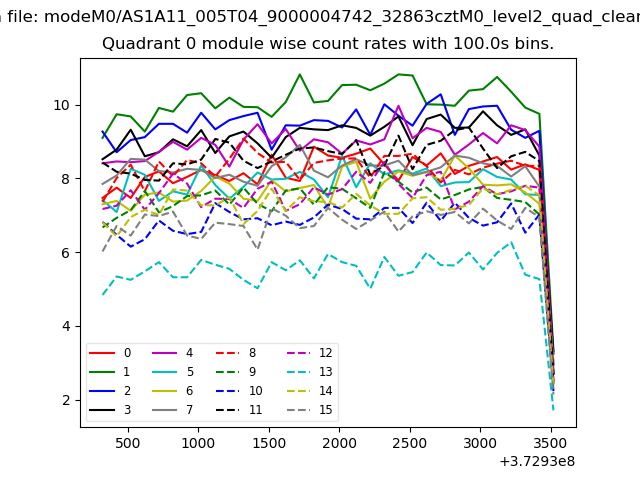 |
 |
| Module-wise count rates for Quadrant B Data is divided into 100 sec bins |
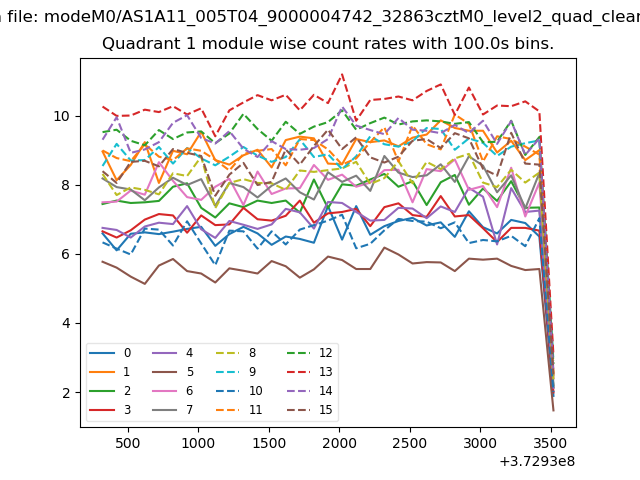 |
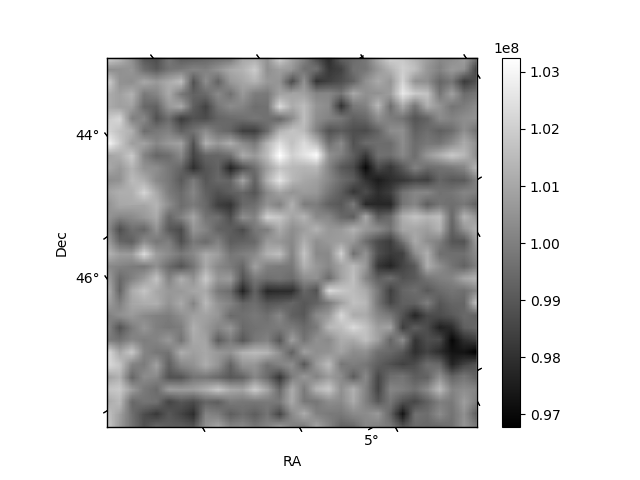 |
| Module-wise count rates for Quadrant C Data is divided into 100 sec bins |
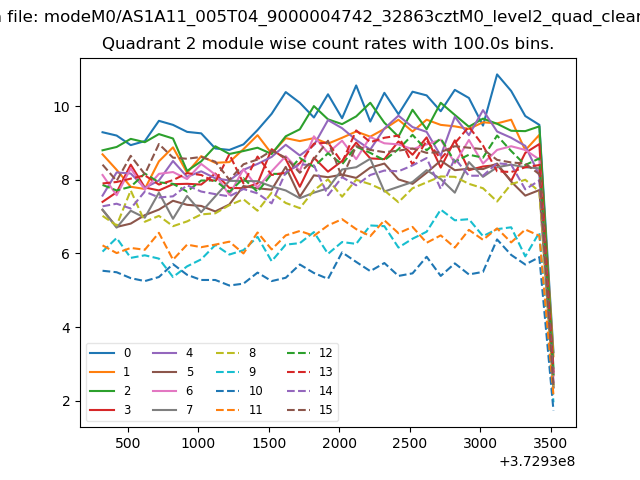 |
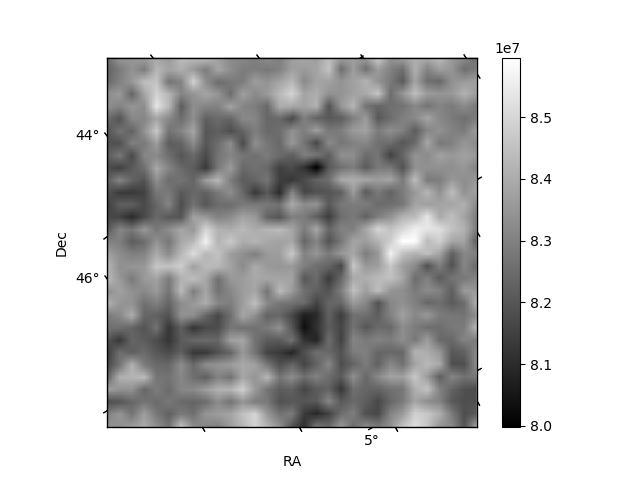 |
| Module-wise count rates for Quadrant D Data is divided into 100 sec bins |
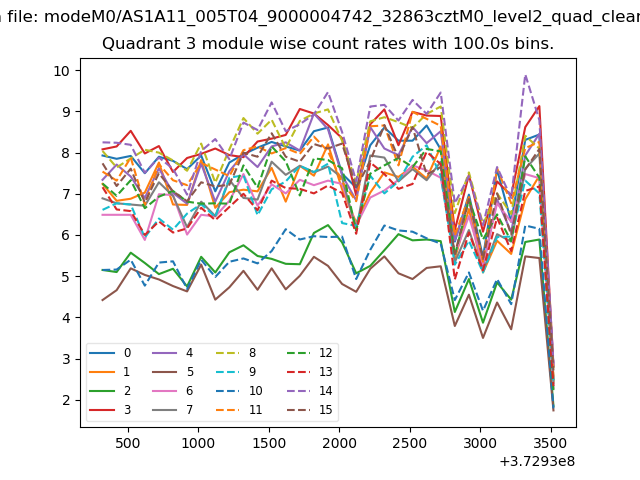 |
 |
| Parameter | Plot |
|---|---|
| CZT HV Monitor | 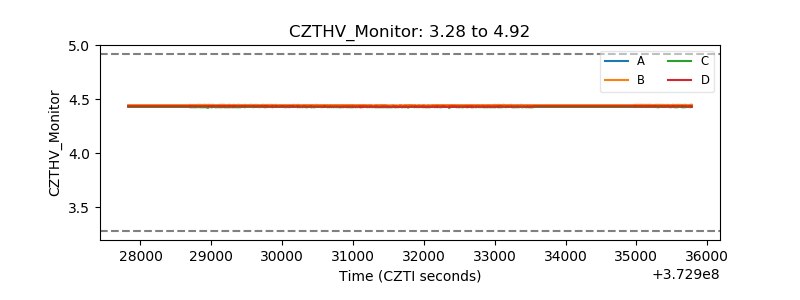 |
| D_VDD | 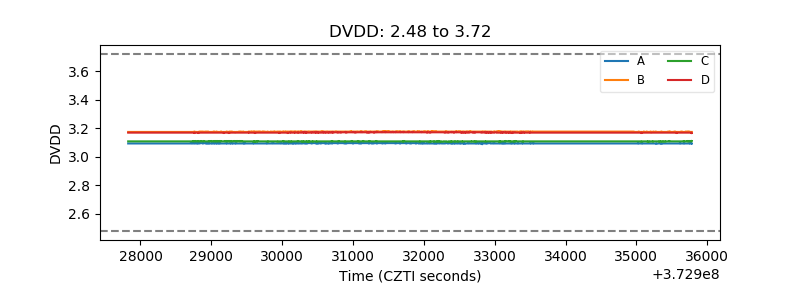 |
| Temperature 1 | 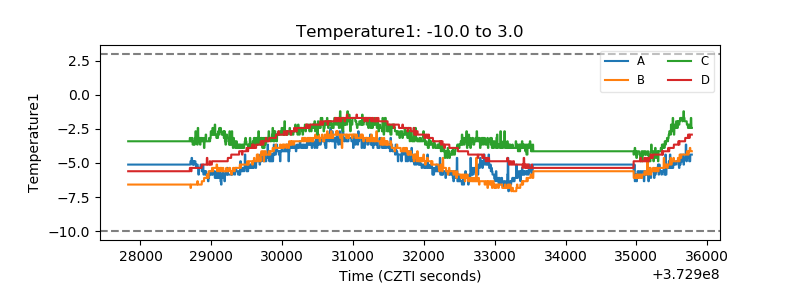 |
| Veto HV Monitor | 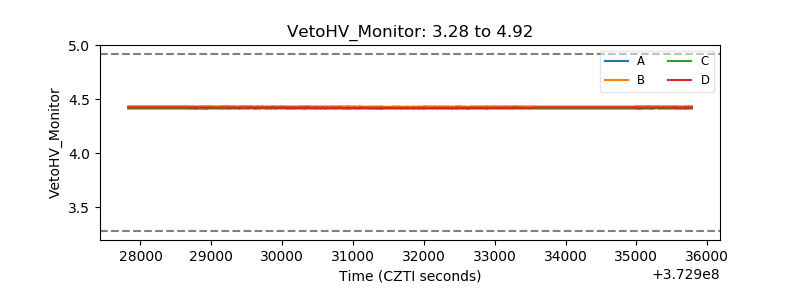 |
| Veto LLD | 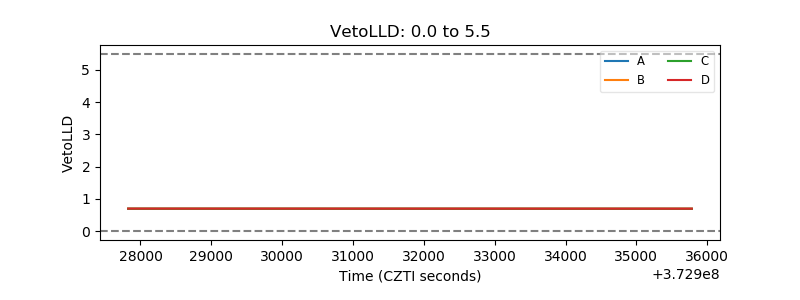 |
| Alpha Counter | 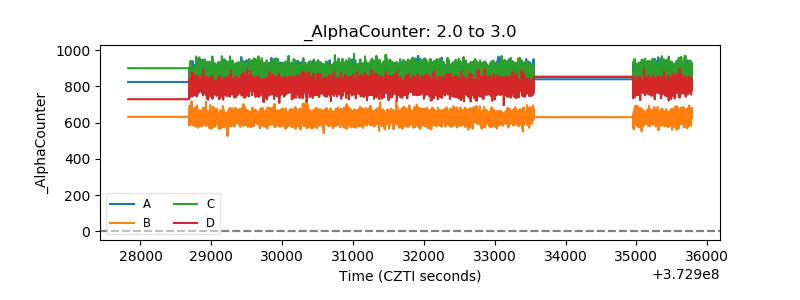 |
| _CPM_Rate | 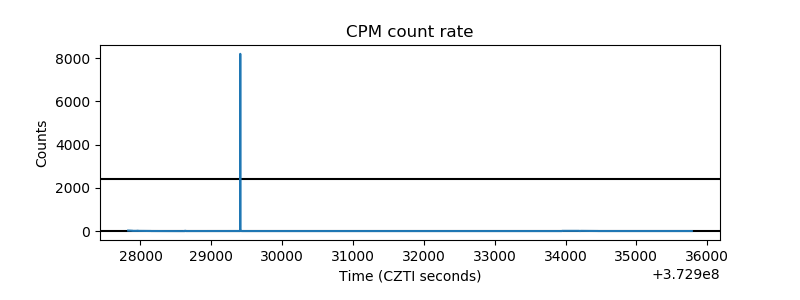 |
| CZT Counter |  |
| +2.5 Volts monitor |  |
| +5 Volts monitor |  |
| _ROLL_ROT | 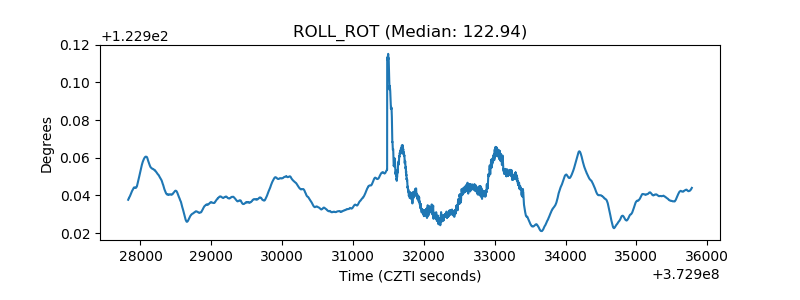 |
| _Roll_DEC | 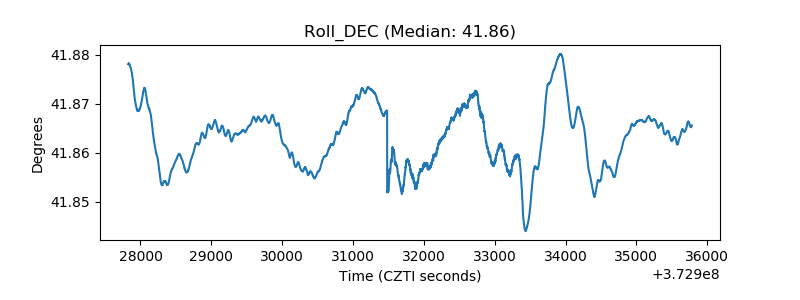 |
| _Roll_RA |  |
| Veto Counter | 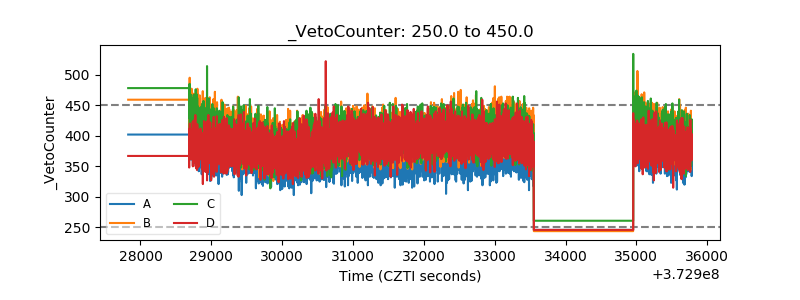 |