| Param | Original file | Final file |
|---|---|---|
| Filename | modeM0/AS1A11_005T04_9000004742_32868cztM0_level2.evt | modeM0/AS1A11_005T04_9000004742_32868cztM0_level2_quad_clean.evt |
| Size (bytes) | 2,082,456,000 | 362,329,920 |
| Size | 1.9 GB | 345.5 MB |
| Events in quadrant A | 12,349,332 | 2,367,079 |
| Events in quadrant B | 15,203,686 | 2,345,672 |
| Events in quadrant C | 12,158,252 | 2,393,140 |
| Events in quadrant D | 21,702,648 | 2,179,678 |
| Mode M9 | |||
|---|---|---|---|
| Quadrant | BADHDUFLAG | Total packets | Discarded packets |
| A | 0 | 85 | 0 |
| B | 0 | 85 | 0 |
| C | 0 | 85 | 0 |
| D | 0 | 85 | 0 |
| Mode M0 | |||
|---|---|---|---|
| Quadrant | BADHDUFLAG | Total packets | Discarded packets |
| A | 0 | 55331 | 2270 |
| B | 0 | 64236 | 3068 |
| C | 0 | 54526 | 2551 |
| D | 0 | 87399 | 5124 |
| Mode SS | |||
|---|---|---|---|
| Quadrant | BADHDUFLAG | Total packets | Discarded packets |
| A | 0 | 528 | 24 |
| B | 0 | 526 | 22 |
| C | 0 | 528 | 22 |
| D | 0 | 525 | 21 |
| Quadrant | Total seconds | Saturated seconds | Saturation percentage |
|---|---|---|---|
| A | 24589 | 157 | 0.638497% |
| B | 24545 | 1308 | 5.328988% |
| C | 24595 | 186 | 0.756251% |
| D | 24419 | 1344 | 5.503911% |
Noise dominated data is calculated using 1-second bins in cleaned event files. If a bin has >2000 counts, and if more than 50% of those come from <1% of pixels, then it is considered to be noise-dominated and hence unusable.
| Quadrant | # 1 sec bins | Bins with >0 counts | Bins with >2000 counts | High rate bins dominated by noise | Noise dominated (total time) | Noise dominated (detector-on time) | Marked lightcurve |
|---|---|---|---|---|---|---|---|
| A | 34320 | 24830 | 88 | 88 | 0.26% | 0.35% |  |
| B | 34320 | 24779 | 834 | 834 | 2.43% | 3.37% |  |
| C | 34320 | 24842 | 113 | 113 | 0.33% | 0.45% | 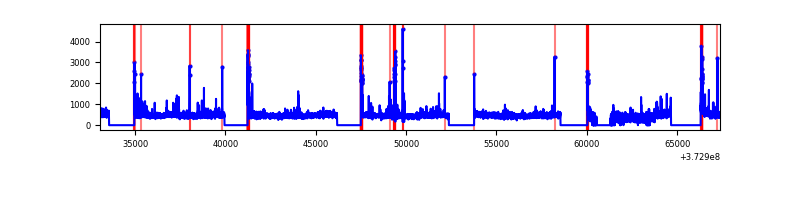 |
| D | 34320 | 24711 | 1046 | 1046 | 3.05% | 4.23% |  |
Top three noisy pixels from each quadrant. If the there are fewer than three noisy pixels in the level2.evt file, extra rows are filled as -1
| Pixel properties | Quadrant properties | ||||||
|---|---|---|---|---|---|---|---|
| Quadrant | DetID | PixID | Counts | Sigma | Mean | Median | Sigma |
| A | 14 | 63 | 1330096 | 2361.71 | 2829 | 2771 | 562.0 |
| A | 13 | 6 | 51168 | 86.11 | 2829 | 2771 | 562.0 |
| A | 13 | 254 | 45287 | 75.65 | 2829 | 2771 | 562.0 |
| B | 5 | 172 | 3053310 | 5802.8 | 2783 | 2706 | 525.7 |
| B | 0 | 197 | 428704 | 810.33 | 2783 | 2706 | 525.7 |
| B | 15 | 85 | 338068 | 637.92 | 2783 | 2706 | 525.7 |
| C | 0 | 10 | 498865 | 782.88 | 2780 | 2812 | 633.6 |
| C | 14 | 67 | 314163 | 491.38 | 2780 | 2812 | 633.6 |
| C | 3 | 233 | 220166 | 343.03 | 2780 | 2812 | 633.6 |
| D | 8 | 195 | 4003953 | 6233.7 | 2670 | 2612 | 641.9 |
| D | 10 | 203 | 1860056 | 2893.72 | 2670 | 2612 | 641.9 |
| D | 12 | 6 | 1532764 | 2383.83 | 2670 | 2612 | 641.9 |
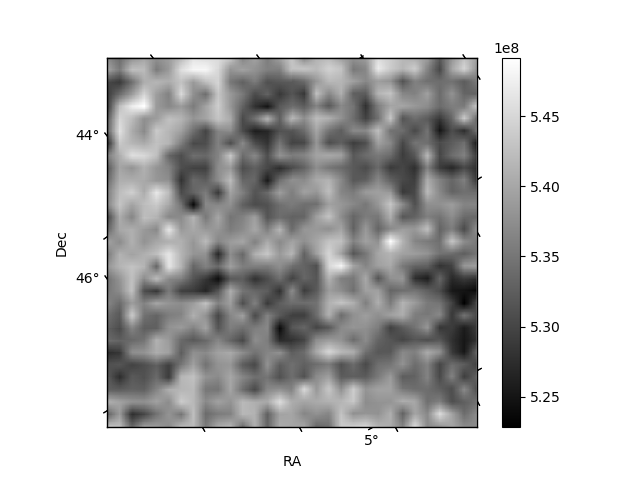
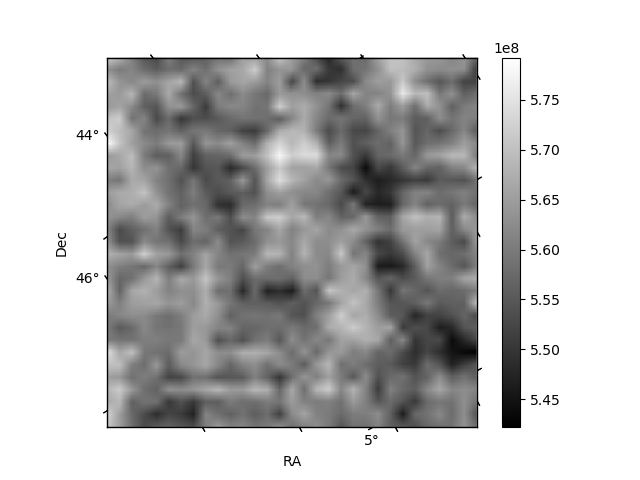
Histogram calculated using DETX and DETY for each event in the final _common_clean file
| Quadrant A | 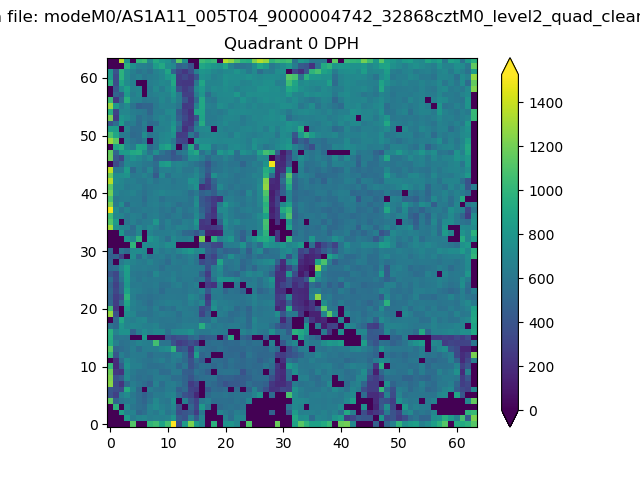 |
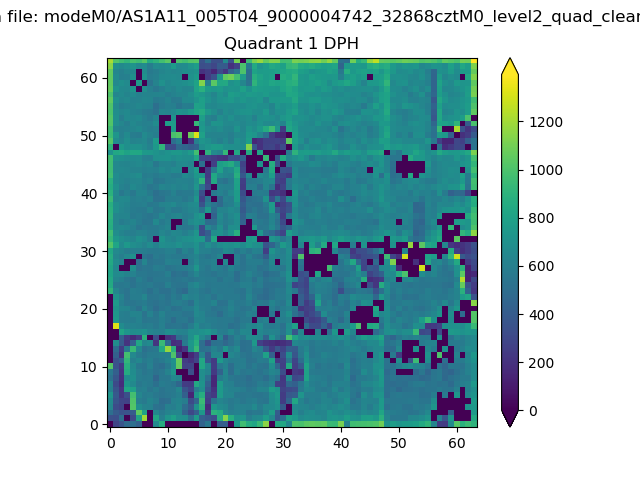 |
Quadrant B |
|---|---|---|---|
| Quadrant D | 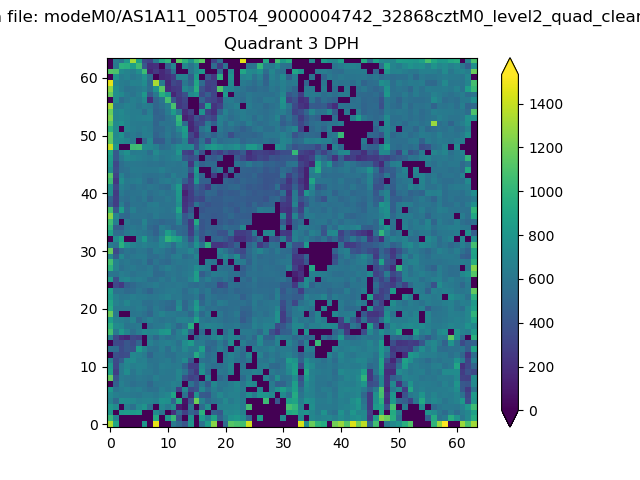 |
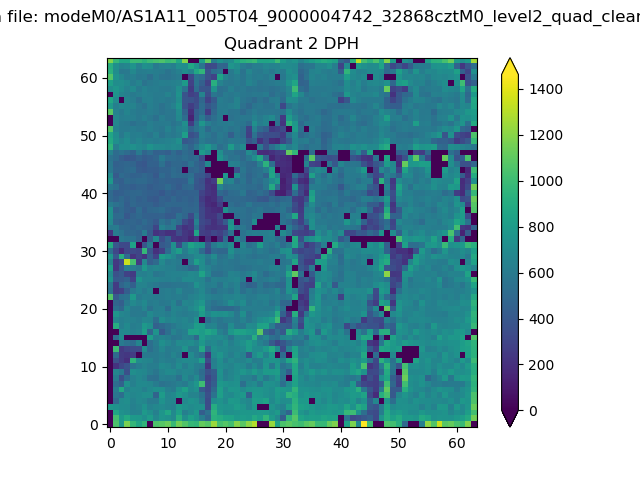 |
Quadrant C |
| Plot type | Count rate plots | Images |
|---|---|---|
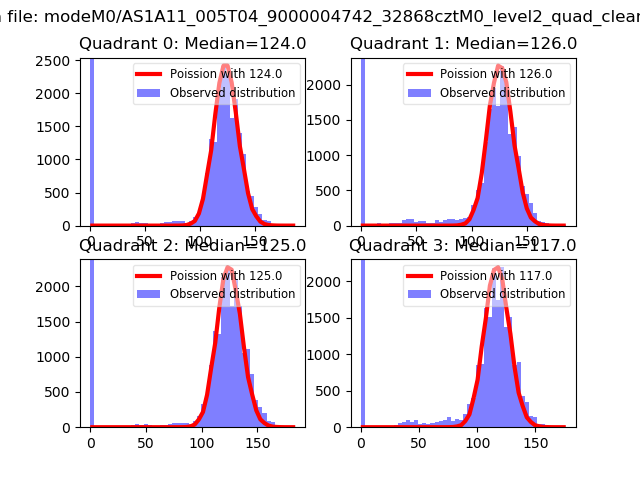
| Comparison with Poisson distribution Blue bars denote a histogram of data divided into 1 sec bins. Red curve is a Poisson curve with rate = median count rate of data. |
 |
 |
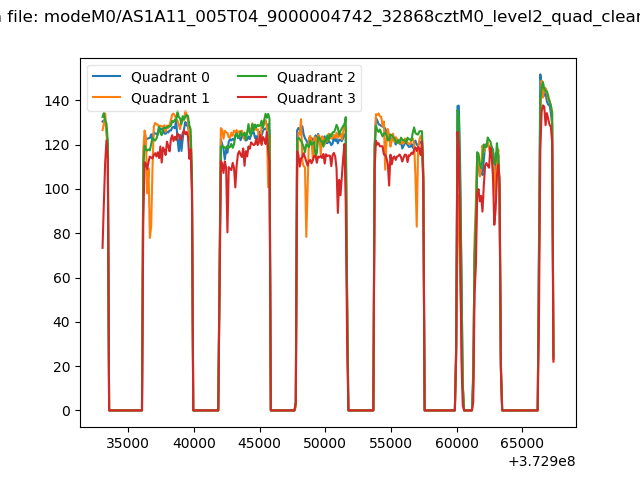
| Quadrant-wise count rates Data is divided into 100 sec bins |
 |
|
| Module-wise count rates for Quadrant A Data is divided into 100 sec bins |
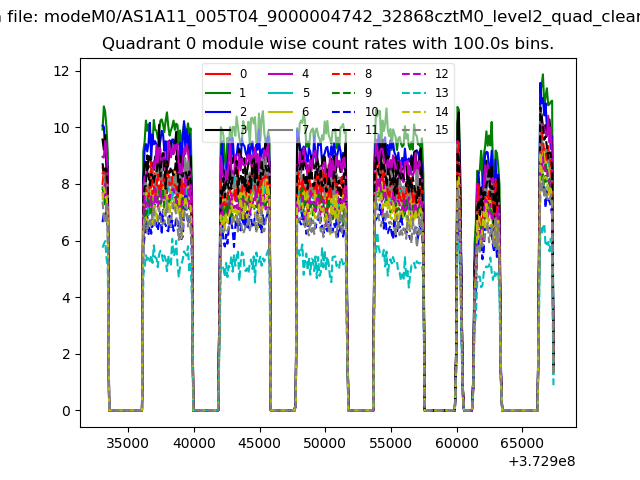 |
 |
| Module-wise count rates for Quadrant B Data is divided into 100 sec bins |
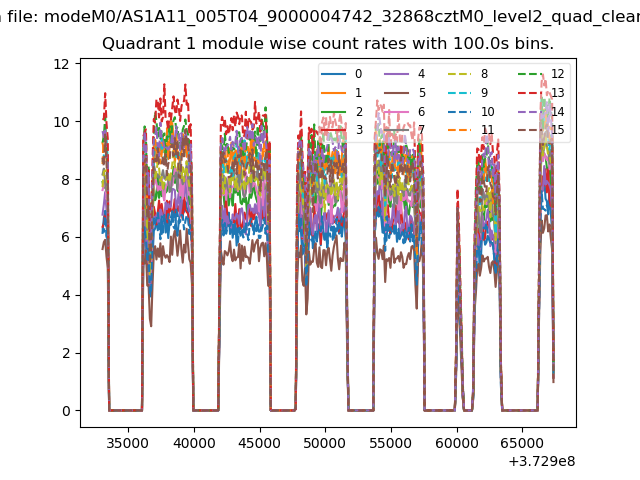 |
 |
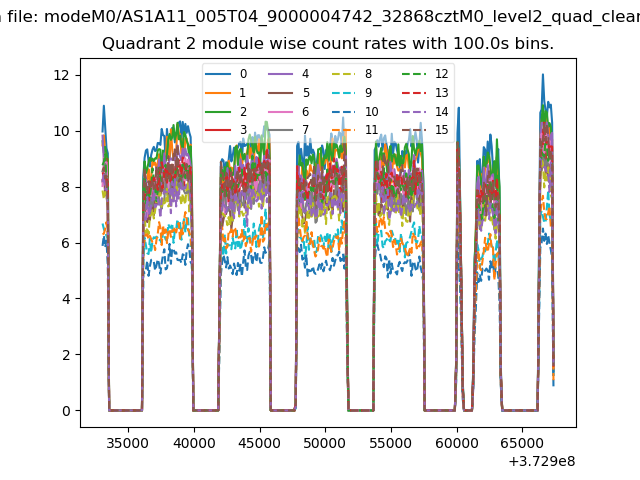
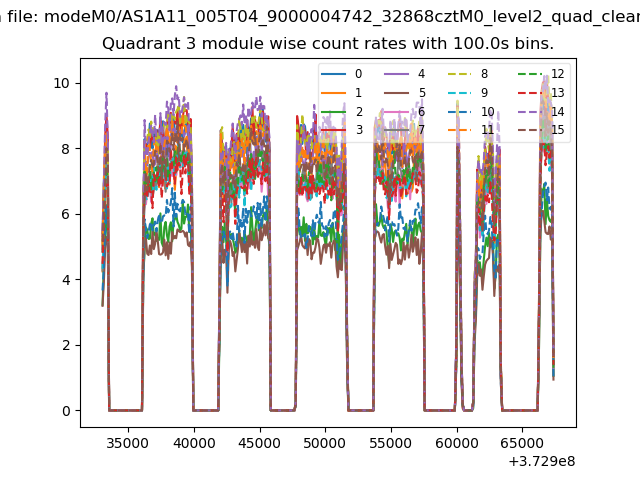
| Module-wise count rates for Quadrant C Data is divided into 100 sec bins |
 |
 |
| Module-wise count rates for Quadrant D Data is divided into 100 sec bins |
 |
 |
| Parameter | Plot |
|---|---|
| CZT HV Monitor | 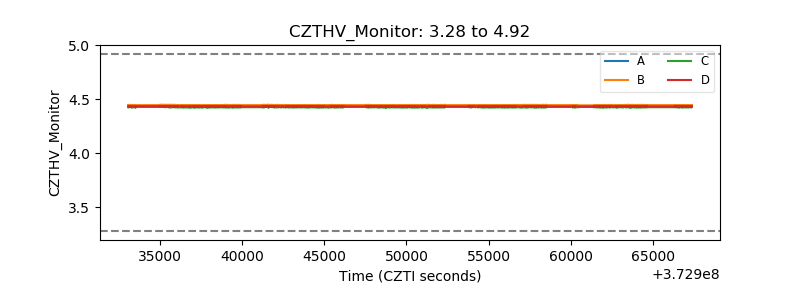 |
| D_VDD | 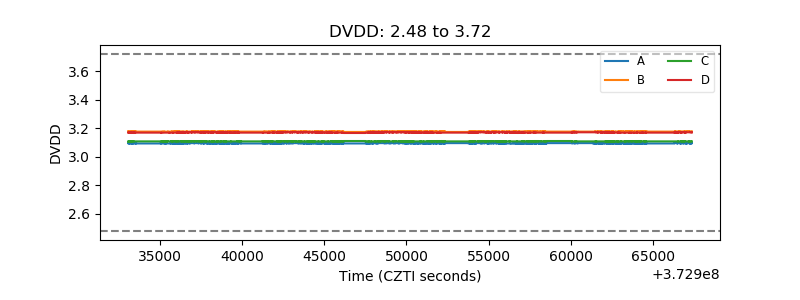 |
| Temperature 1 | 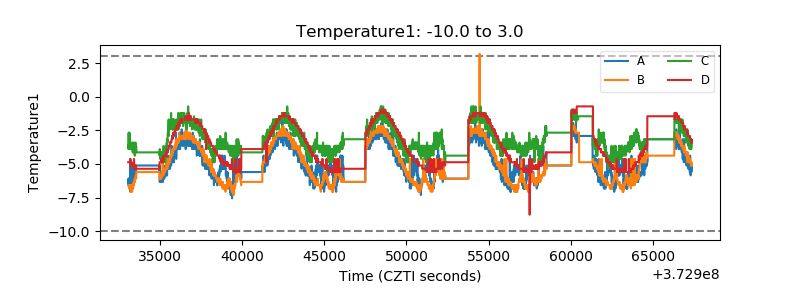 |
| Veto HV Monitor | 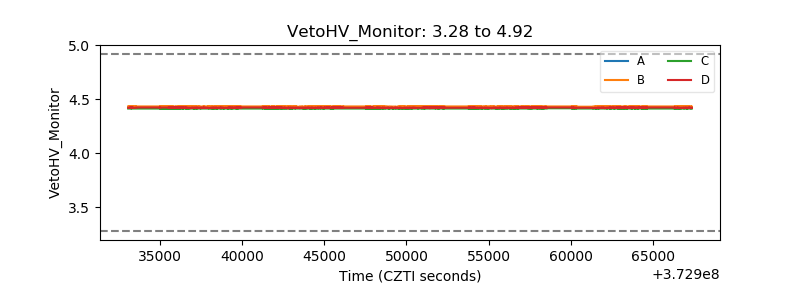 |
| Veto LLD | 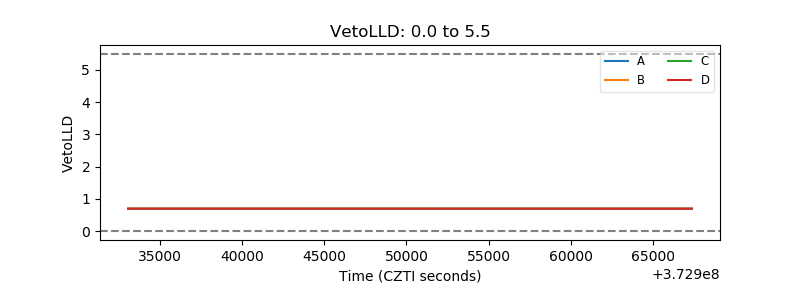 |
| Alpha Counter | 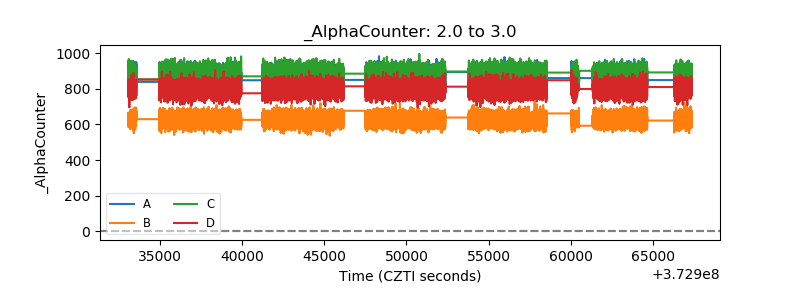 |
| _CPM_Rate | 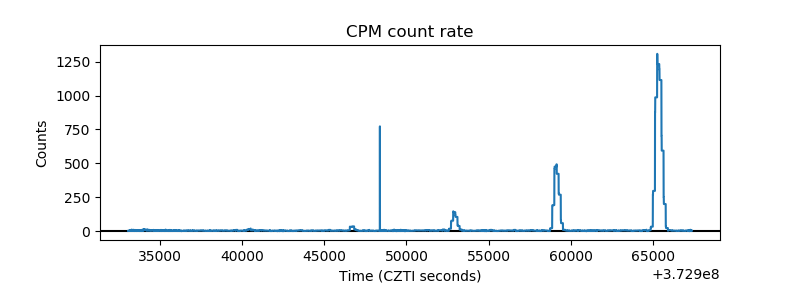 |
| CZT Counter | 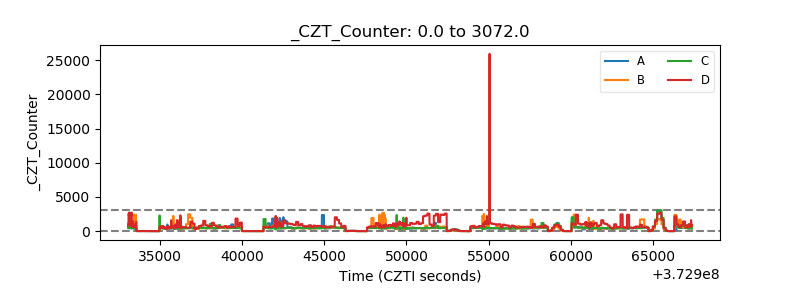 |
| +2.5 Volts monitor | 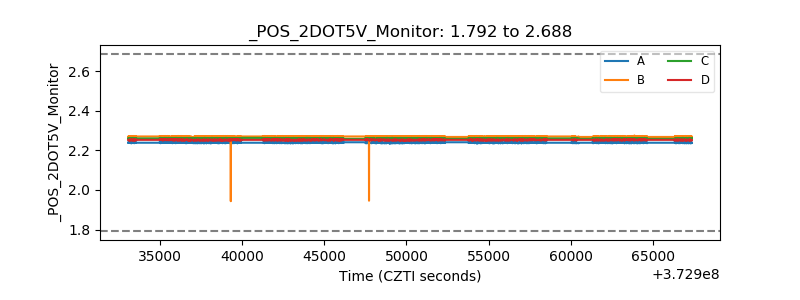 |
| +5 Volts monitor | 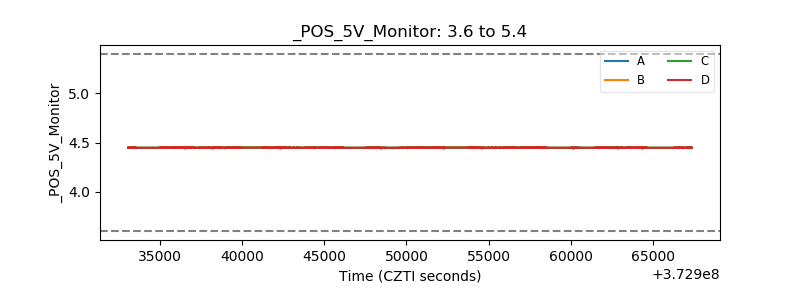 |
| _ROLL_ROT | 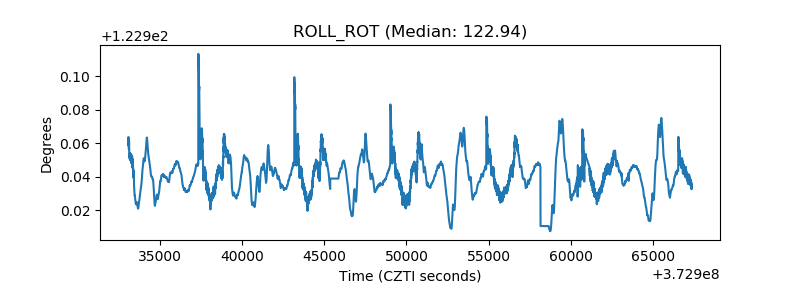 |
| _Roll_DEC | 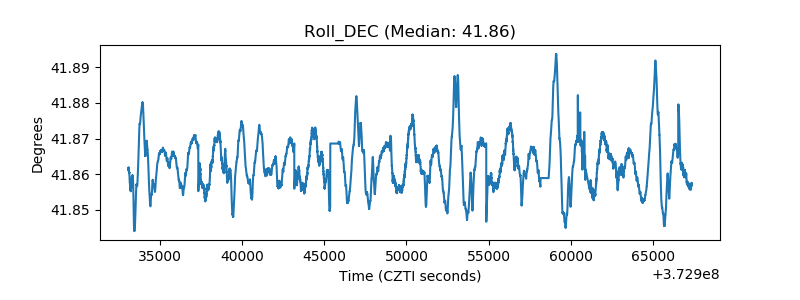 |
| _Roll_RA | 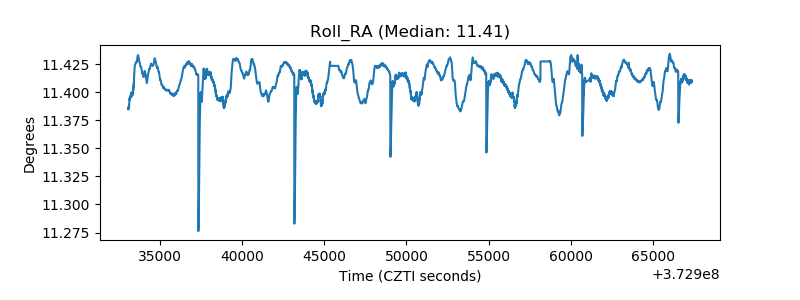 |
| Veto Counter | 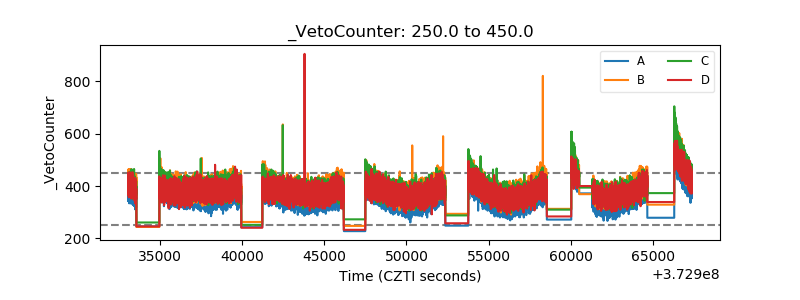 |