| Param | Original file | Final file |
|---|---|---|
| Filename | modeM0/AS1A11_005T04_9000004742_32870cztM0_level2.evt | modeM0/AS1A11_005T04_9000004742_32870cztM0_level2_quad_clean.evt |
| Size (bytes) | 471,153,600 | 79,185,600 |
| Size | 449.3 MB | 75.5 MB |
| Events in quadrant A | 2,498,142 | 511,980 |
| Events in quadrant B | 3,079,738 | 516,668 |
| Events in quadrant C | 2,728,517 | 525,237 |
| Events in quadrant D | 5,598,982 | 468,649 |
| Mode M9 | |||
|---|---|---|---|
| Quadrant | BADHDUFLAG | Total packets | Discarded packets |
| A | 0 | 30 | 0 |
| B | 0 | 30 | 0 |
| C | 0 | 30 | 0 |
| D | 0 | 31 | 0 |
| Mode M0 | |||
|---|---|---|---|
| Quadrant | BADHDUFLAG | Total packets | Discarded packets |
| A | 0 | 10955 | 3 |
| B | 0 | 12627 | 2 |
| C | 0 | 11599 | 2 |
| D | 0 | 20460 | 2 |
| Mode SS | |||
|---|---|---|---|
| Quadrant | BADHDUFLAG | Total packets | Discarded packets |
| A | 0 | 110 | 0 |
| B | 0 | 110 | 0 |
| C | 0 | 110 | 0 |
| D | 0 | 110 | 0 |
| Quadrant | Total seconds | Saturated seconds | Saturation percentage |
|---|---|---|---|
| A | 5357 | 7 | 0.130670% |
| B | 5357 | 148 | 2.762740% |
| C | 5357 | 32 | 0.597349% |
| D | 5357 | 333 | 6.216166% |
Noise dominated data is calculated using 1-second bins in cleaned event files. If a bin has >2000 counts, and if more than 50% of those come from <1% of pixels, then it is considered to be noise-dominated and hence unusable.
| Quadrant | # 1 sec bins | Bins with >0 counts | Bins with >2000 counts | High rate bins dominated by noise | Noise dominated (total time) | Noise dominated (detector-on time) | Marked lightcurve |
|---|---|---|---|---|---|---|---|
| A | 7121 | 5358 | 1 | 1 | 0.01% | 0.02% | 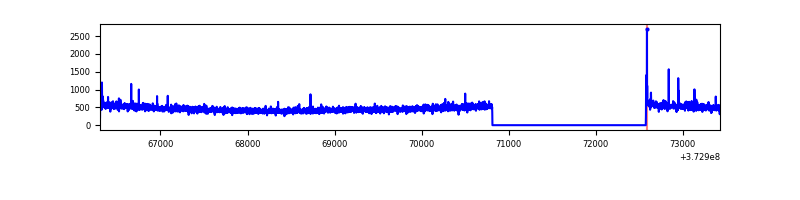 |
| B | 7121 | 5358 | 93 | 93 | 1.31% | 1.74% | 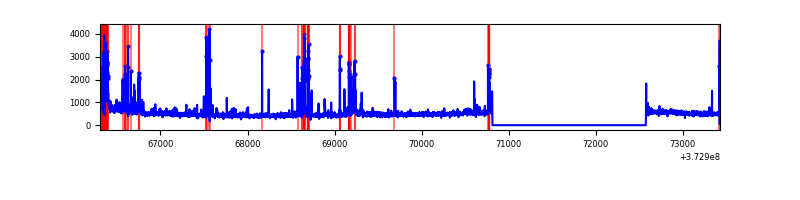 |
| C | 7121 | 5358 | 19 | 19 | 0.27% | 0.35% | 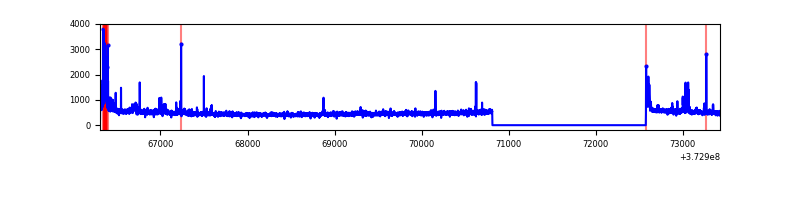 |
| D | 7121 | 5358 | 299 | 299 | 4.20% | 5.58% | 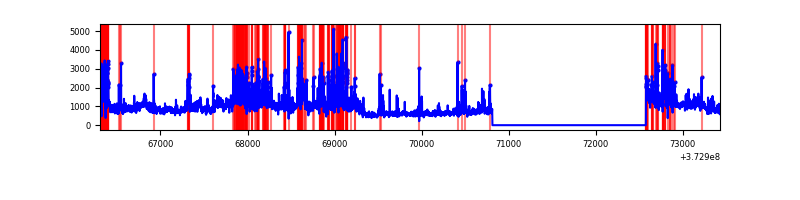 |
Top three noisy pixels from each quadrant. If the there are fewer than three noisy pixels in the level2.evt file, extra rows are filled as -1
| Pixel properties | Quadrant properties | ||||||
|---|---|---|---|---|---|---|---|
| Quadrant | DetID | PixID | Counts | Sigma | Mean | Median | Sigma |
| A | 14 | 63 | 36206 | 282.98 | 630 | 620 | 125.8 |
| A | 13 | 6 | 16463 | 125.98 | 630 | 620 | 125.8 |
| A | 13 | 254 | 9835 | 73.28 | 630 | 620 | 125.8 |
| B | 5 | 172 | 398928 | 3376.03 | 629 | 613 | 118.0 |
| B | 15 | 85 | 92580 | 779.49 | 629 | 613 | 118.0 |
| B | 0 | 230 | 41153 | 343.61 | 629 | 613 | 118.0 |
| C | 0 | 10 | 129472 | 896.49 | 625 | 632 | 143.7 |
| C | 3 | 233 | 45158 | 309.82 | 625 | 632 | 143.7 |
| C | 14 | 67 | 39978 | 273.78 | 625 | 632 | 143.7 |
| D | 8 | 195 | 1439014 | 9625.54 | 602 | 589 | 149.4 |
| D | 10 | 203 | 545135 | 3643.95 | 602 | 589 | 149.4 |
| D | 12 | 218 | 389891 | 2605.1 | 602 | 589 | 149.4 |
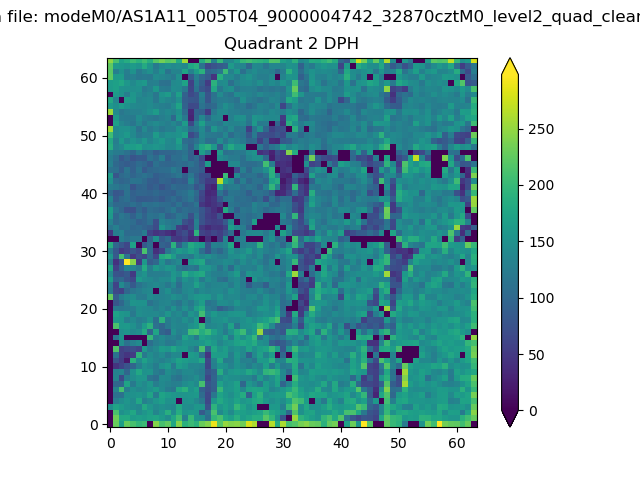
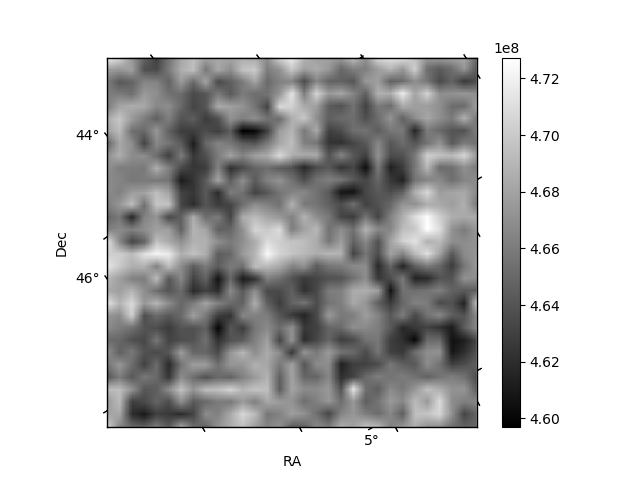
Histogram calculated using DETX and DETY for each event in the final _common_clean file
| Quadrant A | 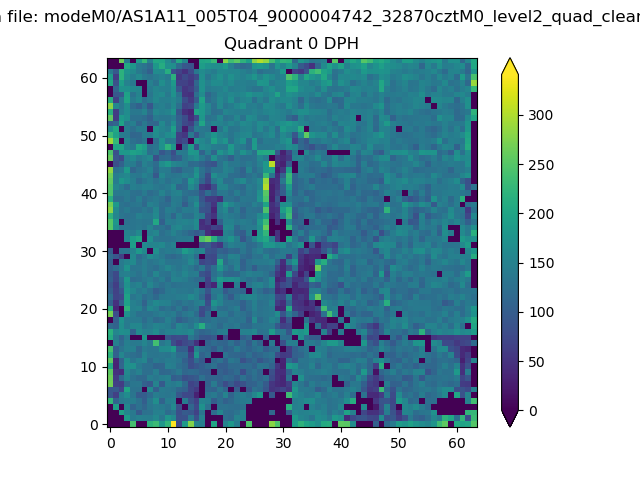 |
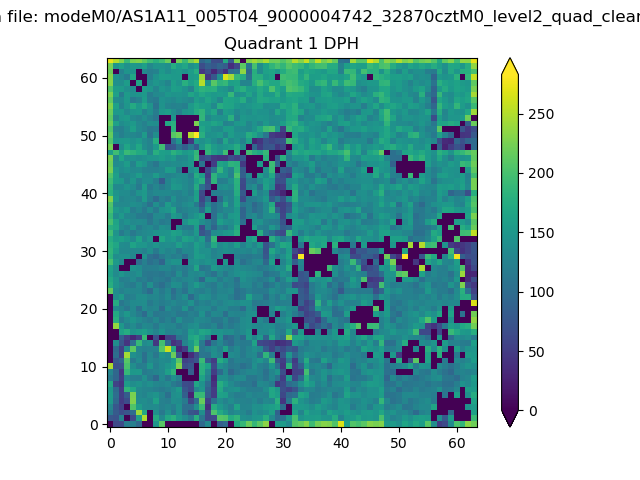 |
Quadrant B |
|---|---|---|---|
| Quadrant D | 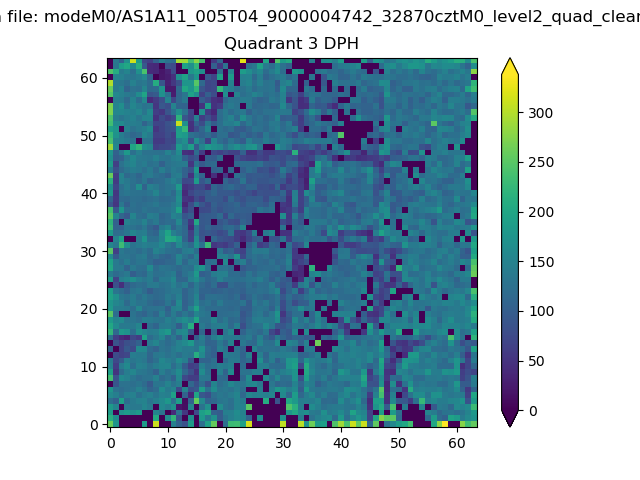 |
 |
Quadrant C |
| Plot type | Count rate plots | Images |
|---|---|---|
| Comparison with Poisson distribution Blue bars denote a histogram of data divided into 1 sec bins. Red curve is a Poisson curve with rate = median count rate of data. |
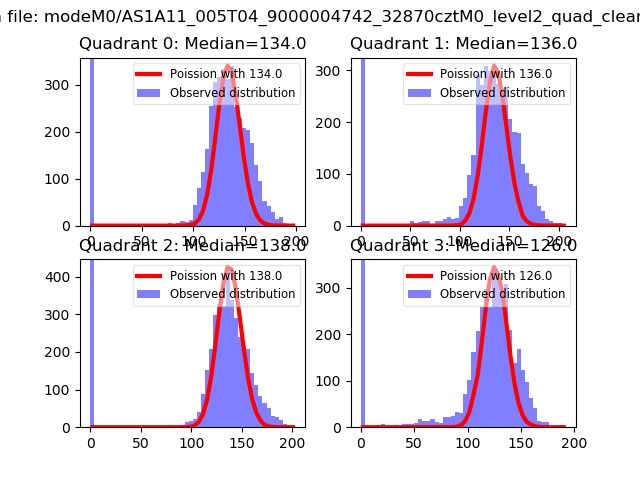 |
 |
| Quadrant-wise count rates Data is divided into 100 sec bins |
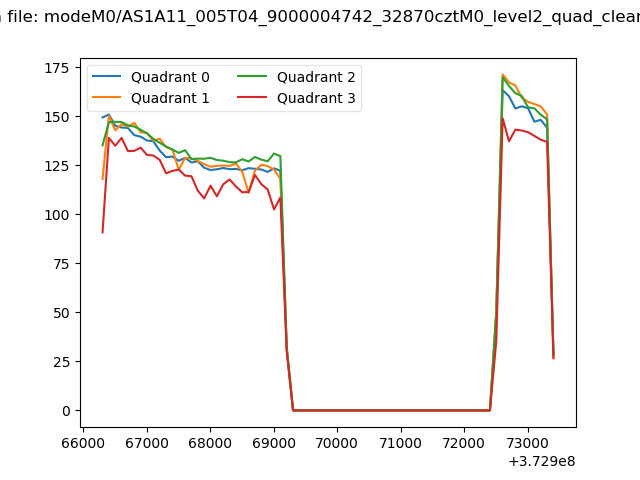 |
|
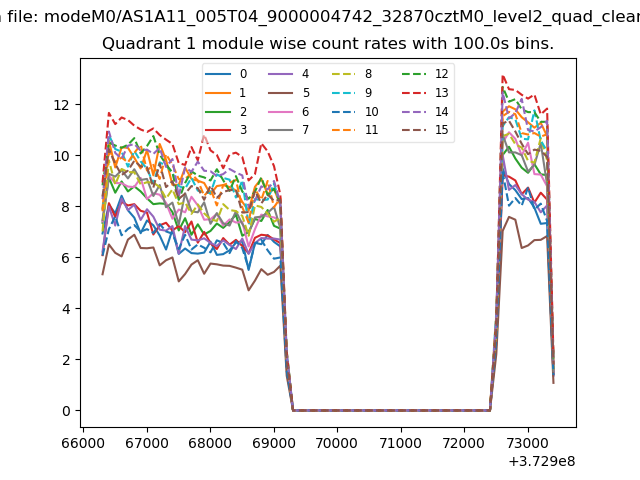
| Module-wise count rates for Quadrant A Data is divided into 100 sec bins |
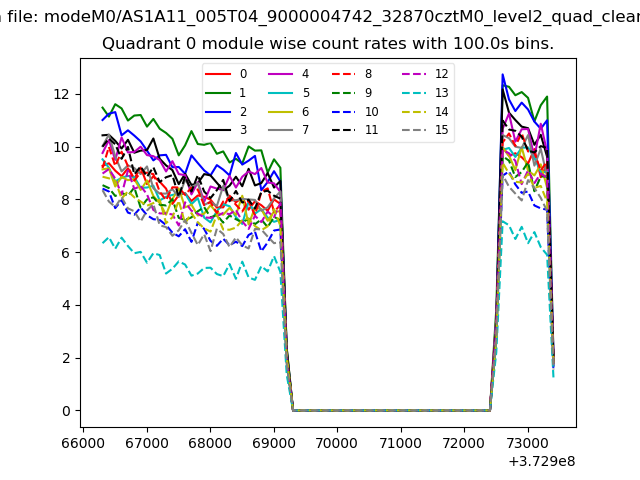 |
 |
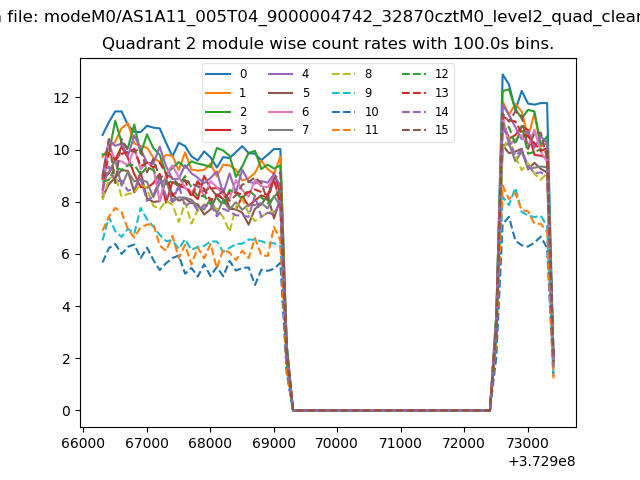
| Module-wise count rates for Quadrant B Data is divided into 100 sec bins |
 |
 |
| Module-wise count rates for Quadrant C Data is divided into 100 sec bins |
 |
 |
| Module-wise count rates for Quadrant D Data is divided into 100 sec bins |
 |
 |
| Parameter | Plot |
|---|---|
| CZT HV Monitor | 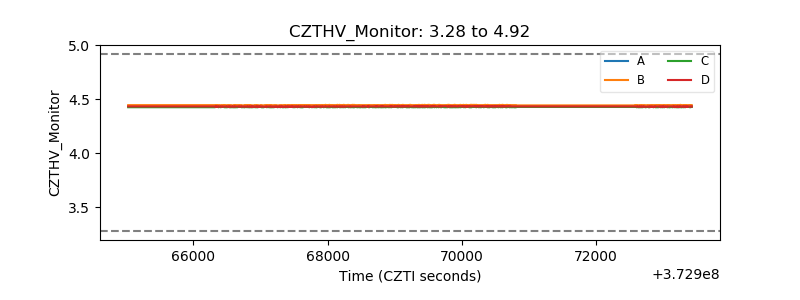 |
| D_VDD | 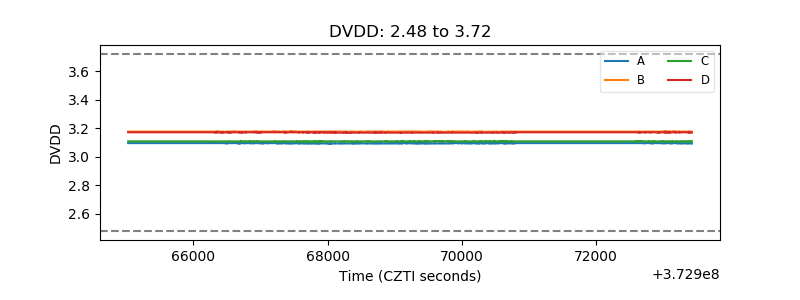 |
| Temperature 1 | 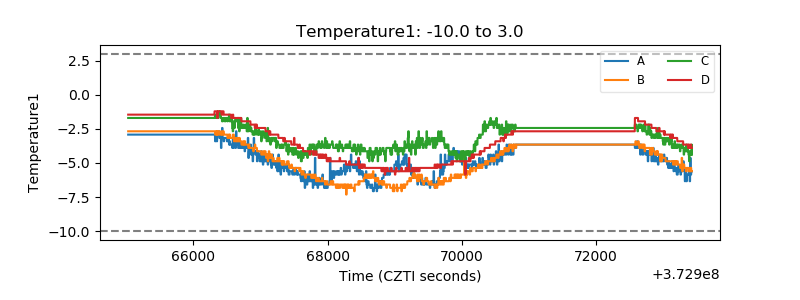 |
| Veto HV Monitor | 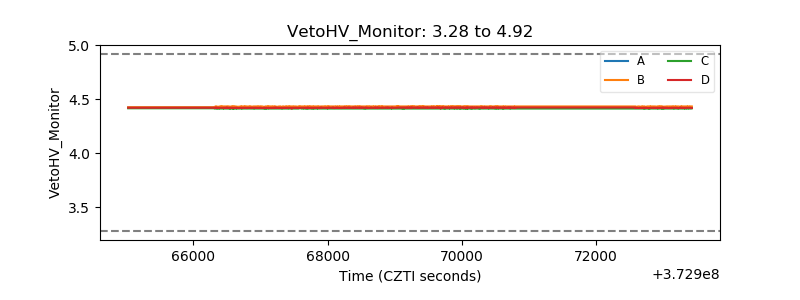 |
| Veto LLD | 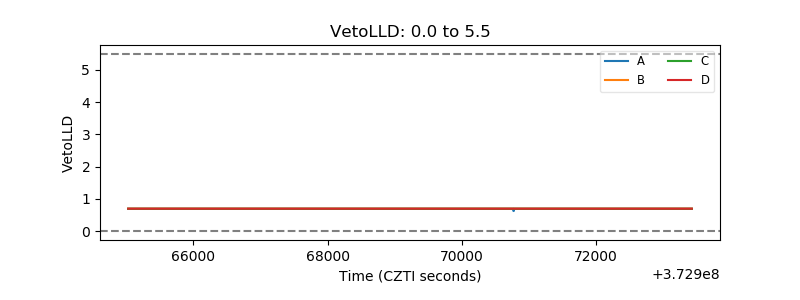 |
| Alpha Counter | 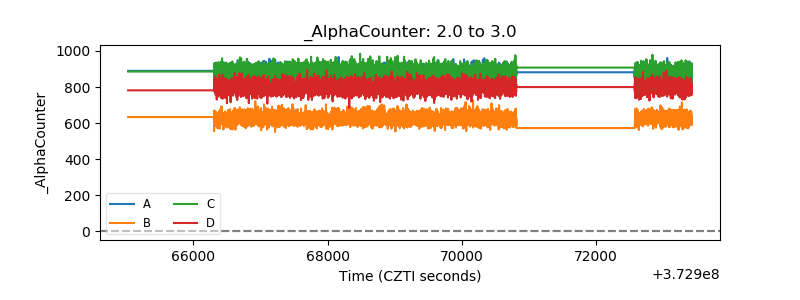 |
| _CPM_Rate | 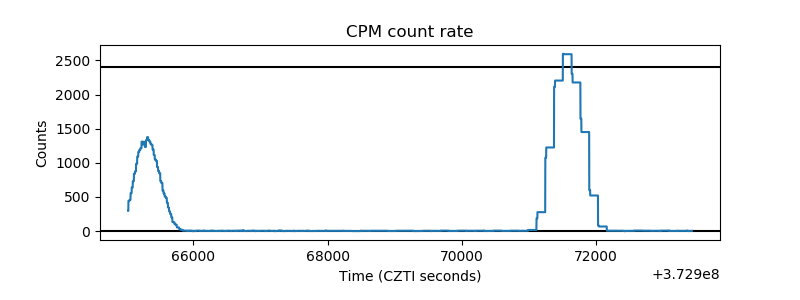 |
| CZT Counter | 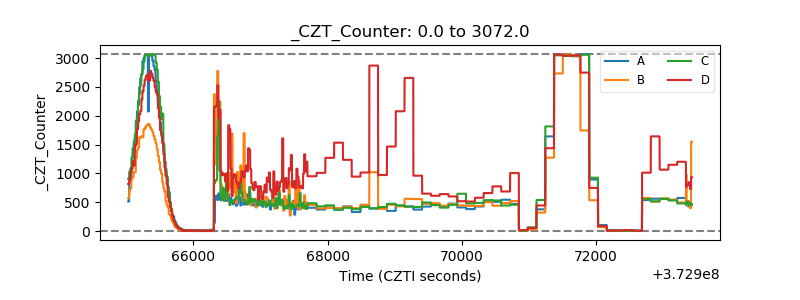 |
| +2.5 Volts monitor |  |
| +5 Volts monitor |  |
| _ROLL_ROT | 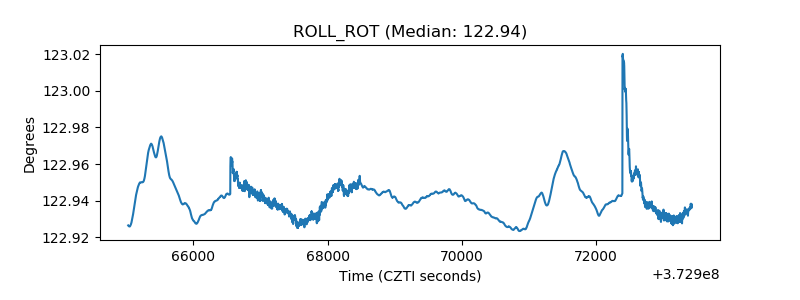 |
| _Roll_DEC | 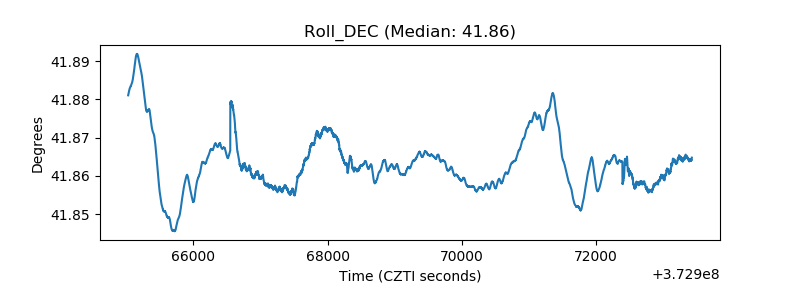 |
| _Roll_RA | 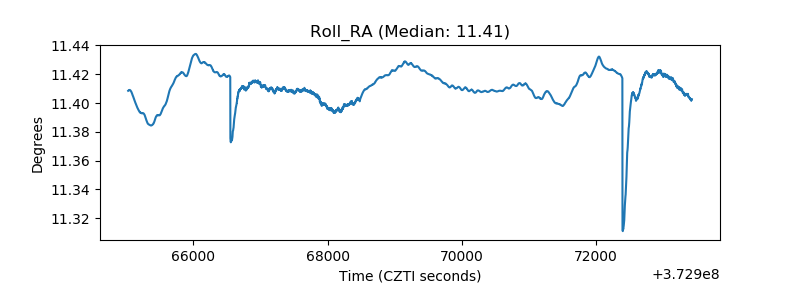 |
| Veto Counter | 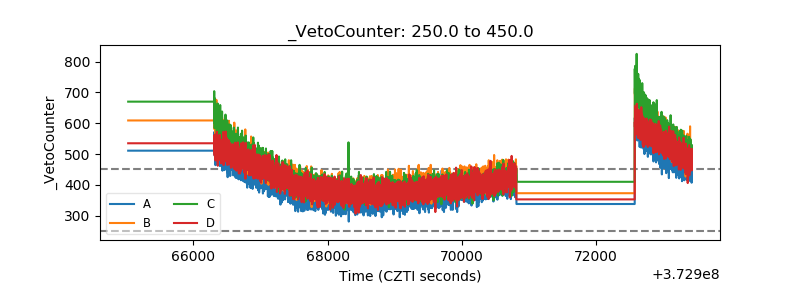 |