| Param | Original file | Final file |
|---|---|---|
| Filename | modeM0/AS1A11_005T04_9000004742_32871cztM0_level2.evt | modeM0/AS1A11_005T04_9000004742_32871cztM0_level2_quad_clean.evt |
| Size (bytes) | 468,299,520 | 75,847,680 |
| Size | 446.6 MB | 72.3 MB |
| Events in quadrant A | 2,537,146 | 493,715 |
| Events in quadrant B | 2,918,423 | 510,911 |
| Events in quadrant C | 2,719,834 | 509,077 |
| Events in quadrant D | 5,647,801 | 412,016 |
| Mode M9 | |||
|---|---|---|---|
| Quadrant | BADHDUFLAG | Total packets | Discarded packets |
| A | 0 | 25 | 0 |
| B | 0 | 25 | 0 |
| C | 0 | 25 | 0 |
| D | 0 | 26 | 0 |
| Mode M0 | |||
|---|---|---|---|
| Quadrant | BADHDUFLAG | Total packets | Discarded packets |
| A | 0 | 10844 | 3 |
| B | 0 | 11976 | 2 |
| C | 0 | 11370 | 2 |
| D | 0 | 20524 | 2 |
| Mode SS | |||
|---|---|---|---|
| Quadrant | BADHDUFLAG | Total packets | Discarded packets |
| A | 0 | 108 | 0 |
| B | 0 | 108 | 0 |
| C | 0 | 108 | 0 |
| D | 0 | 108 | 0 |
| Quadrant | Total seconds | Saturated seconds | Saturation percentage |
|---|---|---|---|
| A | 5292 | 6 | 0.113379% |
| B | 5292 | 96 | 1.814059% |
| C | 5292 | 28 | 0.529101% |
| D | 5292 | 777 | 14.682540% |
Noise dominated data is calculated using 1-second bins in cleaned event files. If a bin has >2000 counts, and if more than 50% of those come from <1% of pixels, then it is considered to be noise-dominated and hence unusable.
| Quadrant | # 1 sec bins | Bins with >0 counts | Bins with >2000 counts | High rate bins dominated by noise | Noise dominated (total time) | Noise dominated (detector-on time) | Marked lightcurve |
|---|---|---|---|---|---|---|---|
| A | 7175 | 5293 | 1 | 1 | 0.01% | 0.02% | 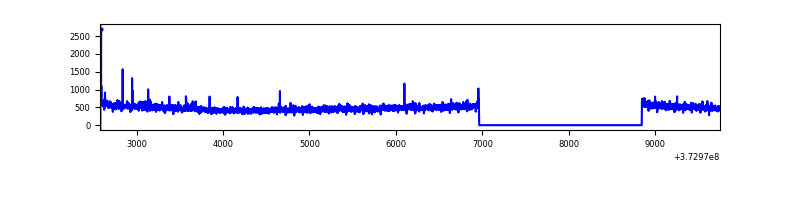 |
| B | 7175 | 5293 | 56 | 56 | 0.78% | 1.06% | 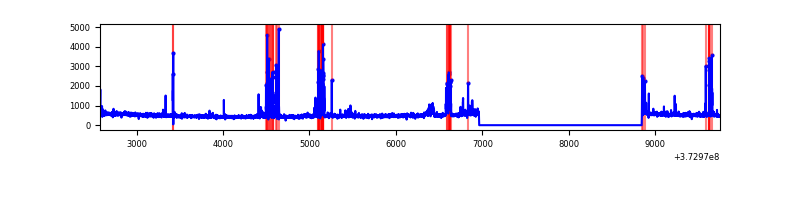 |
| C | 7175 | 5293 | 15 | 15 | 0.21% | 0.28% | 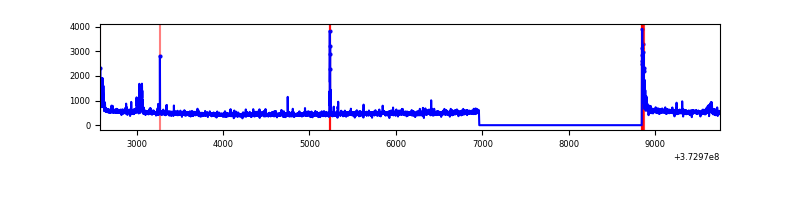 |
| D | 7175 | 5293 | 669 | 669 | 9.32% | 12.64% | 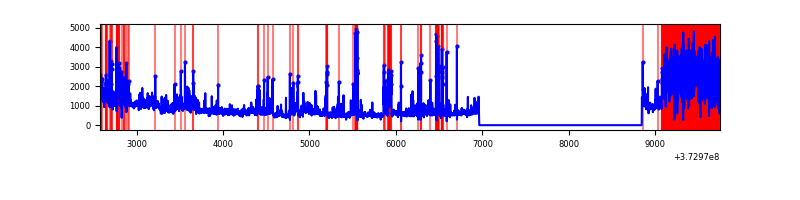 |
Top three noisy pixels from each quadrant. If the there are fewer than three noisy pixels in the level2.evt file, extra rows are filled as -1
| Pixel properties | Quadrant properties | ||||||
|---|---|---|---|---|---|---|---|
| Quadrant | DetID | PixID | Counts | Sigma | Mean | Median | Sigma |
| A | 14 | 63 | 38869 | 303.02 | 639 | 629 | 126.2 |
| A | 13 | 6 | 21887 | 168.45 | 639 | 629 | 126.2 |
| A | 13 | 254 | 9934 | 73.73 | 639 | 629 | 126.2 |
| B | 5 | 172 | 236941 | 1980.26 | 643 | 629 | 119.3 |
| B | 0 | 230 | 56602 | 469.05 | 643 | 629 | 119.3 |
| B | 12 | 1 | 35213 | 289.81 | 643 | 629 | 119.3 |
| C | 0 | 10 | 76150 | 518.93 | 635 | 642 | 145.5 |
| C | 14 | 67 | 60449 | 411.03 | 635 | 642 | 145.5 |
| C | 3 | 233 | 33356 | 224.83 | 635 | 642 | 145.5 |
| D | 12 | 233 | 1443340 | 9984.14 | 570 | 558 | 144.5 |
| D | 8 | 195 | 722578 | 4996.42 | 570 | 558 | 144.5 |
| D | 10 | 203 | 356118 | 2460.5 | 570 | 558 | 144.5 |
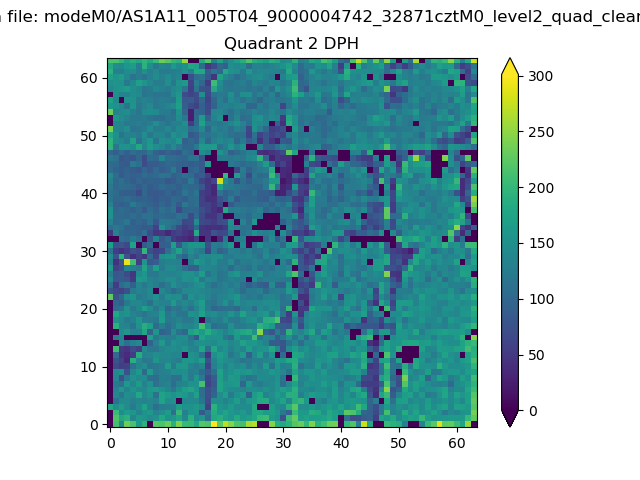
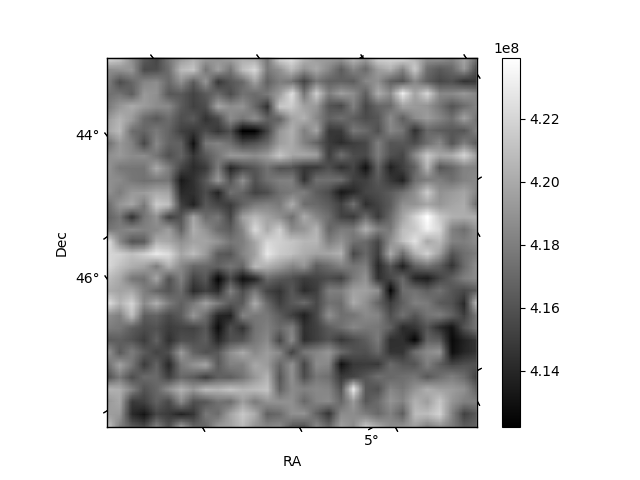
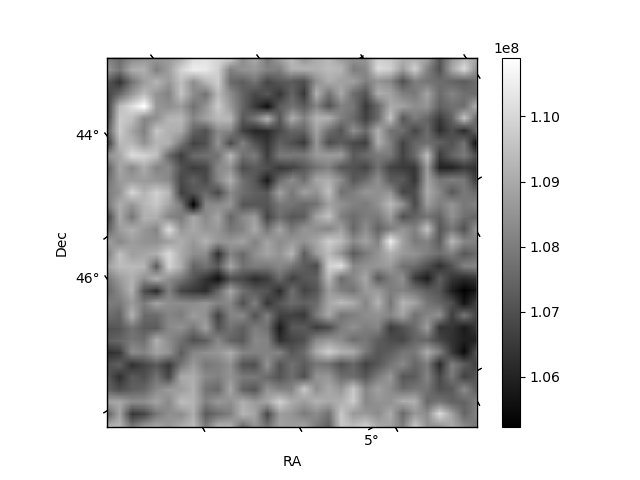
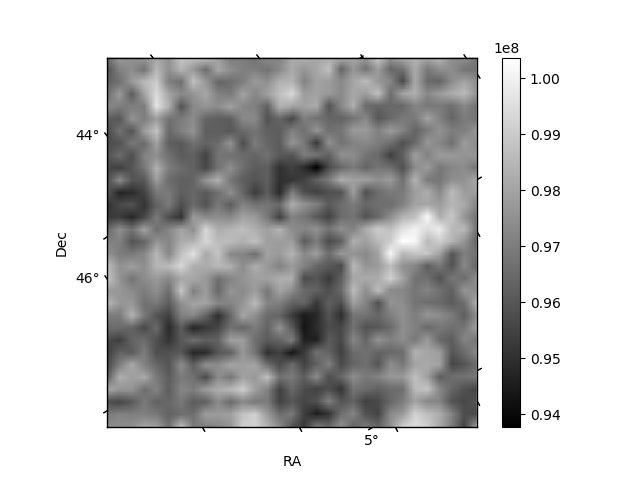
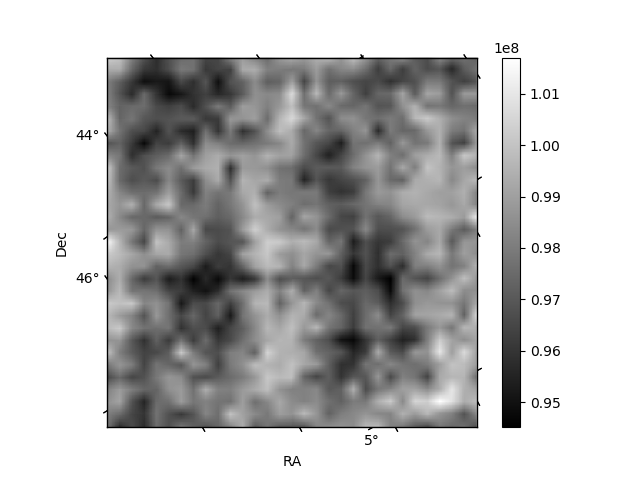
Histogram calculated using DETX and DETY for each event in the final _common_clean file
| Quadrant A | 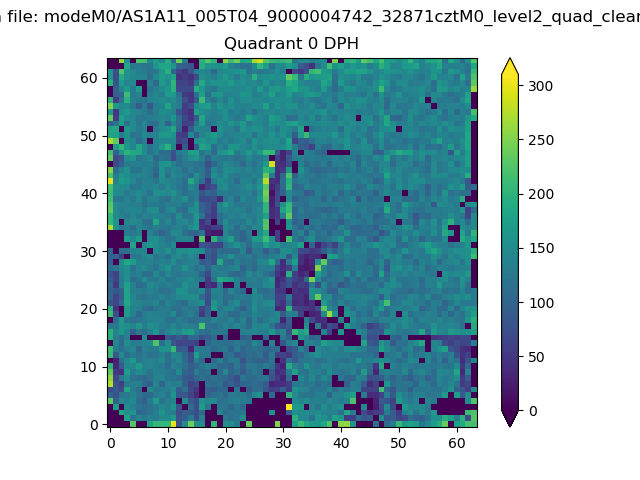 |
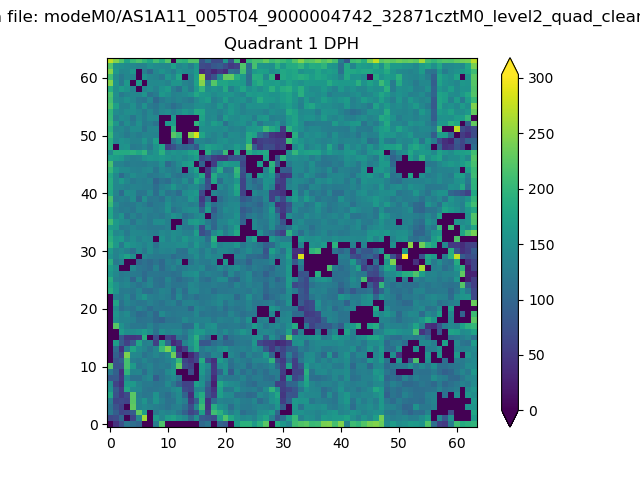 |
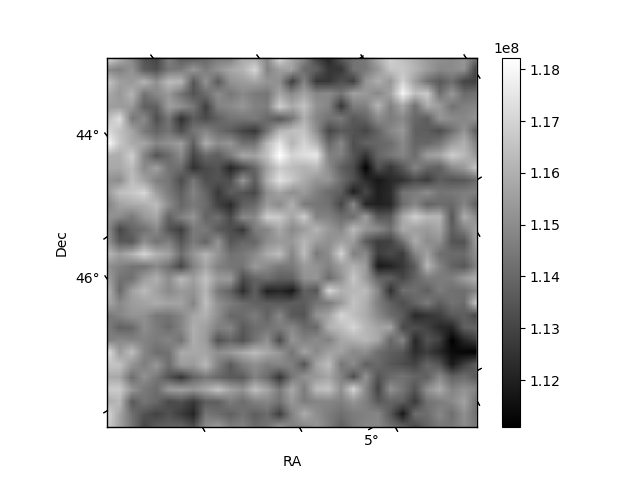
Quadrant B |
|---|---|---|---|
| Quadrant D | 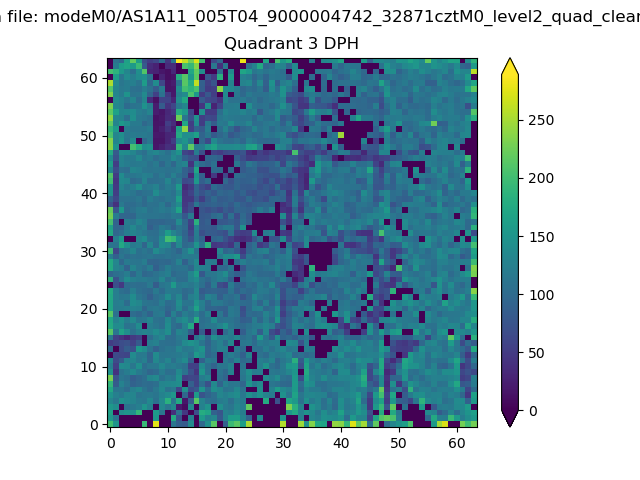 |
 |
Quadrant C |
| Plot type | Count rate plots | Images |
|---|---|---|
| Comparison with Poisson distribution Blue bars denote a histogram of data divided into 1 sec bins. Red curve is a Poisson curve with rate = median count rate of data. |
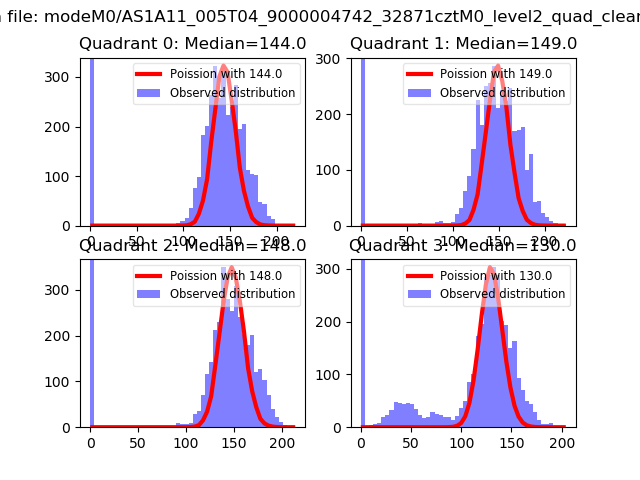 |
 |
| Quadrant-wise count rates Data is divided into 100 sec bins |
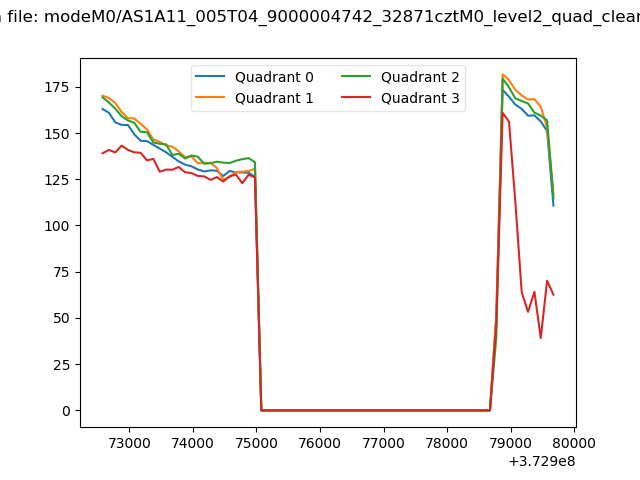 |
|
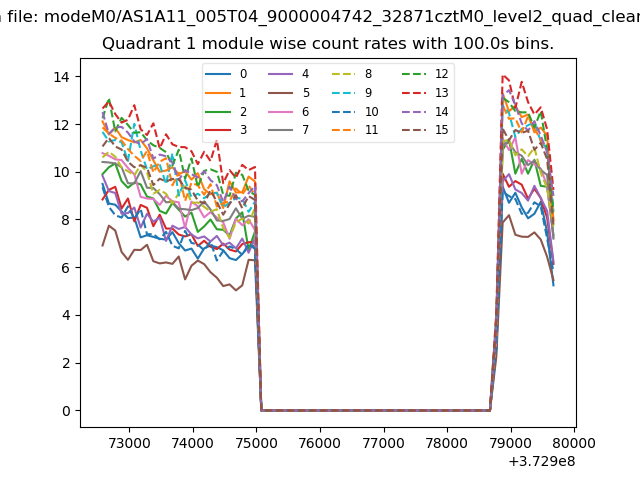
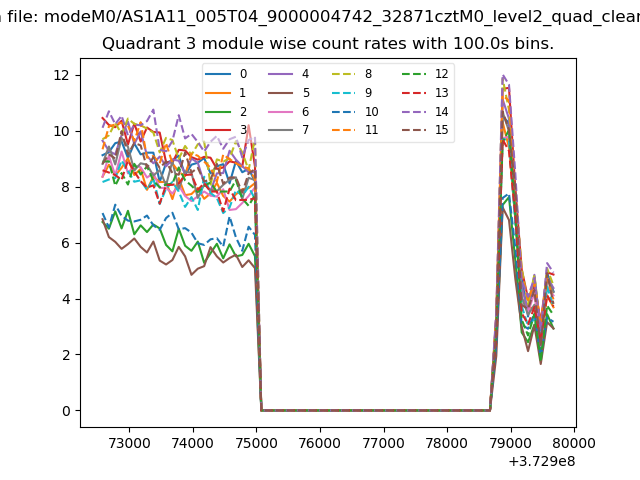
| Module-wise count rates for Quadrant A Data is divided into 100 sec bins |
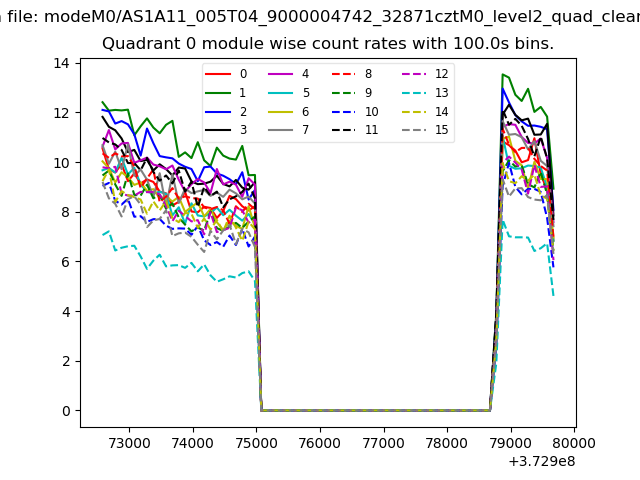 |
 |
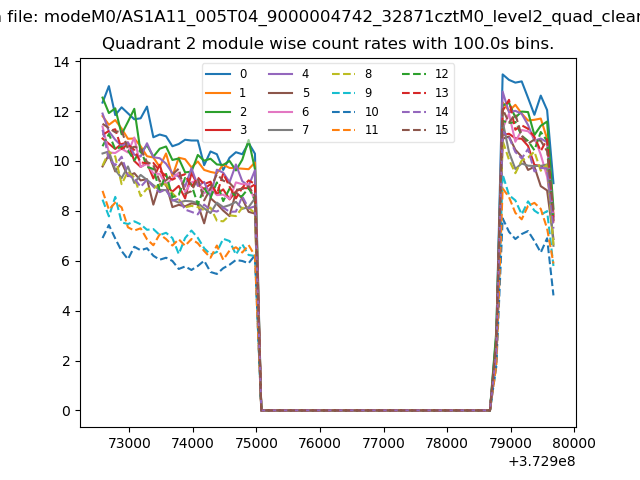
| Module-wise count rates for Quadrant B Data is divided into 100 sec bins |
 |
 |
| Module-wise count rates for Quadrant C Data is divided into 100 sec bins |
 |
 |
| Module-wise count rates for Quadrant D Data is divided into 100 sec bins |
 |
 |
| Parameter | Plot |
|---|---|
| CZT HV Monitor | 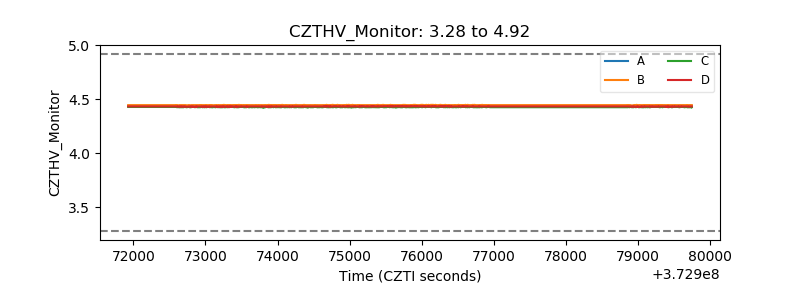 |
| D_VDD | 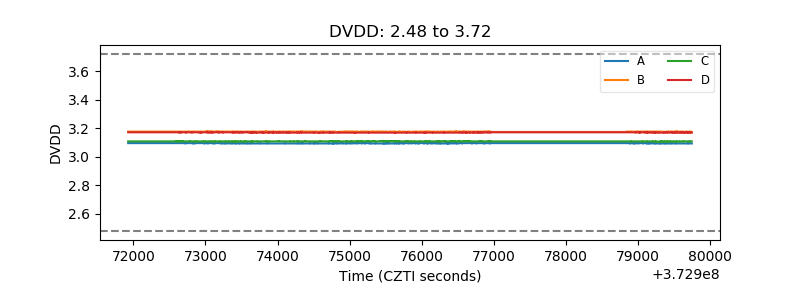 |
| Temperature 1 | 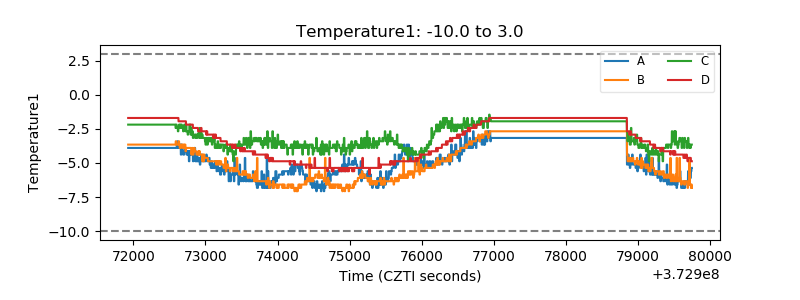 |
| Veto HV Monitor | 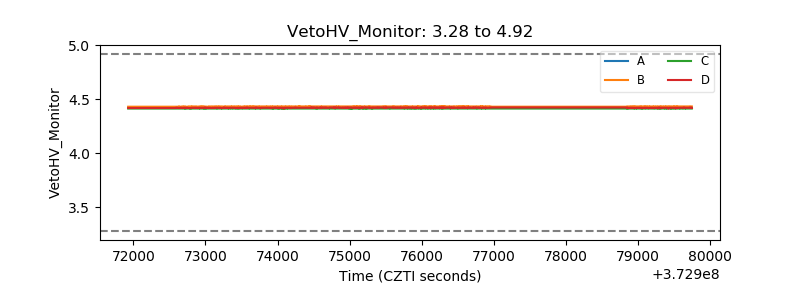 |
| Veto LLD | 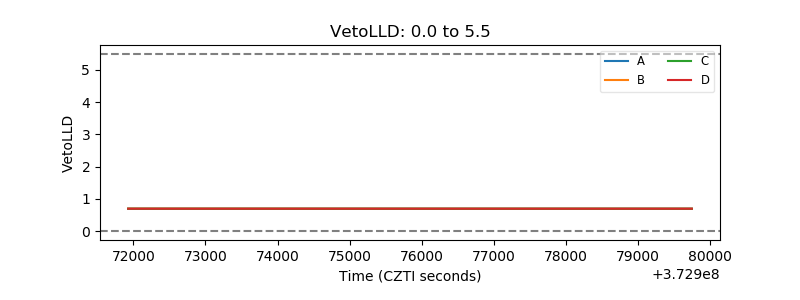 |
| Alpha Counter | 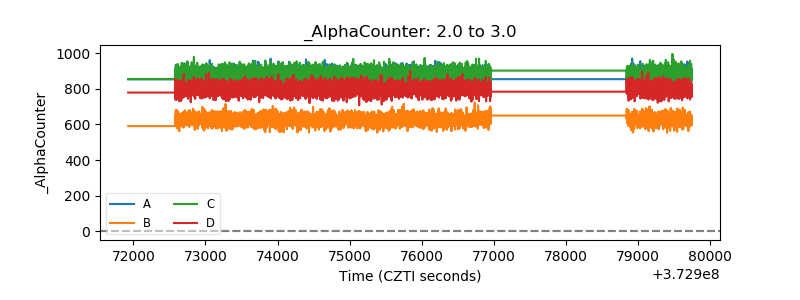 |
| _CPM_Rate | 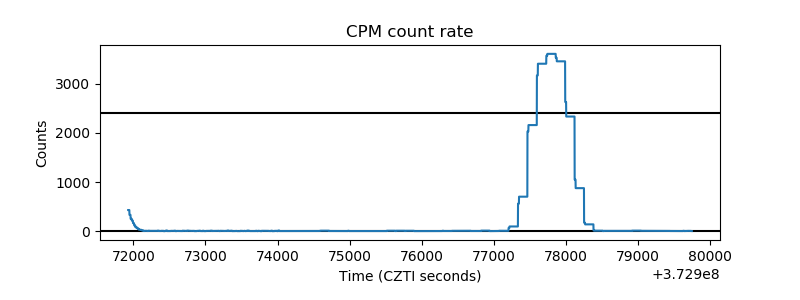 |
| CZT Counter |  |
| +2.5 Volts monitor |  |
| +5 Volts monitor |  |
| _ROLL_ROT | 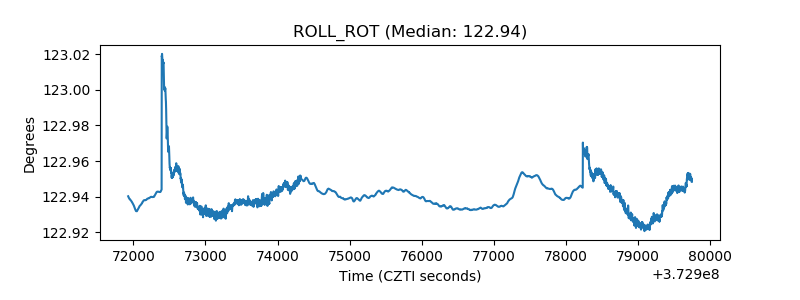 |
| _Roll_DEC | 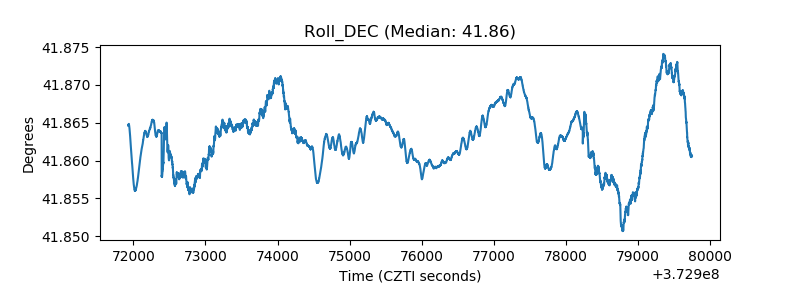 |
| _Roll_RA |  |
| Veto Counter | 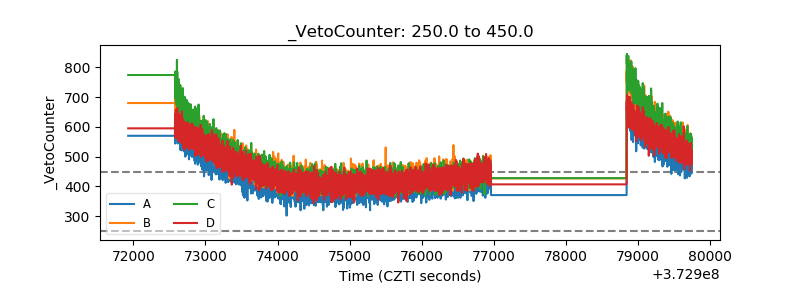 |