| Param | Original file | Final file |
|---|---|---|
| Filename | modeM0/AS1A11_005T04_9000004742_32872cztM0_level2.evt | modeM0/AS1A11_005T04_9000004742_32872cztM0_level2_quad_clean.evt |
| Size (bytes) | 515,782,080 | 72,385,920 |
| Size | 491.9 MB | 69.0 MB |
| Events in quadrant A | 3,453,516 | 476,106 |
| Events in quadrant B | 3,435,504 | 487,874 |
| Events in quadrant C | 2,806,700 | 491,105 |
| Events in quadrant D | 5,576,012 | 375,587 |
| Mode M9 | |||
|---|---|---|---|
| Quadrant | BADHDUFLAG | Total packets | Discarded packets |
| A | 0 | 32 | 0 |
| B | 0 | 32 | 0 |
| C | 0 | 32 | 0 |
| D | 0 | 33 | 0 |
| Mode M0 | |||
|---|---|---|---|
| Quadrant | BADHDUFLAG | Total packets | Discarded packets |
| A | 0 | 13750 | 3 |
| B | 0 | 13317 | 2 |
| C | 0 | 11550 | 2 |
| D | 0 | 20020 | 2 |
| Mode SS | |||
|---|---|---|---|
| Quadrant | BADHDUFLAG | Total packets | Discarded packets |
| A | 0 | 104 | 0 |
| B | 0 | 104 | 0 |
| C | 0 | 104 | 0 |
| D | 0 | 104 | 0 |
| Quadrant | Total seconds | Saturated seconds | Saturation percentage |
|---|---|---|---|
| A | 5149 | 48 | 0.932220% |
| B | 5149 | 303 | 5.884638% |
| C | 5149 | 39 | 0.757429% |
| D | 5149 | 968 | 18.799767% |
Noise dominated data is calculated using 1-second bins in cleaned event files. If a bin has >2000 counts, and if more than 50% of those come from <1% of pixels, then it is considered to be noise-dominated and hence unusable.
| Quadrant | # 1 sec bins | Bins with >0 counts | Bins with >2000 counts | High rate bins dominated by noise | Noise dominated (total time) | Noise dominated (detector-on time) | Marked lightcurve |
|---|---|---|---|---|---|---|---|
| A | 7151 | 5150 | 8 | 8 | 0.11% | 0.16% | 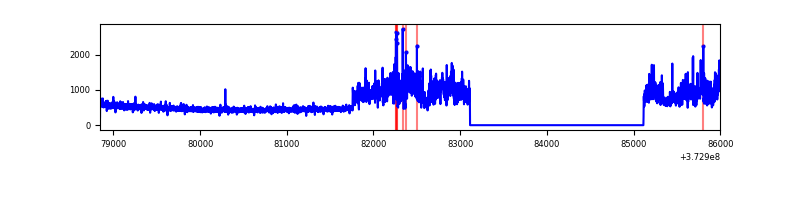 |
| B | 7151 | 5150 | 191 | 191 | 2.67% | 3.71% | 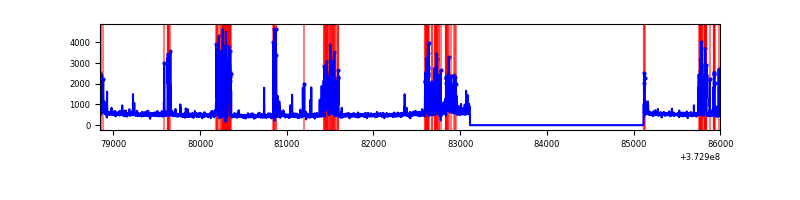 |
| C | 7151 | 5150 | 25 | 25 | 0.35% | 0.49% |  |
| D | 7151 | 5150 | 842 | 842 | 11.77% | 16.35% |  |
Top three noisy pixels from each quadrant. If the there are fewer than three noisy pixels in the level2.evt file, extra rows are filled as -1
| Pixel properties | Quadrant properties | ||||||
|---|---|---|---|---|---|---|---|
| Quadrant | DetID | PixID | Counts | Sigma | Mean | Median | Sigma |
| A | 14 | 63 | 976778 | 7769.98 | 634 | 625 | 125.6 |
| A | 13 | 6 | 19412 | 149.54 | 634 | 625 | 125.6 |
| A | 13 | 254 | 9579 | 71.27 | 634 | 625 | 125.6 |
| B | 5 | 172 | 742789 | 6380.72 | 632 | 619 | 116.3 |
| B | 0 | 197 | 82336 | 702.55 | 632 | 619 | 116.3 |
| B | 12 | 1 | 63353 | 539.35 | 632 | 619 | 116.3 |
| C | 3 | 233 | 173611 | 1197.78 | 630 | 637 | 144.4 |
| C | 0 | 10 | 104166 | 716.9 | 630 | 637 | 144.4 |
| C | 14 | 67 | 37354 | 254.25 | 630 | 637 | 144.4 |
| D | 12 | 233 | 2037642 | 14729.75 | 556 | 544 | 138.3 |
| D | 8 | 195 | 655604 | 4736.57 | 556 | 544 | 138.3 |
| D | 12 | 218 | 212671 | 1533.84 | 556 | 544 | 138.3 |
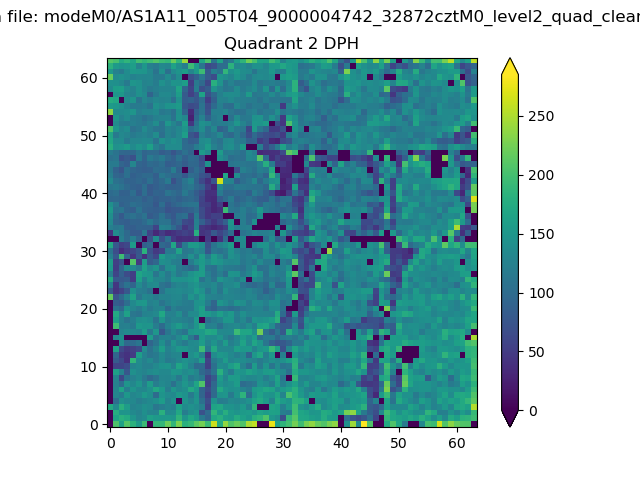
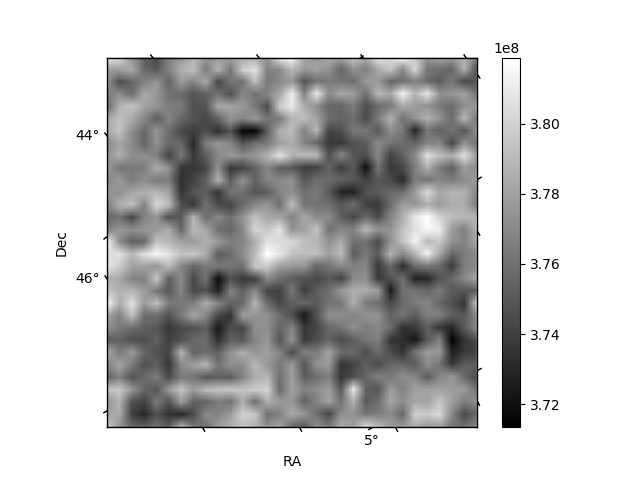
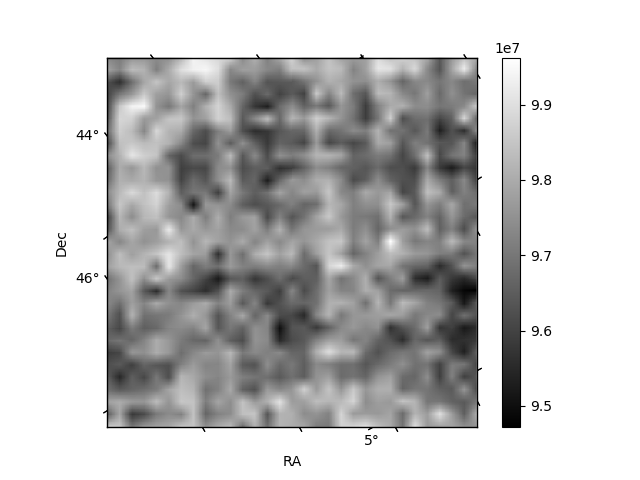
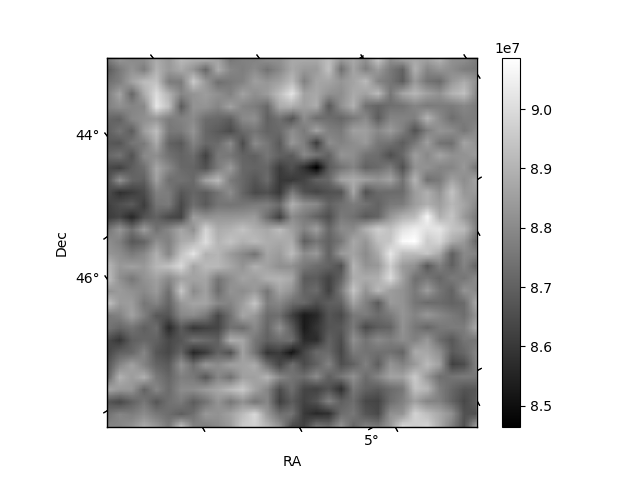
Histogram calculated using DETX and DETY for each event in the final _common_clean file
| Quadrant A | 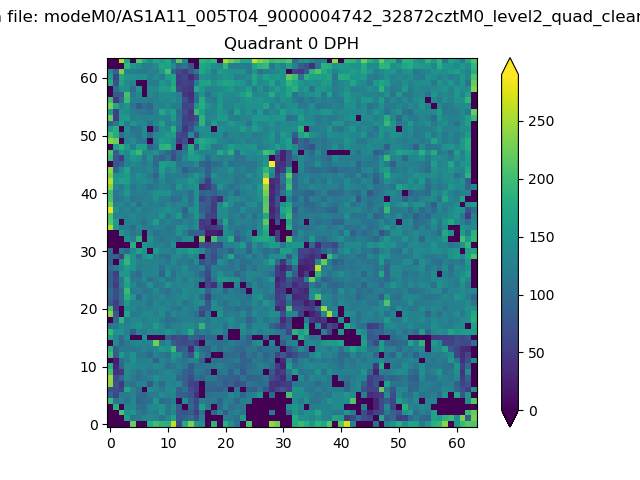 |
 |
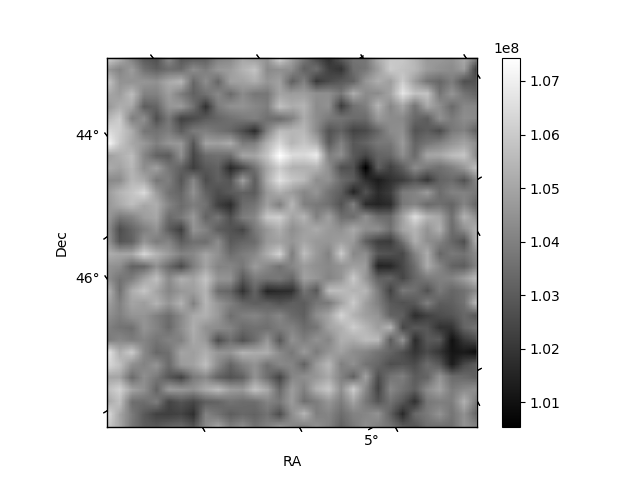
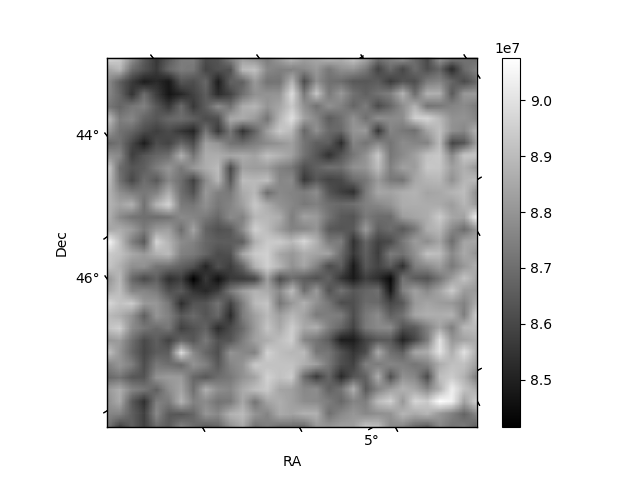
Quadrant B |
|---|---|---|---|
| Quadrant D |  |
 |
Quadrant C |
| Plot type | Count rate plots | Images |
|---|---|---|
| Comparison with Poisson distribution Blue bars denote a histogram of data divided into 1 sec bins. Red curve is a Poisson curve with rate = median count rate of data. |
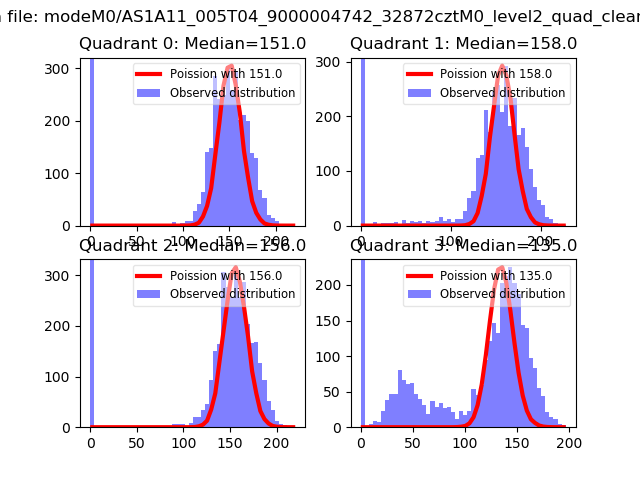 |
 |
| Quadrant-wise count rates Data is divided into 100 sec bins |
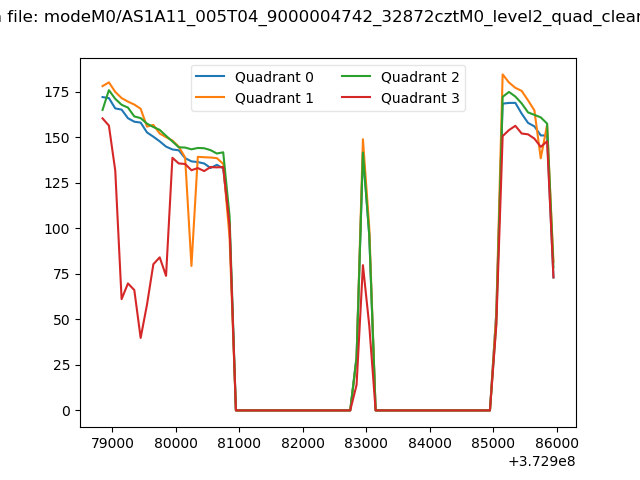 |
|
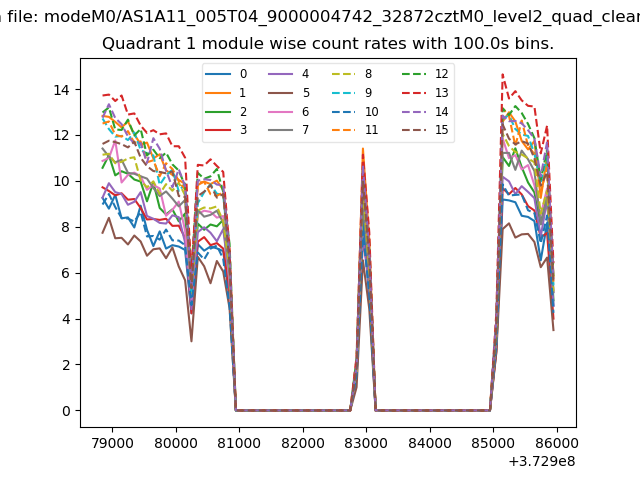
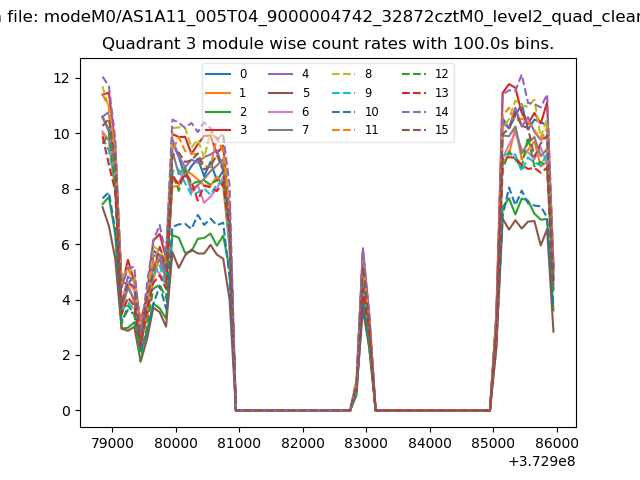
| Module-wise count rates for Quadrant A Data is divided into 100 sec bins |
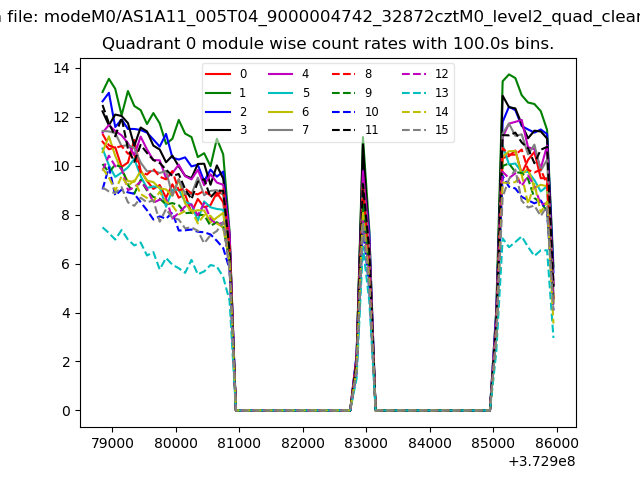 |
 |
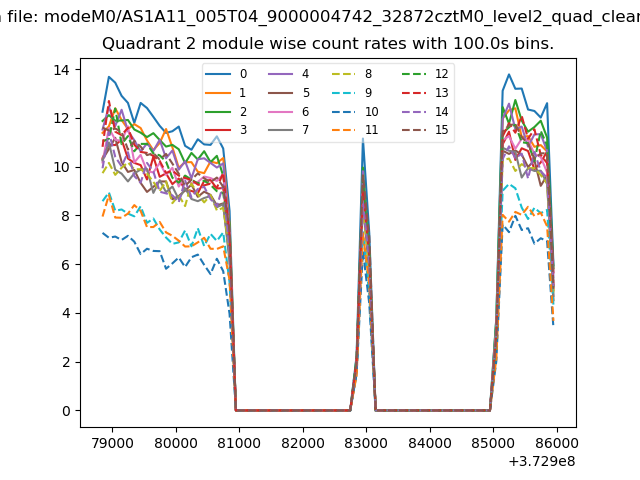
| Module-wise count rates for Quadrant B Data is divided into 100 sec bins |
 |
 |
| Module-wise count rates for Quadrant C Data is divided into 100 sec bins |
 |
 |
| Module-wise count rates for Quadrant D Data is divided into 100 sec bins |
 |
 |
| Parameter | Plot |
|---|---|
| CZT HV Monitor | 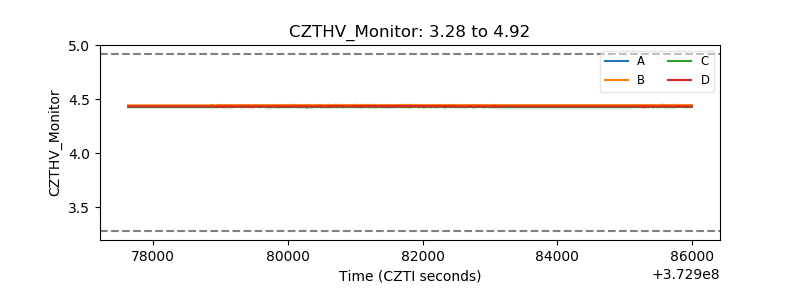 |
| D_VDD | 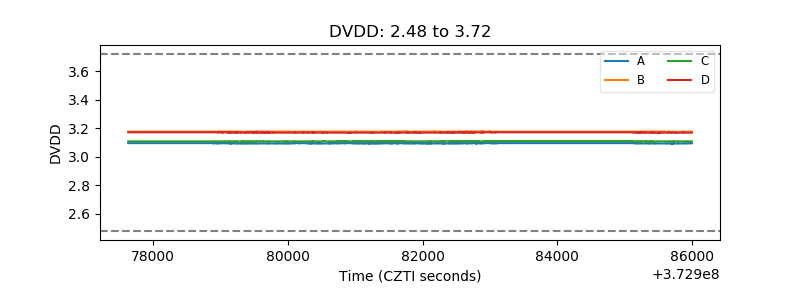 |
| Temperature 1 | 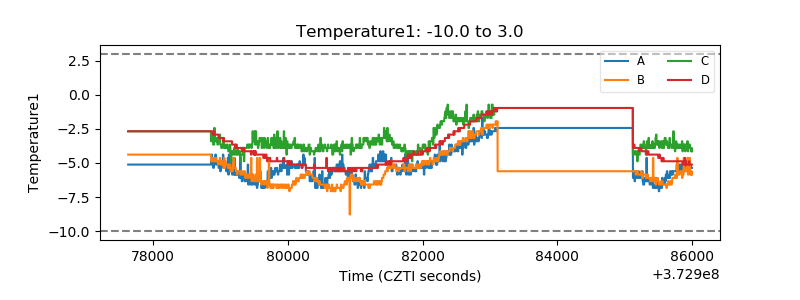 |
| Veto HV Monitor | 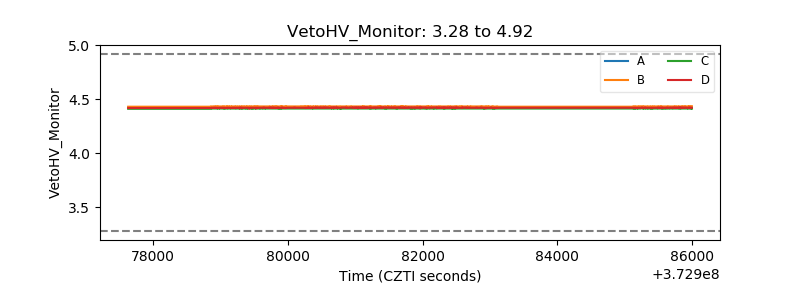 |
| Veto LLD | 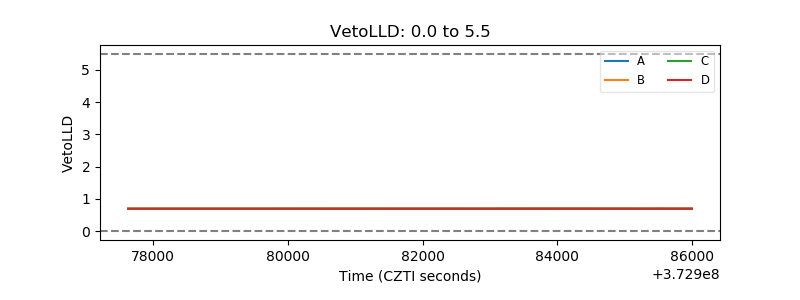 |
| Alpha Counter | 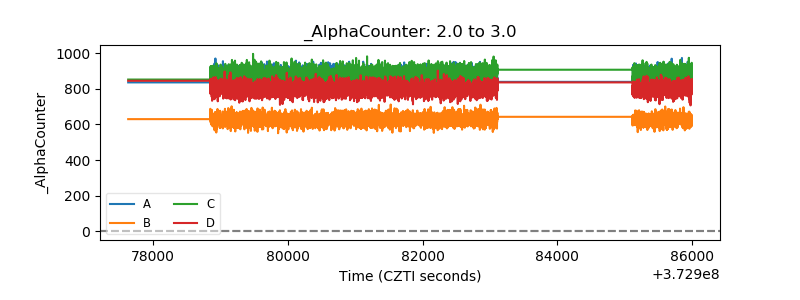 |
| _CPM_Rate | 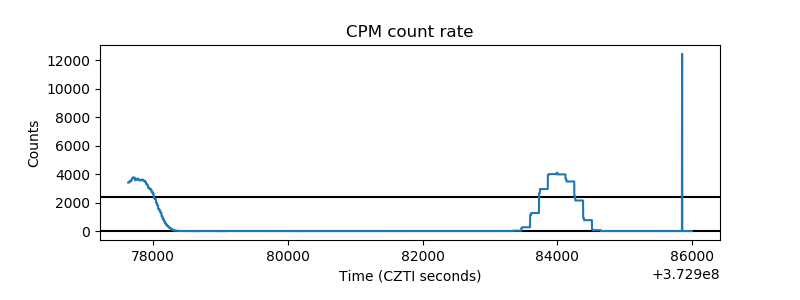 |
| CZT Counter | 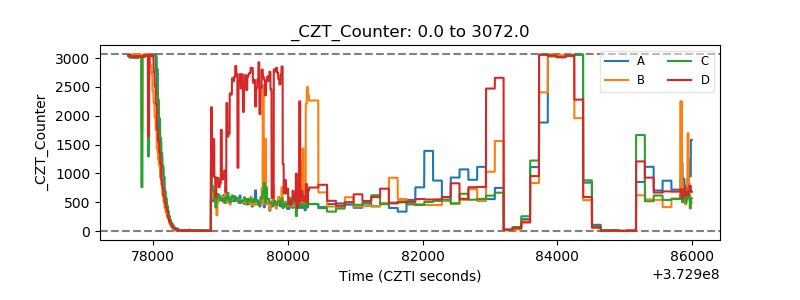 |
| +2.5 Volts monitor |  |
| +5 Volts monitor |  |
| _ROLL_ROT | 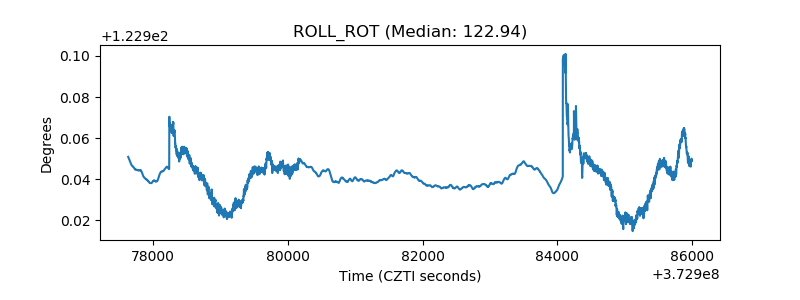 |
| _Roll_DEC | 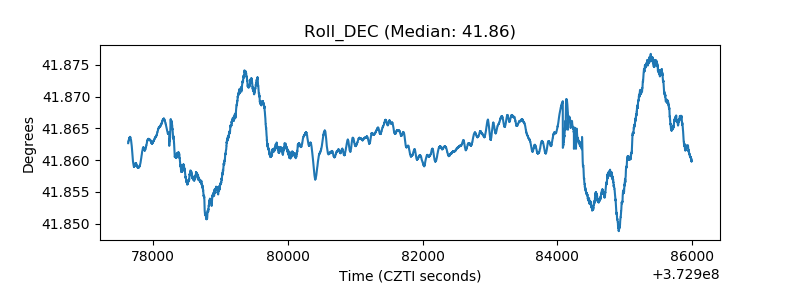 |
| _Roll_RA | 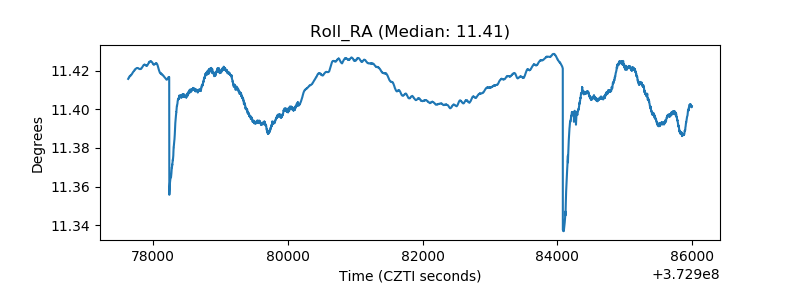 |
| Veto Counter | 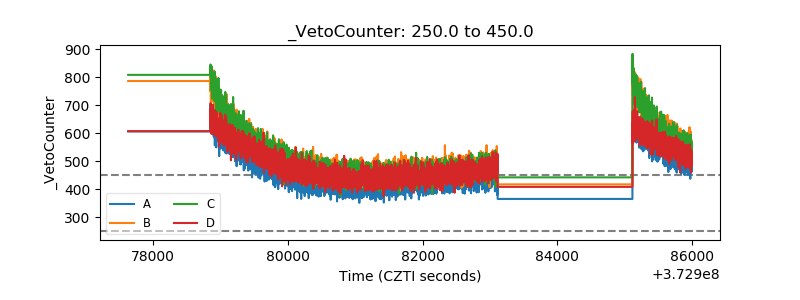 |