| Param | Original file | Final file |
|---|---|---|
| Filename | modeM0/AS1A11_005T04_9000004742_32873cztM0_level2.evt | modeM0/AS1A11_005T04_9000004742_32873cztM0_level2_quad_clean.evt |
| Size (bytes) | 451,540,800 | 69,281,280 |
| Size | 430.6 MB | 66.1 MB |
| Events in quadrant A | 3,477,563 | 441,836 |
| Events in quadrant B | 3,211,534 | 446,326 |
| Events in quadrant C | 2,652,187 | 452,011 |
| Events in quadrant D | 3,999,736 | 412,159 |
| Mode M9 | |||
|---|---|---|---|
| Quadrant | BADHDUFLAG | Total packets | Discarded packets |
| A | 0 | 32 | 0 |
| B | 0 | 32 | 1 |
| C | 0 | 32 | 0 |
| D | 0 | 33 | 0 |
| Mode M0 | |||
|---|---|---|---|
| Quadrant | BADHDUFLAG | Total packets | Discarded packets |
| A | 0 | 13515 | 29 |
| B | 0 | 12494 | 22 |
| C | 0 | 10823 | 27 |
| D | 0 | 15429 | 33 |
| Mode SS | |||
|---|---|---|---|
| Quadrant | BADHDUFLAG | Total packets | Discarded packets |
| A | 0 | 102 | 0 |
| B | 0 | 102 | 0 |
| C | 0 | 102 | 0 |
| D | 0 | 102 | 0 |
| Quadrant | Total seconds | Saturated seconds | Saturation percentage |
|---|---|---|---|
| A | 4919 | 33 | 0.670868% |
| B | 4920 | 291 | 5.914634% |
| C | 4915 | 36 | 0.732452% |
| D | 4917 | 135 | 2.745577% |
Noise dominated data is calculated using 1-second bins in cleaned event files. If a bin has >2000 counts, and if more than 50% of those come from <1% of pixels, then it is considered to be noise-dominated and hence unusable.
| Quadrant | # 1 sec bins | Bins with >0 counts | Bins with >2000 counts | High rate bins dominated by noise | Noise dominated (total time) | Noise dominated (detector-on time) | Marked lightcurve |
|---|---|---|---|---|---|---|---|
| A | 7020 | 4927 | 16 | 16 | 0.23% | 0.32% | 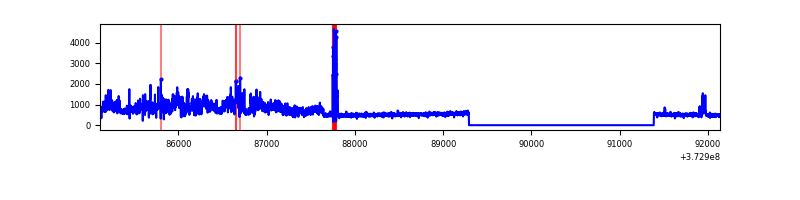 |
| B | 7020 | 4927 | 166 | 166 | 2.36% | 3.37% | 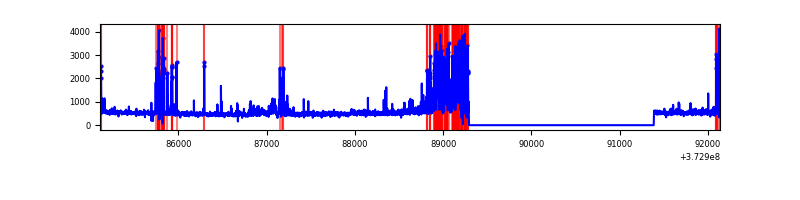 |
| C | 7020 | 4927 | 26 | 26 | 0.37% | 0.53% | 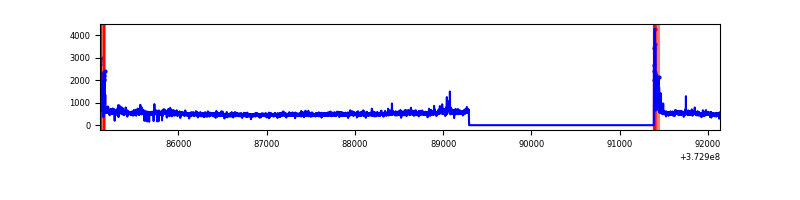 |
| D | 7020 | 4926 | 130 | 130 | 1.85% | 2.64% | 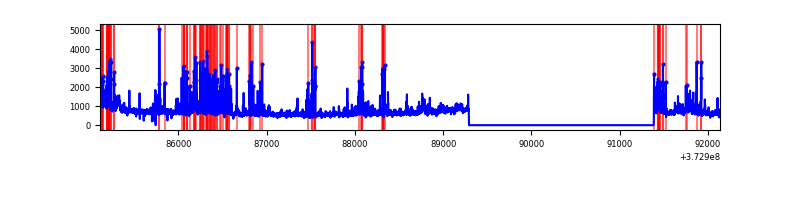 |
Top three noisy pixels from each quadrant. If the there are fewer than three noisy pixels in the level2.evt file, extra rows are filled as -1
| Pixel properties | Quadrant properties | ||||||
|---|---|---|---|---|---|---|---|
| Quadrant | DetID | PixID | Counts | Sigma | Mean | Median | Sigma |
| A | 14 | 63 | 1088580 | 8838.34 | 613 | 600 | 123.1 |
| A | 13 | 6 | 18853 | 148.28 | 613 | 600 | 123.1 |
| A | 13 | 254 | 9014 | 68.35 | 613 | 600 | 123.1 |
| B | 5 | 172 | 678751 | 6028.88 | 610 | 598 | 112.5 |
| B | 0 | 197 | 45053 | 395.21 | 610 | 598 | 112.5 |
| B | 0 | 230 | 43847 | 384.49 | 610 | 598 | 112.5 |
| C | 0 | 10 | 124186 | 896.58 | 602 | 606 | 137.8 |
| C | 3 | 233 | 114459 | 826.01 | 602 | 606 | 137.8 |
| C | 14 | 67 | 35182 | 250.85 | 602 | 606 | 137.8 |
| D | 8 | 195 | 707160 | 4829.2 | 582 | 570 | 146.3 |
| D | 2 | 250 | 512916 | 3501.63 | 582 | 570 | 146.3 |
| D | 12 | 218 | 184905 | 1259.84 | 582 | 570 | 146.3 |
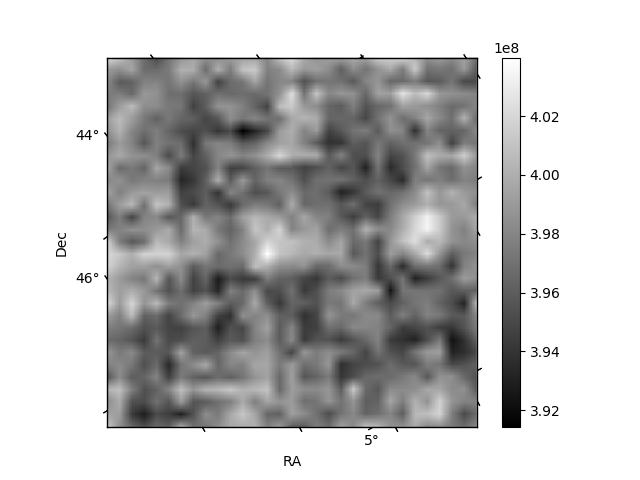
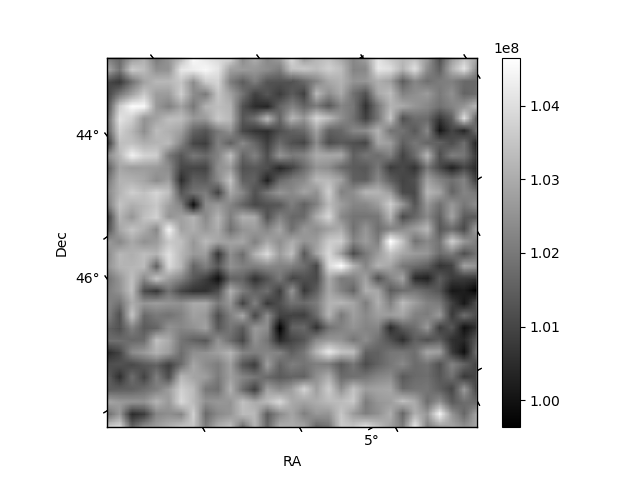
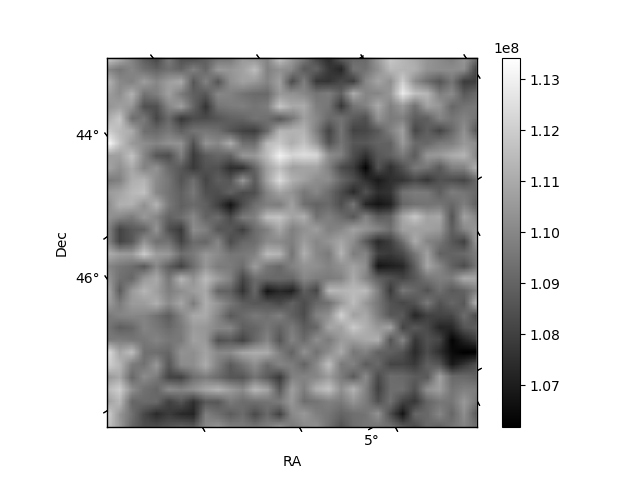
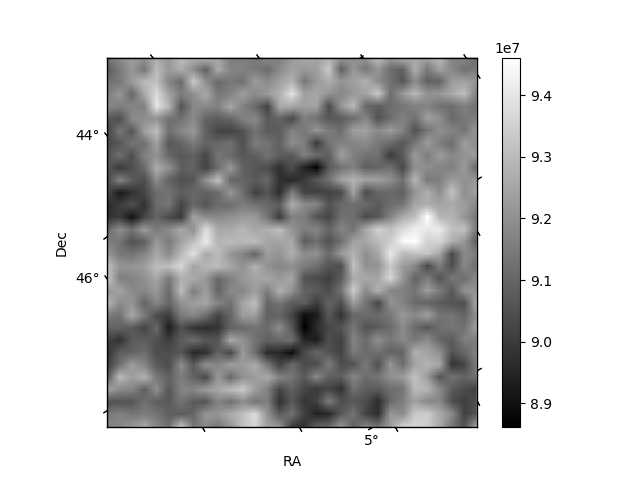
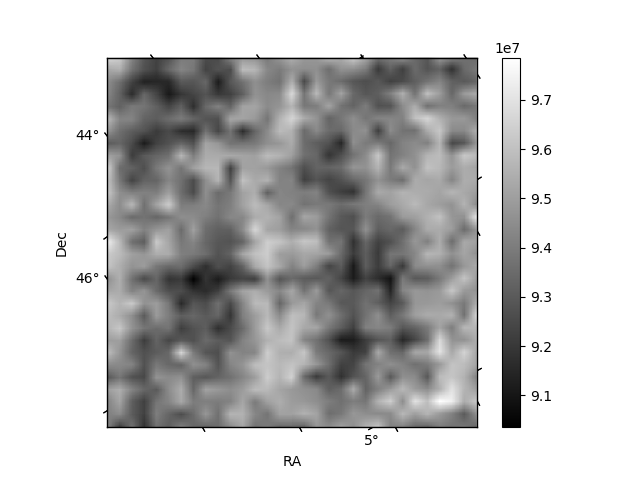
Histogram calculated using DETX and DETY for each event in the final _common_clean file
| Quadrant A | 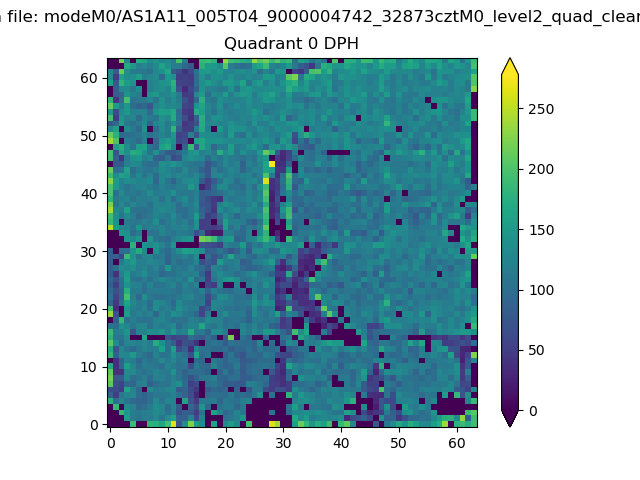 |
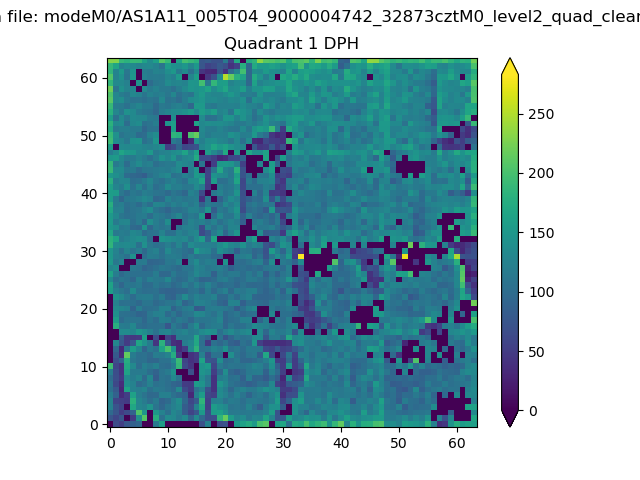 |
Quadrant B |
|---|---|---|---|
| Quadrant D | 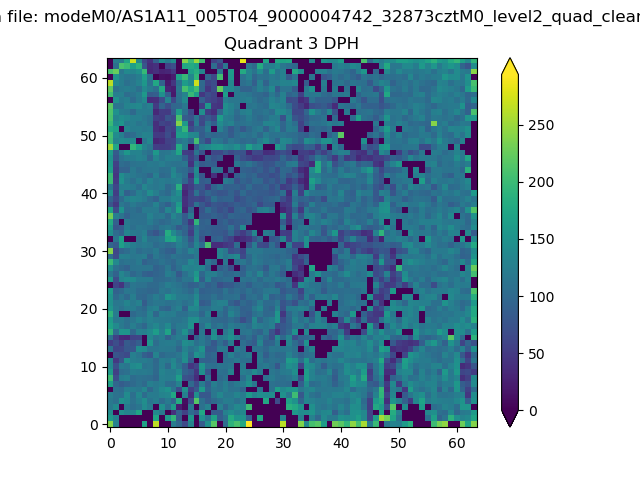 |
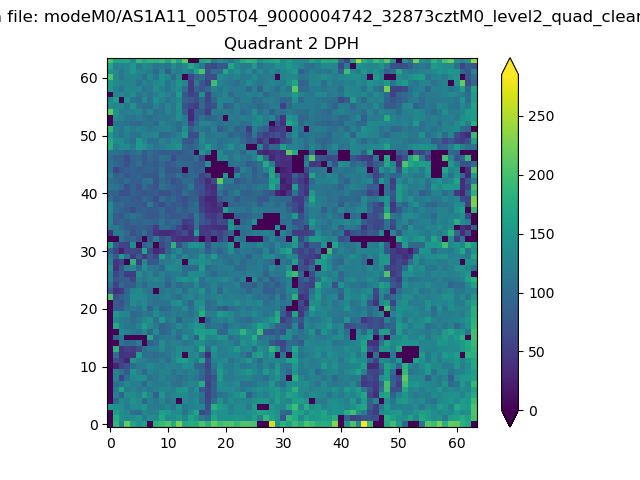 |
Quadrant C |
| Plot type | Count rate plots | Images |
|---|---|---|
| Comparison with Poisson distribution Blue bars denote a histogram of data divided into 1 sec bins. Red curve is a Poisson curve with rate = median count rate of data. |
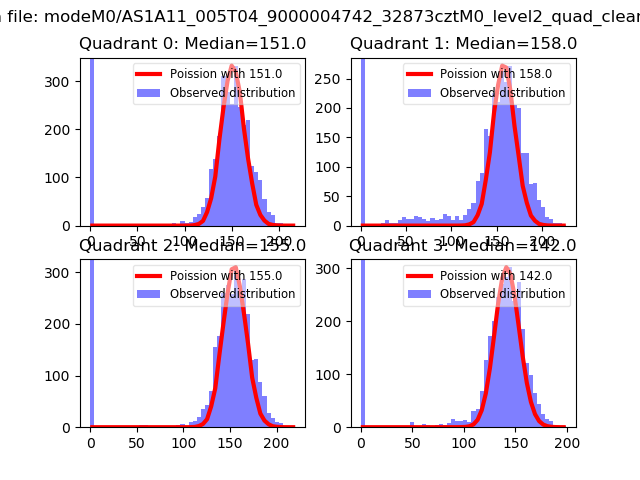 |
 |
| Quadrant-wise count rates Data is divided into 100 sec bins |
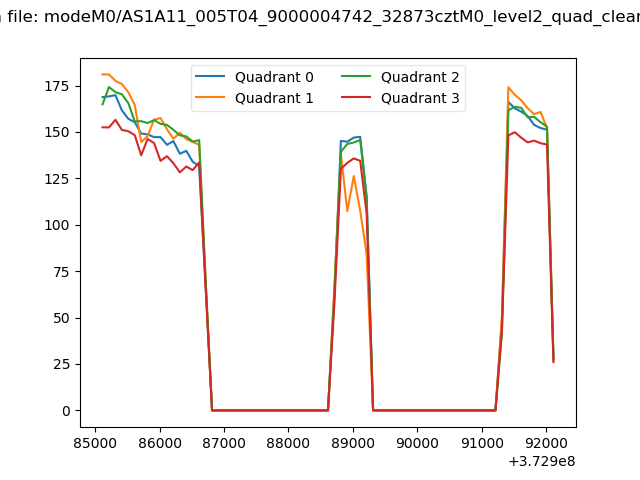 |
|
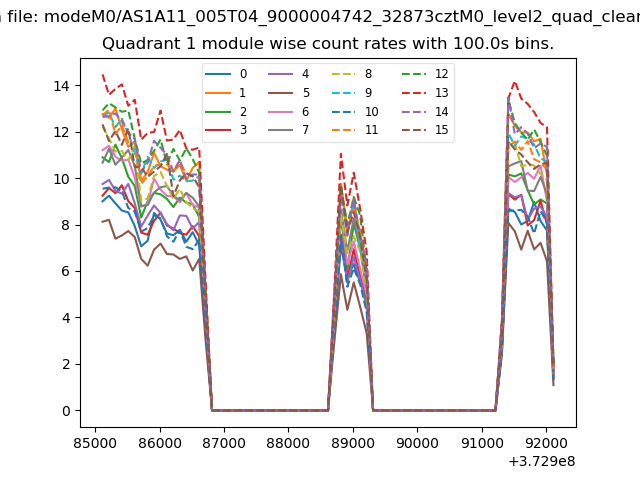
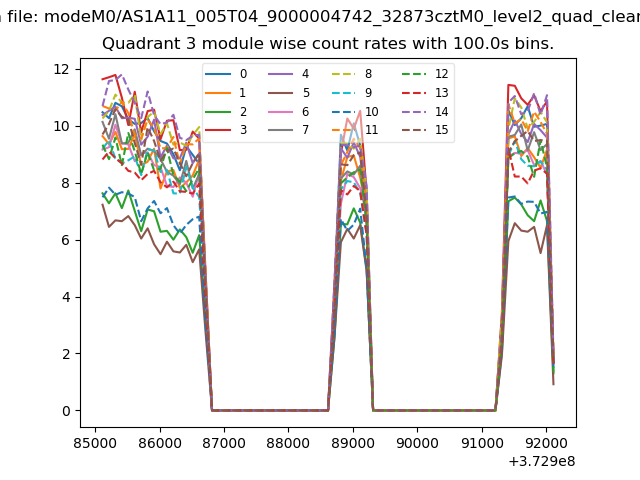
| Module-wise count rates for Quadrant A Data is divided into 100 sec bins |
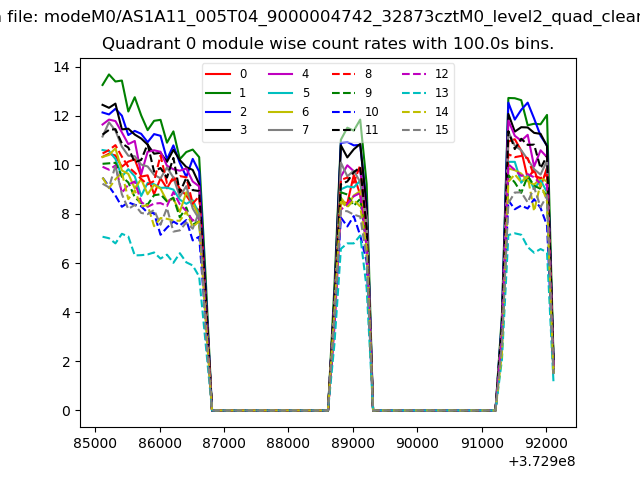 |
 |
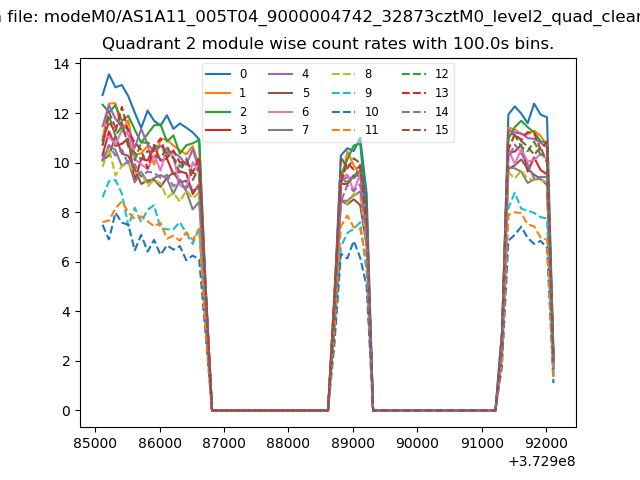
| Module-wise count rates for Quadrant B Data is divided into 100 sec bins |
 |
 |
| Module-wise count rates for Quadrant C Data is divided into 100 sec bins |
 |
 |
| Module-wise count rates for Quadrant D Data is divided into 100 sec bins |
 |
 |
| Parameter | Plot |
|---|---|
| CZT HV Monitor | 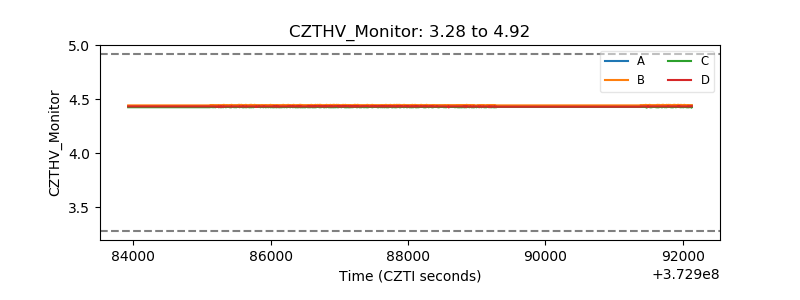 |
| D_VDD | 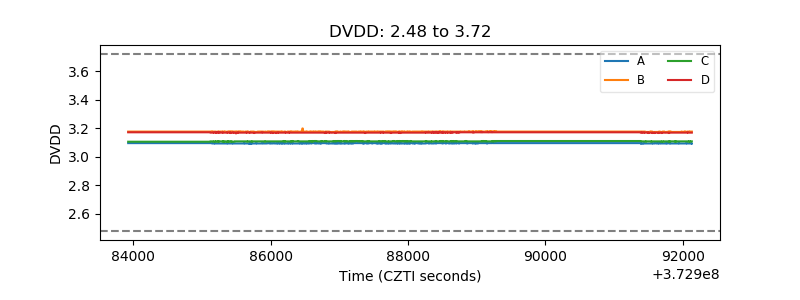 |
| Temperature 1 | 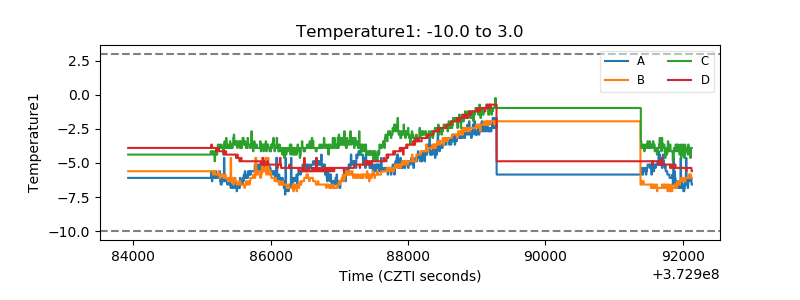 |
| Veto HV Monitor |  |
| Veto LLD | 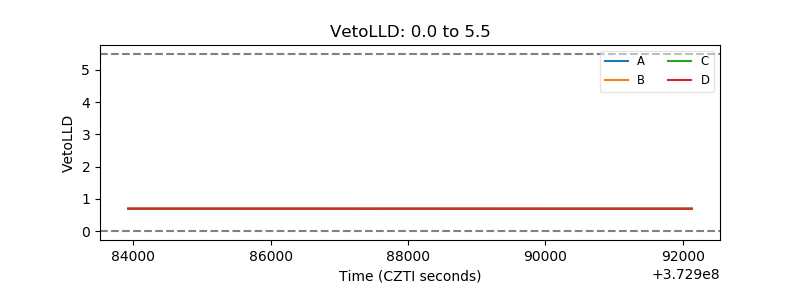 |
| Alpha Counter | 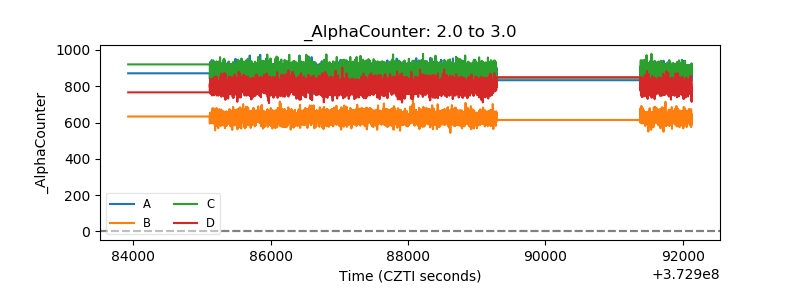 |
| _CPM_Rate | 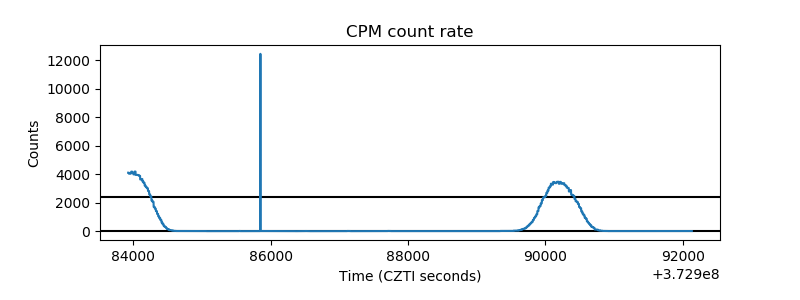 |
| CZT Counter | 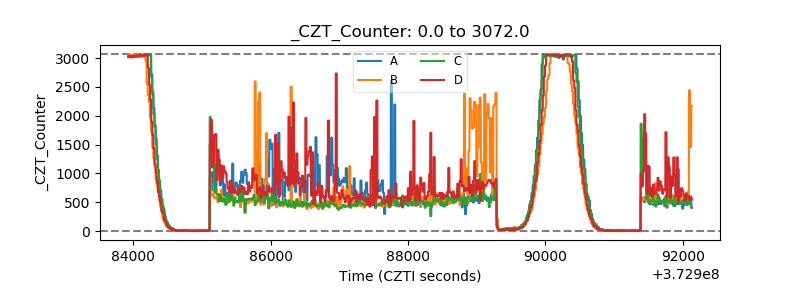 |
| +2.5 Volts monitor | 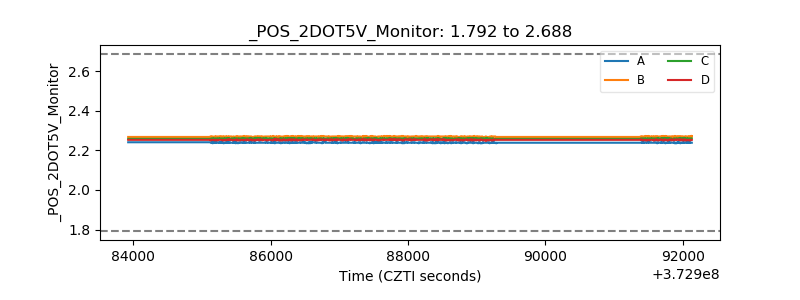 |
| +5 Volts monitor | 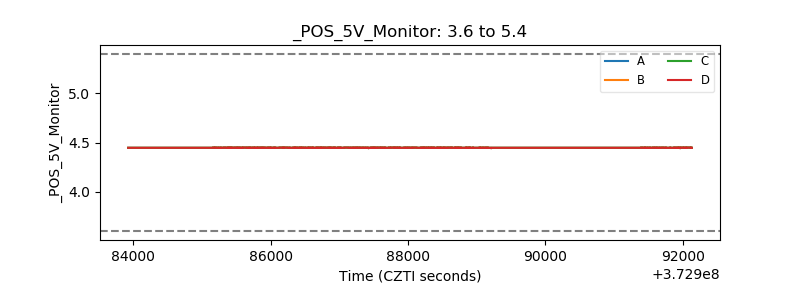 |
| _ROLL_ROT | 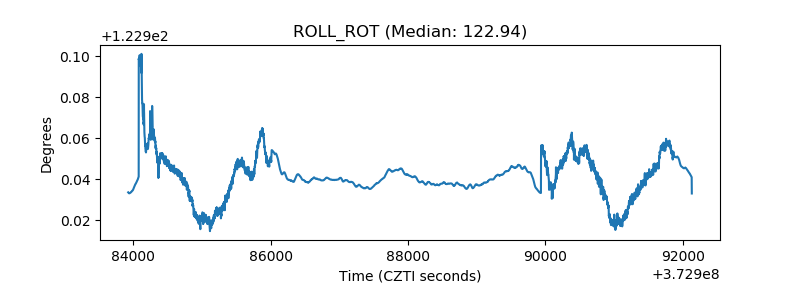 |
| _Roll_DEC | 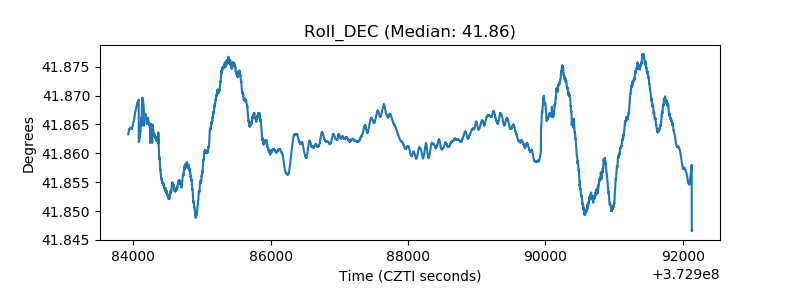 |
| _Roll_RA | 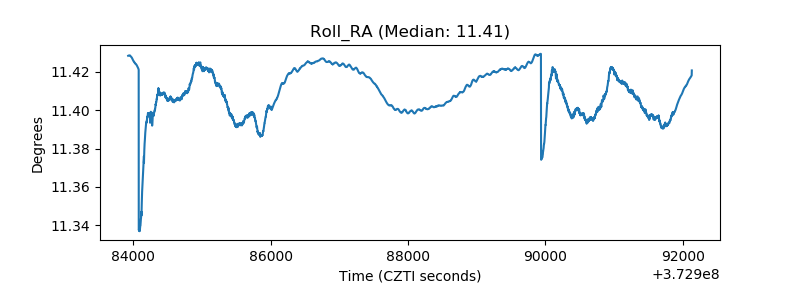 |
| Veto Counter | 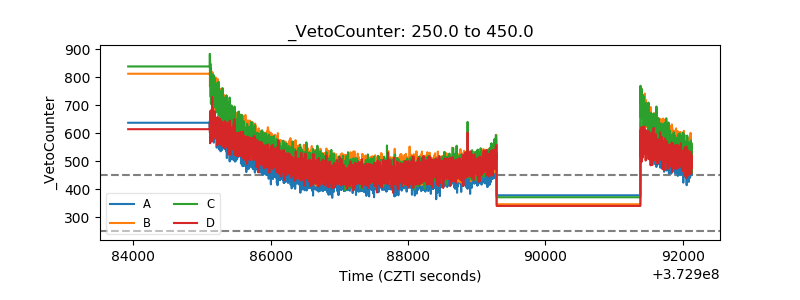 |