| Param | Original file | Final file |
|---|---|---|
| Filename | modeM0/AS1A11_005T04_9000004742_32875cztM0_level2.evt | modeM0/AS1A11_005T04_9000004742_32875cztM0_level2_quad_clean.evt |
| Size (bytes) | 379,728,000 | 50,425,920 |
| Size | 362.1 MB | 48.1 MB |
| Events in quadrant A | 2,193,276 | 310,696 |
| Events in quadrant B | 3,034,170 | 309,141 |
| Events in quadrant C | 2,374,747 | 303,484 |
| Events in quadrant D | 3,582,865 | 277,689 |
| Mode M9 | |||
|---|---|---|---|
| Quadrant | BADHDUFLAG | Total packets | Discarded packets |
| A | 0 | 29 | 0 |
| B | 0 | 29 | 0 |
| C | 0 | 29 | 0 |
| D | 0 | 30 | 0 |
| Mode M0 | |||
|---|---|---|---|
| Quadrant | BADHDUFLAG | Total packets | Discarded packets |
| A | 0 | 10054 | 657 |
| B | 0 | 12906 | 989 |
| C | 0 | 10638 | 706 |
| D | 0 | 14755 | 939 |
| Mode SS | |||
|---|---|---|---|
| Quadrant | BADHDUFLAG | Total packets | Discarded packets |
| A | 0 | 102 | 4 |
| B | 0 | 101 | 9 |
| C | 0 | 101 | 5 |
| D | 0 | 102 | 6 |
| Quadrant | Total seconds | Saturated seconds | Saturation percentage |
|---|---|---|---|
| A | 4651 | 10 | 0.215008% |
| B | 4615 | 223 | 4.832069% |
| C | 4629 | 40 | 0.864118% |
| D | 4611 | 162 | 3.513338% |
Noise dominated data is calculated using 1-second bins in cleaned event files. If a bin has >2000 counts, and if more than 50% of those come from <1% of pixels, then it is considered to be noise-dominated and hence unusable.
| Quadrant | # 1 sec bins | Bins with >0 counts | Bins with >2000 counts | High rate bins dominated by noise | Noise dominated (total time) | Noise dominated (detector-on time) | Marked lightcurve |
|---|---|---|---|---|---|---|---|
| A | 7073 | 4722 | 0 | 0 | 0.00% | 0.00% | 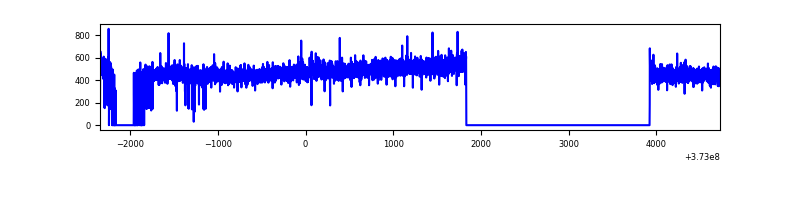 |
| B | 7073 | 4687 | 136 | 136 | 1.92% | 2.90% | 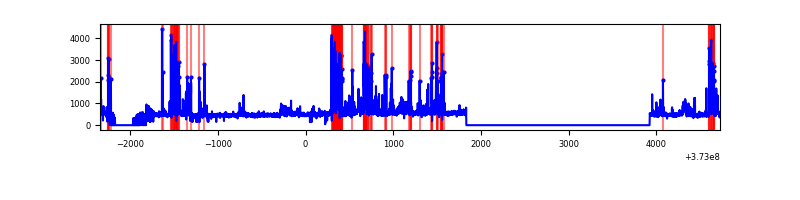 |
| C | 7073 | 4696 | 30 | 30 | 0.42% | 0.64% | 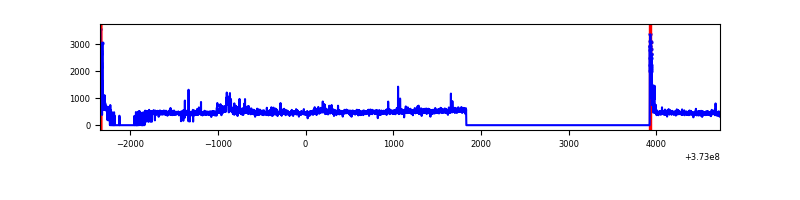 |
| D | 7073 | 4681 | 107 | 107 | 1.51% | 2.29% | 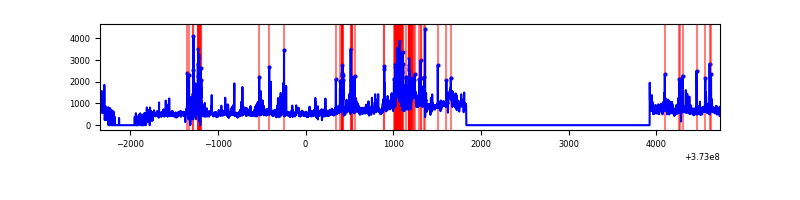 |
Top three noisy pixels from each quadrant. If the there are fewer than three noisy pixels in the level2.evt file, extra rows are filled as -1
| Pixel properties | Quadrant properties | ||||||
|---|---|---|---|---|---|---|---|
| Quadrant | DetID | PixID | Counts | Sigma | Mean | Median | Sigma |
| A | 14 | 63 | 15639 | 134.57 | 560 | 551 | 112.1 |
| A | 13 | 254 | 8602 | 71.81 | 560 | 551 | 112.1 |
| A | 13 | 6 | 8091 | 67.25 | 560 | 551 | 112.1 |
| B | 5 | 172 | 634105 | 6082.92 | 550 | 537 | 104.2 |
| B | 0 | 197 | 61293 | 583.32 | 550 | 537 | 104.2 |
| B | 0 | 230 | 51180 | 486.22 | 550 | 537 | 104.2 |
| C | 0 | 10 | 126672 | 1024.5 | 535 | 540 | 123.1 |
| C | 3 | 233 | 120671 | 975.76 | 535 | 540 | 123.1 |
| C | 14 | 67 | 19826 | 156.65 | 535 | 540 | 123.1 |
| D | 8 | 195 | 402363 | 3047.8 | 522 | 509 | 131.9 |
| D | 2 | 250 | 343408 | 2600.66 | 522 | 509 | 131.9 |
| D | 10 | 203 | 339089 | 2567.91 | 522 | 509 | 131.9 |
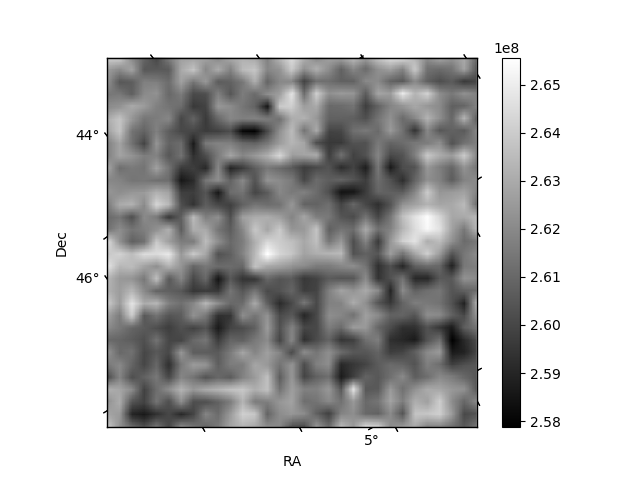
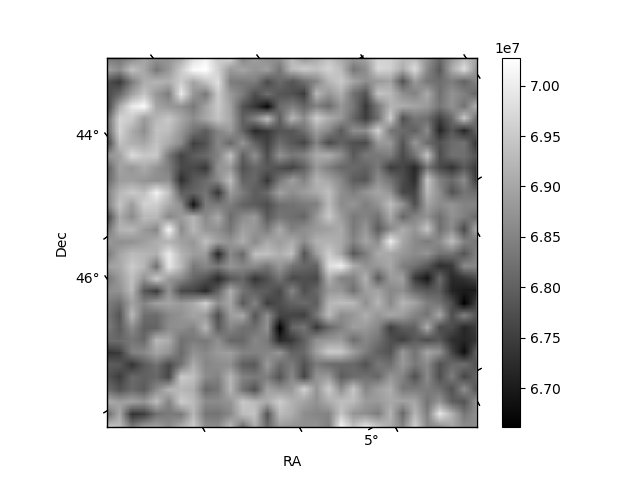
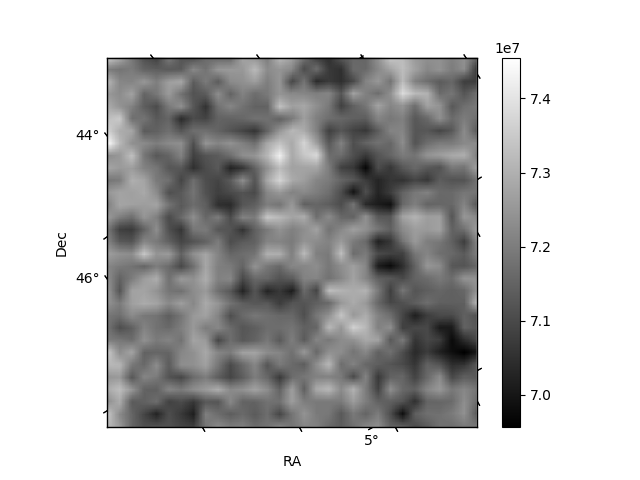
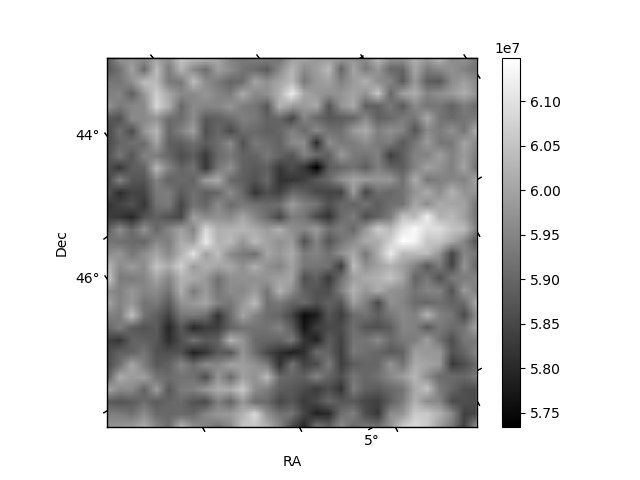
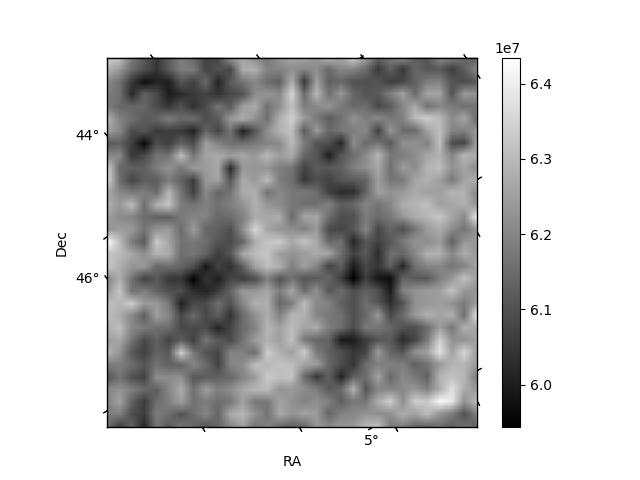
Histogram calculated using DETX and DETY for each event in the final _common_clean file
| Quadrant A | 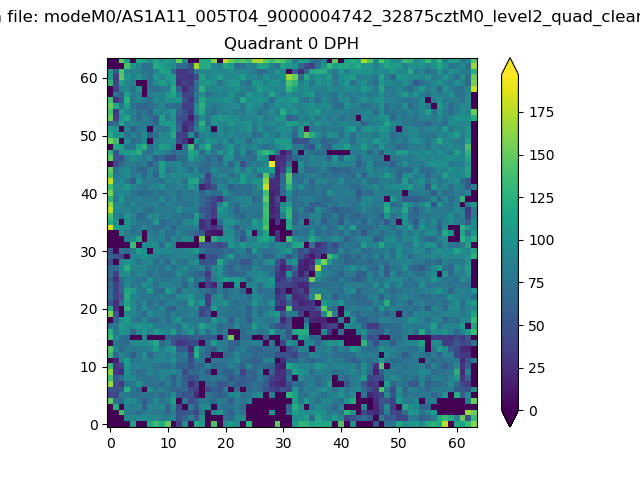 |
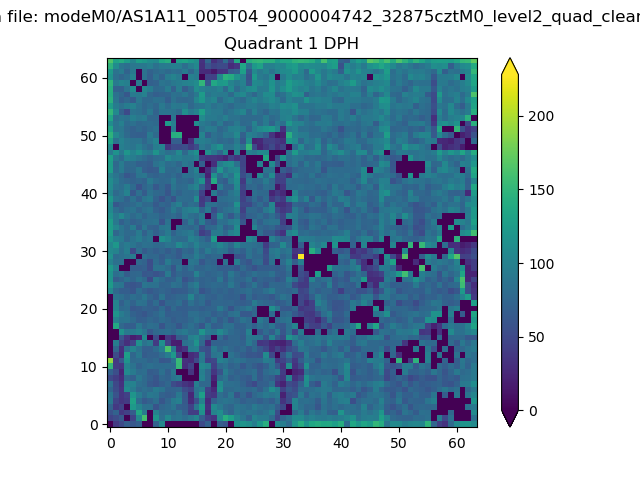 |
Quadrant B |
|---|---|---|---|
| Quadrant D | 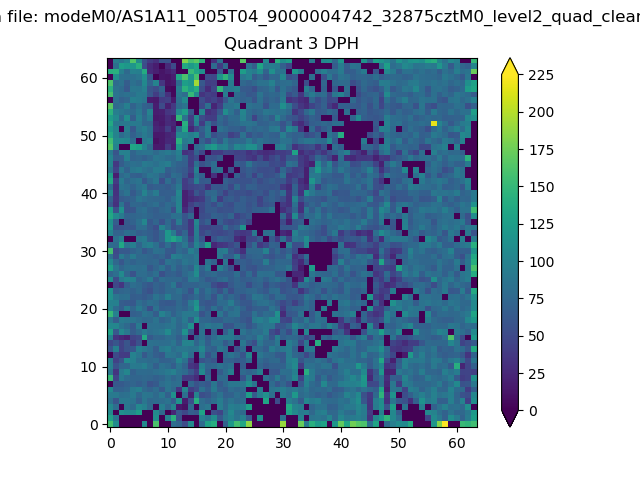 |
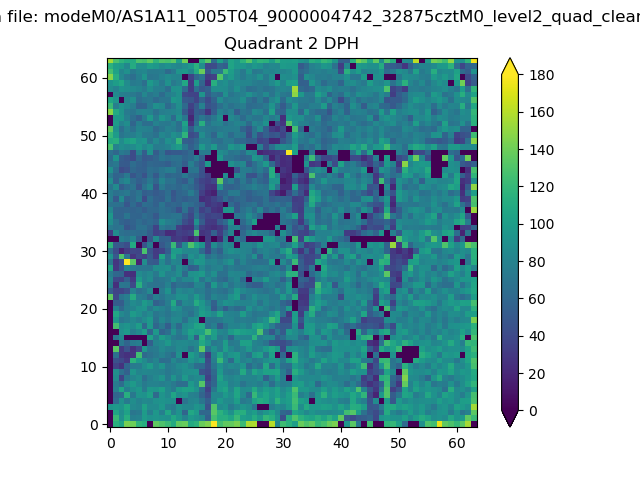 |
Quadrant C |
| Plot type | Count rate plots | Images |
|---|---|---|
| Comparison with Poisson distribution Blue bars denote a histogram of data divided into 1 sec bins. Red curve is a Poisson curve with rate = median count rate of data. |
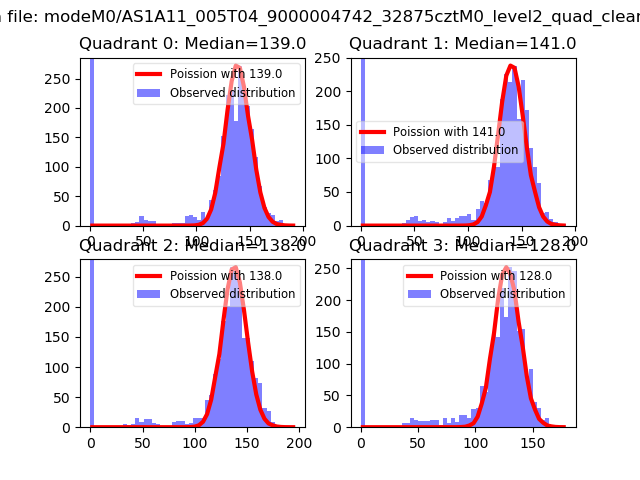 |
 |
| Quadrant-wise count rates Data is divided into 100 sec bins |
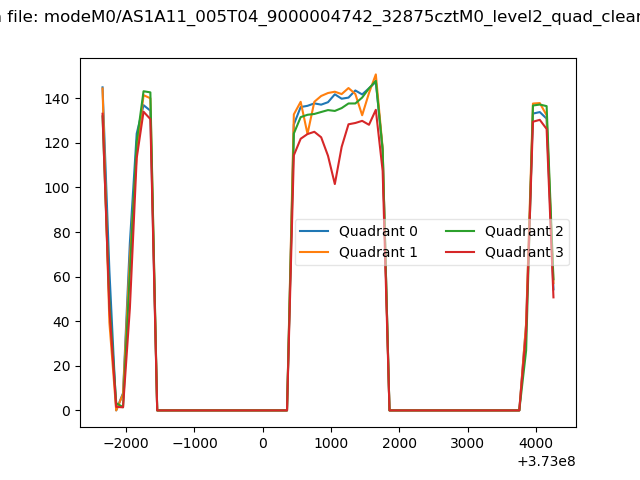 |
|
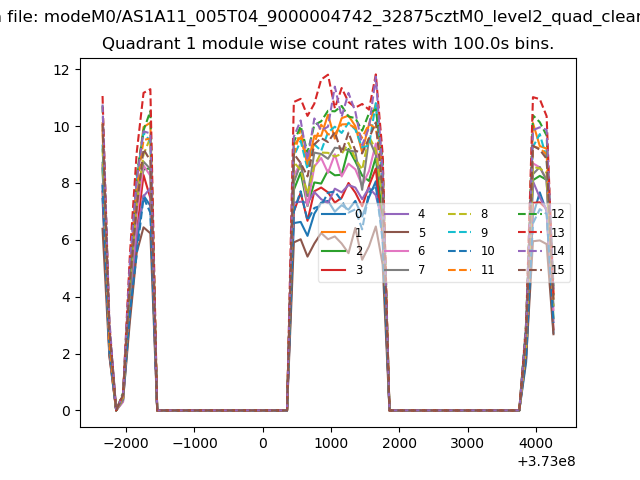
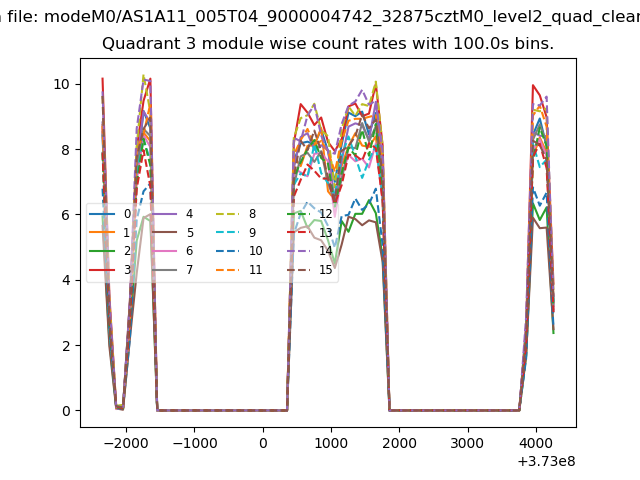
| Module-wise count rates for Quadrant A Data is divided into 100 sec bins |
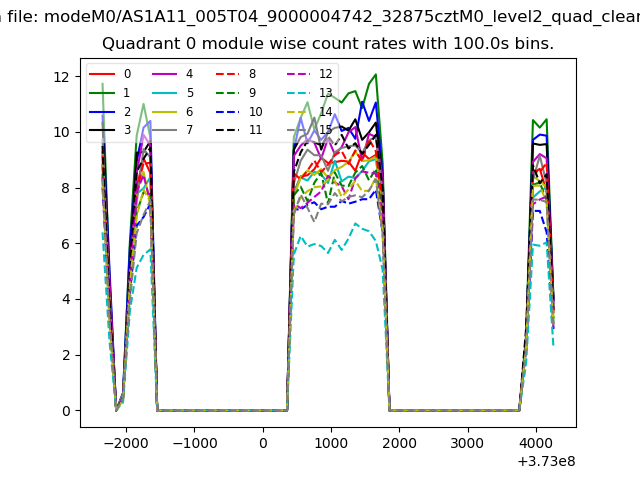 |
 |
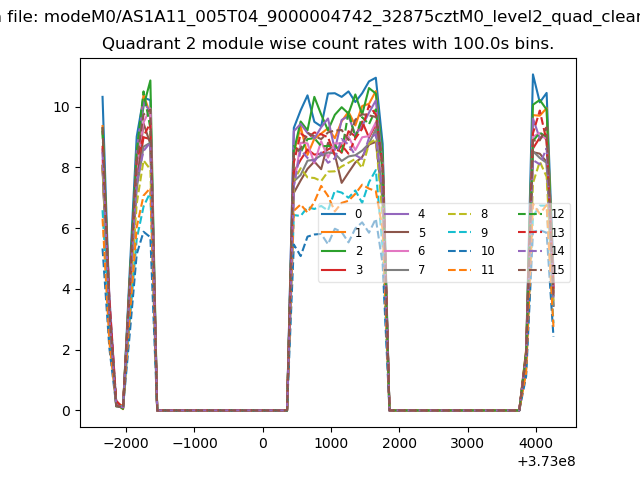
| Module-wise count rates for Quadrant B Data is divided into 100 sec bins |
 |
 |
| Module-wise count rates for Quadrant C Data is divided into 100 sec bins |
 |
 |
| Module-wise count rates for Quadrant D Data is divided into 100 sec bins |
 |
 |
| Parameter | Plot |
|---|---|
| CZT HV Monitor | 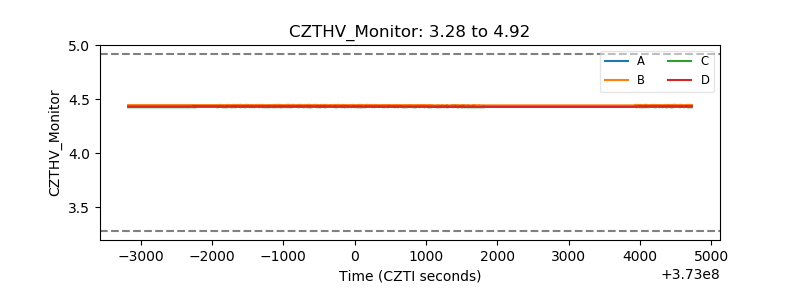 |
| D_VDD | 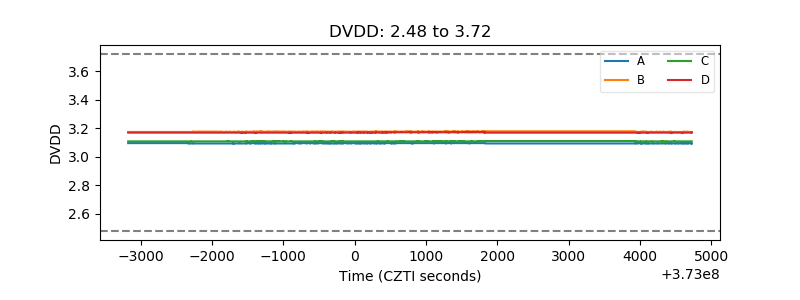 |
| Temperature 1 | 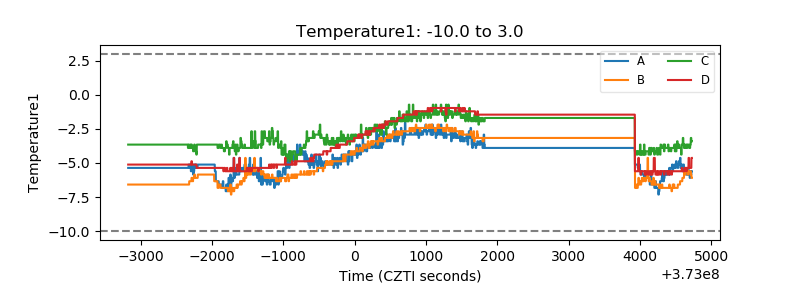 |
| Veto HV Monitor | 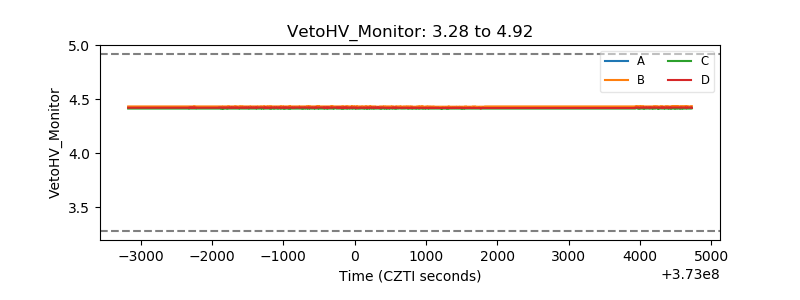 |
| Veto LLD | 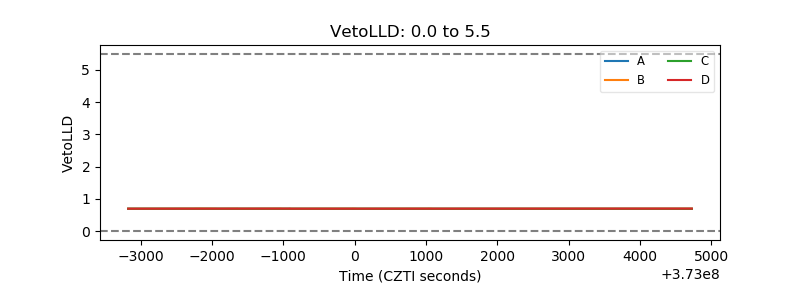 |
| Alpha Counter | 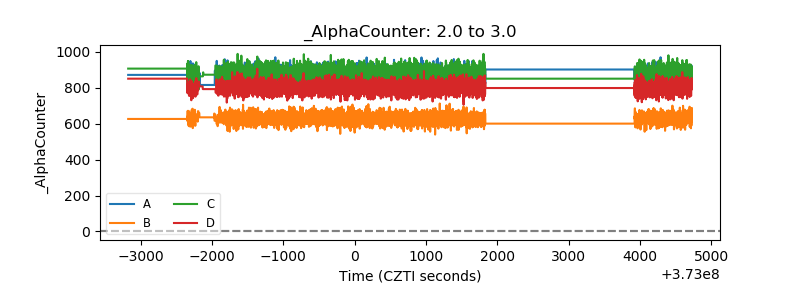 |
| _CPM_Rate | 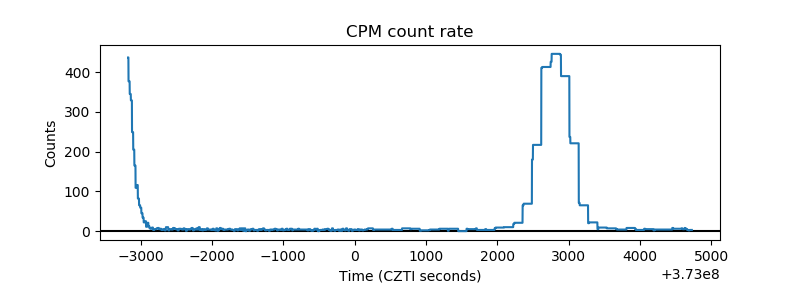 |
| CZT Counter | 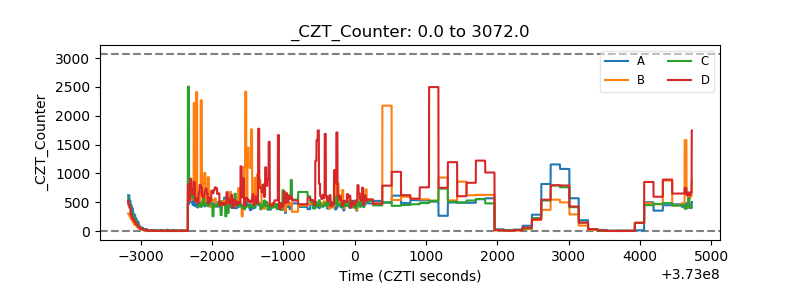 |
| +2.5 Volts monitor |  |
| +5 Volts monitor |  |
| _ROLL_ROT | 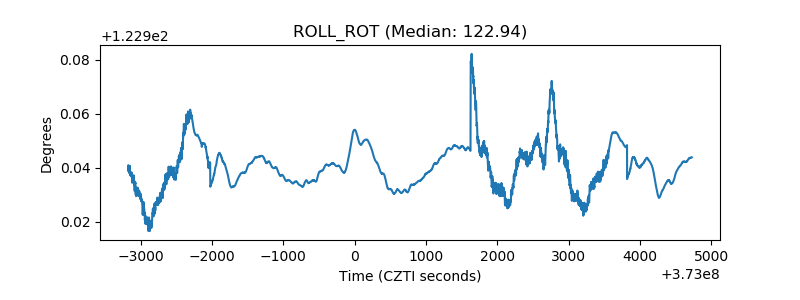 |
| _Roll_DEC | 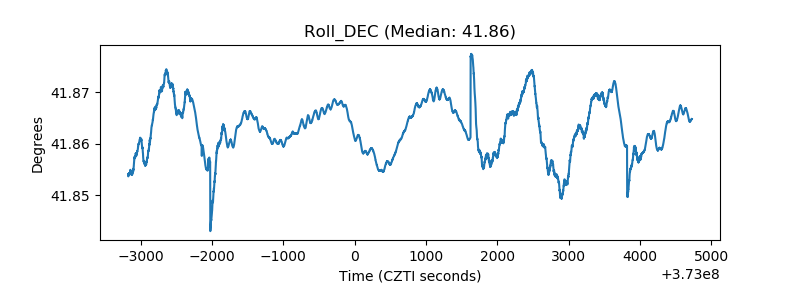 |
| _Roll_RA | 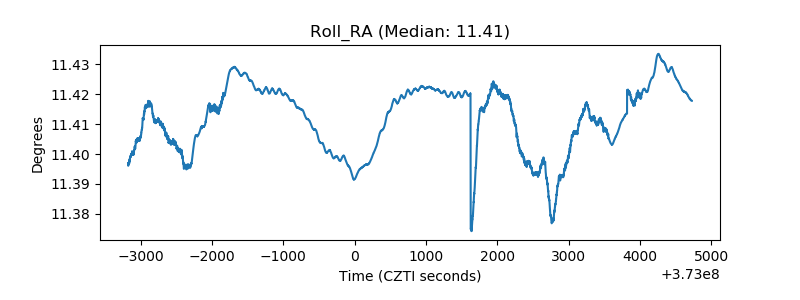 |
| Veto Counter | 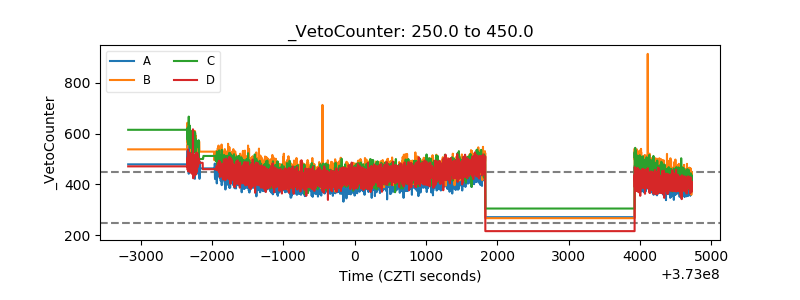 |