| Param | Original file | Final file |
|---|---|---|
| Filename | modeM0/AS1A11_005T04_9000004742_32877cztM0_level2.evt | modeM0/AS1A11_005T04_9000004742_32877cztM0_level2_quad_clean.evt |
| Size (bytes) | 534,810,240 | 70,038,720 |
| Size | 510.0 MB | 66.8 MB |
| Events in quadrant A | 2,863,928 | 438,489 |
| Events in quadrant B | 4,341,898 | 426,329 |
| Events in quadrant C | 3,183,673 | 439,178 |
| Events in quadrant D | 5,392,637 | 389,018 |
| Mode M9 | |||
|---|---|---|---|
| Quadrant | BADHDUFLAG | Total packets | Discarded packets |
| A | 0 | 33 | 0 |
| B | 0 | 33 | 0 |
| C | 0 | 33 | 0 |
| D | 0 | 33 | 0 |
| Mode M0 | |||
|---|---|---|---|
| Quadrant | BADHDUFLAG | Total packets | Discarded packets |
| A | 0 | 12407 | 3 |
| B | 0 | 16753 | 2 |
| C | 0 | 13342 | 2 |
| D | 0 | 20232 | 2 |
| Mode SS | |||
|---|---|---|---|
| Quadrant | BADHDUFLAG | Total packets | Discarded packets |
| A | 0 | 128 | 0 |
| B | 0 | 128 | 0 |
| C | 0 | 128 | 0 |
| D | 0 | 128 | 0 |
| Quadrant | Total seconds | Saturated seconds | Saturation percentage |
|---|---|---|---|
| A | 6113 | 5 | 0.081793% |
| B | 6113 | 456 | 7.459513% |
| C | 6113 | 67 | 1.096025% |
| D | 6113 | 461 | 7.541305% |
Noise dominated data is calculated using 1-second bins in cleaned event files. If a bin has >2000 counts, and if more than 50% of those come from <1% of pixels, then it is considered to be noise-dominated and hence unusable.
| Quadrant | # 1 sec bins | Bins with >0 counts | Bins with >2000 counts | High rate bins dominated by noise | Noise dominated (total time) | Noise dominated (detector-on time) | Marked lightcurve |
|---|---|---|---|---|---|---|---|
| A | 9489 | 6115 | 5 | 5 | 0.05% | 0.08% | 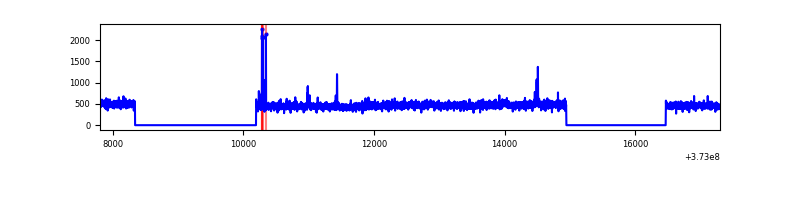 |
| B | 9489 | 6115 | 309 | 309 | 3.26% | 5.05% | 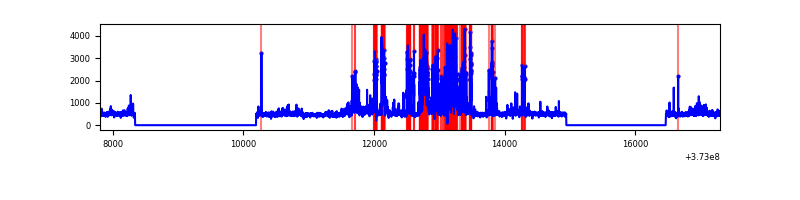 |
| C | 9489 | 6115 | 59 | 59 | 0.62% | 0.96% | 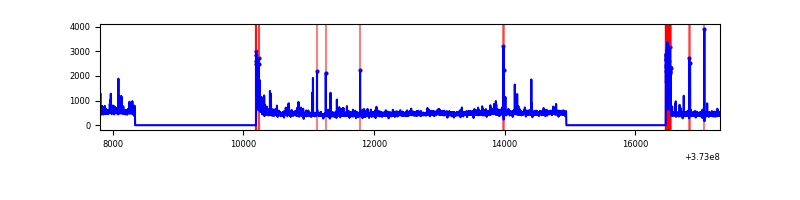 |
| D | 9489 | 6115 | 391 | 391 | 4.12% | 6.39% | 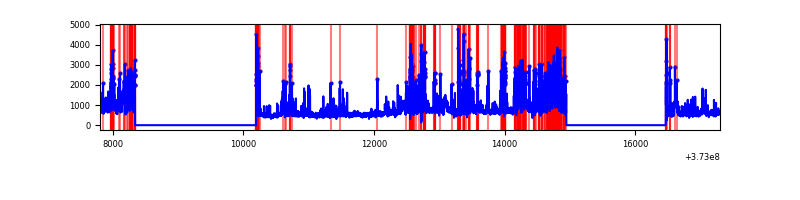 |
Top three noisy pixels from each quadrant. If the there are fewer than three noisy pixels in the level2.evt file, extra rows are filled as -1
| Pixel properties | Quadrant properties | ||||||
|---|---|---|---|---|---|---|---|
| Quadrant | DetID | PixID | Counts | Sigma | Mean | Median | Sigma |
| A | 14 | 63 | 45399 | 310.45 | 718 | 703 | 144.0 |
| A | 11 | 29 | 25633 | 173.16 | 718 | 703 | 144.0 |
| A | 13 | 6 | 13373 | 88.0 | 718 | 703 | 144.0 |
| B | 5 | 172 | 1174338 | 8698.48 | 701 | 684 | 134.9 |
| B | 0 | 197 | 201641 | 1489.38 | 701 | 684 | 134.9 |
| B | 0 | 219 | 79792 | 586.3 | 701 | 684 | 134.9 |
| C | 0 | 10 | 187663 | 1150.59 | 701 | 706 | 162.5 |
| C | 3 | 233 | 140223 | 858.63 | 701 | 706 | 162.5 |
| C | 1 | 241 | 55226 | 335.53 | 701 | 706 | 162.5 |
| D | 8 | 195 | 854434 | 5083.99 | 673 | 656 | 167.9 |
| D | 12 | 218 | 587489 | 3494.42 | 673 | 656 | 167.9 |
| D | 7 | 80 | 474346 | 2820.68 | 673 | 656 | 167.9 |
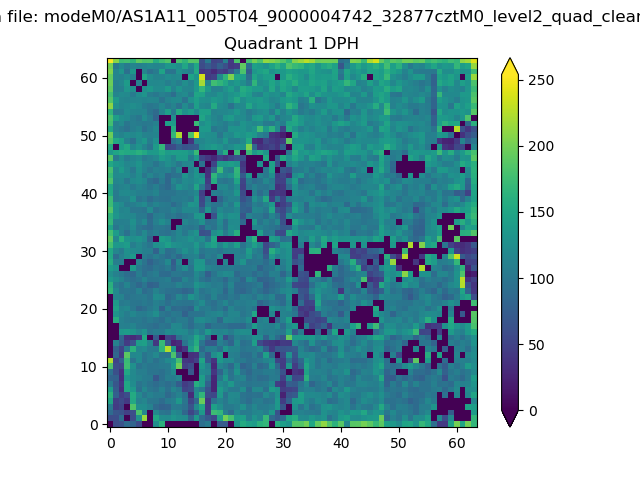
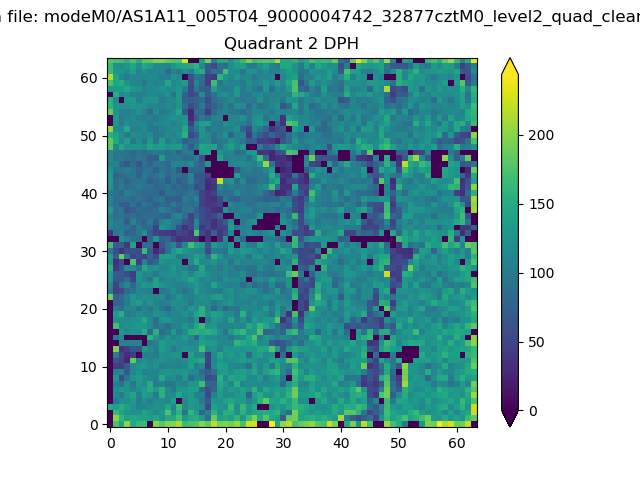
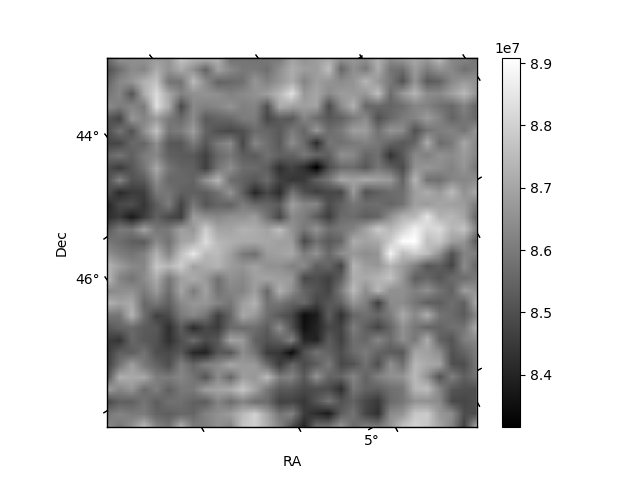
Histogram calculated using DETX and DETY for each event in the final _common_clean file
| Quadrant A |  |
 |
Quadrant B |
|---|---|---|---|
| Quadrant D |  |
 |
Quadrant C |
| Plot type | Count rate plots | Images |
|---|---|---|
| Comparison with Poisson distribution Blue bars denote a histogram of data divided into 1 sec bins. Red curve is a Poisson curve with rate = median count rate of data. |
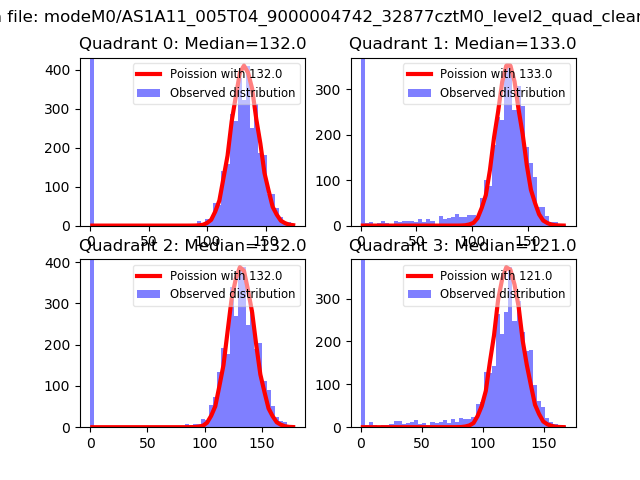 |
 |
| Quadrant-wise count rates Data is divided into 100 sec bins |
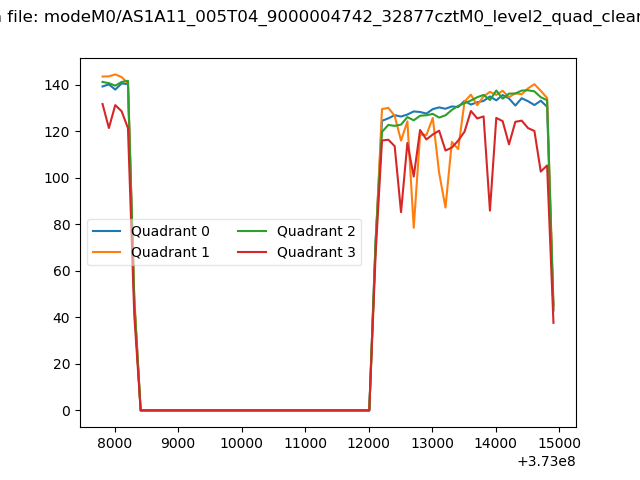 |
|
| Module-wise count rates for Quadrant A Data is divided into 100 sec bins |
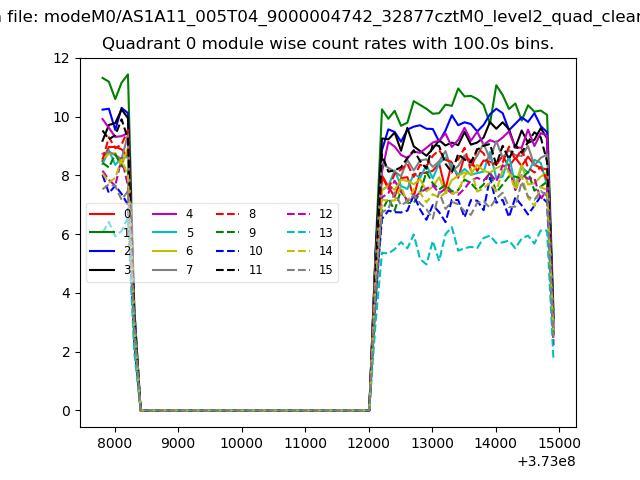 |
 |
| Module-wise count rates for Quadrant B Data is divided into 100 sec bins |
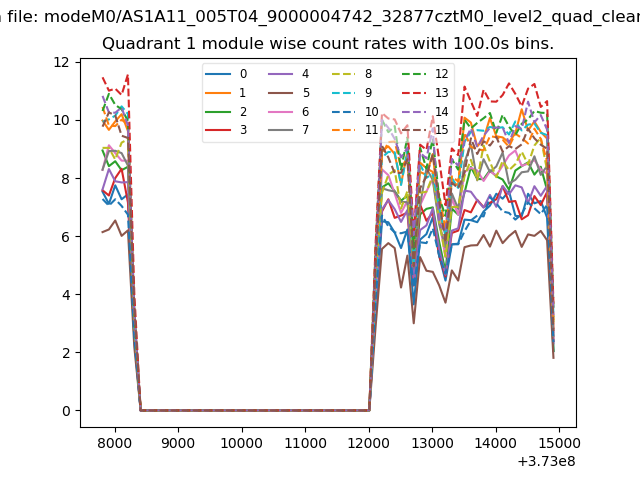 |
 |
| Module-wise count rates for Quadrant C Data is divided into 100 sec bins |
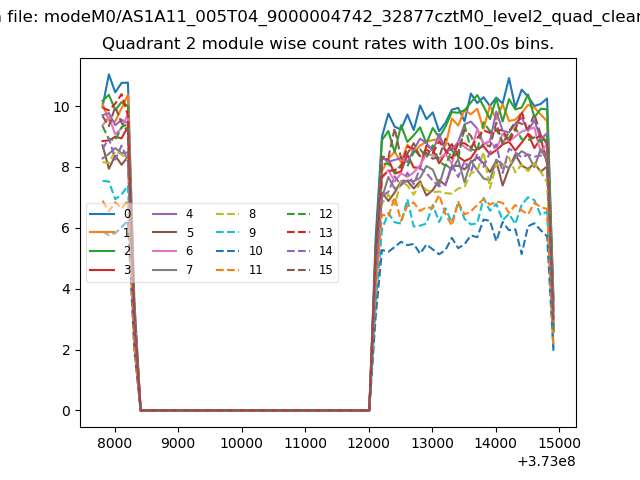 |
 |
| Module-wise count rates for Quadrant D Data is divided into 100 sec bins |
 |
 |
| Parameter | Plot |
|---|---|
| CZT HV Monitor | 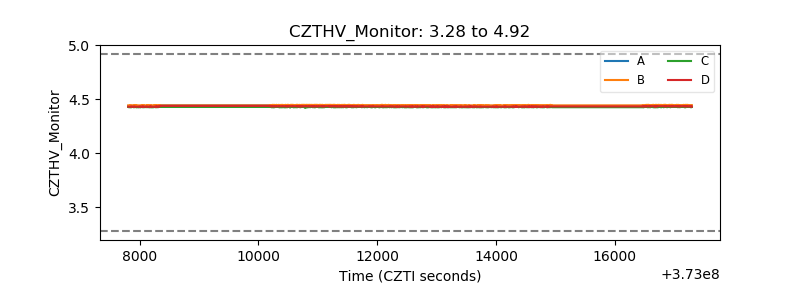 |
| D_VDD | 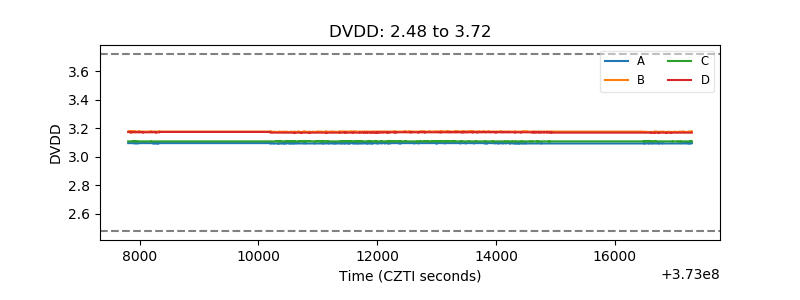 |
| Temperature 1 | 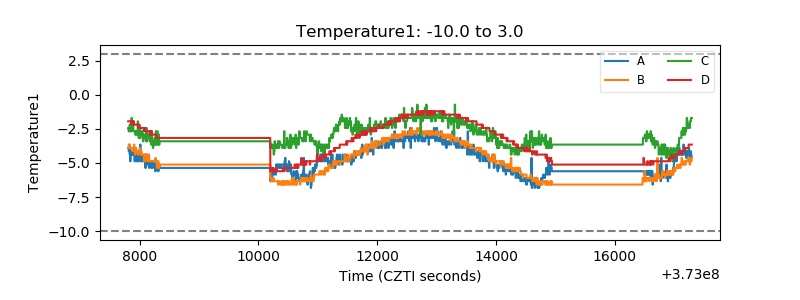 |
| Veto HV Monitor | 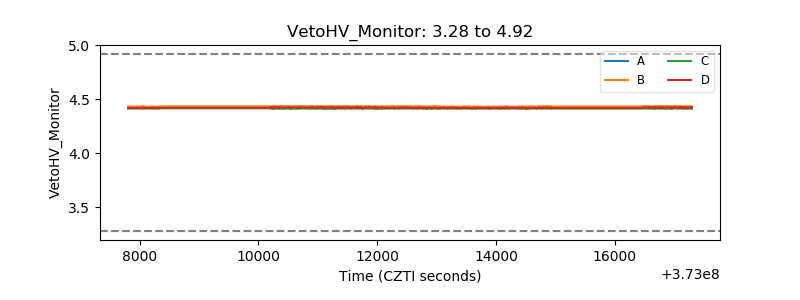 |
| Veto LLD | 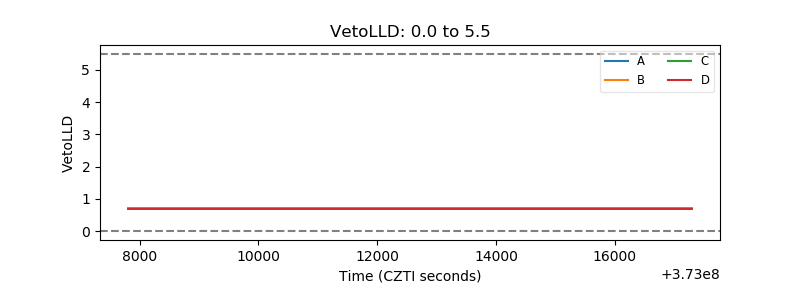 |
| Alpha Counter | 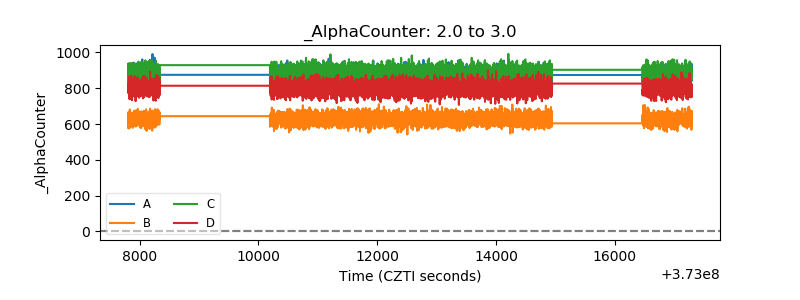 |
| _CPM_Rate | 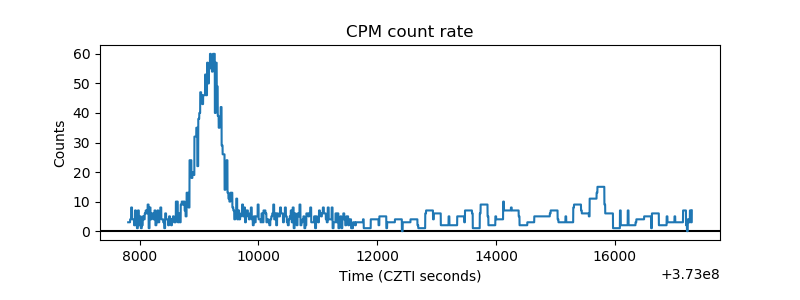 |
| CZT Counter |  |
| +2.5 Volts monitor |  |
| +5 Volts monitor |  |
| _ROLL_ROT | 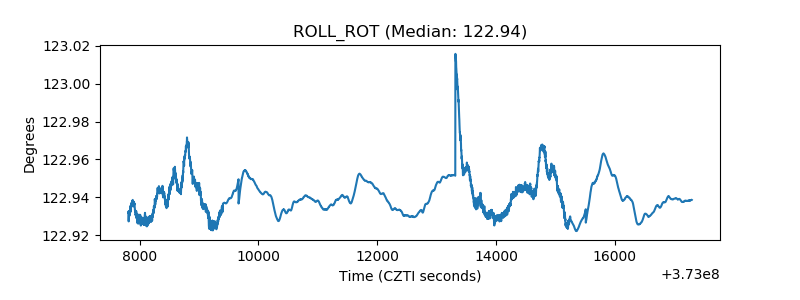 |
| _Roll_DEC | 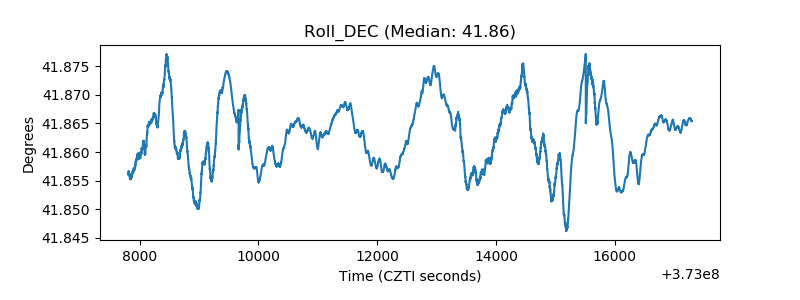 |
| _Roll_RA | 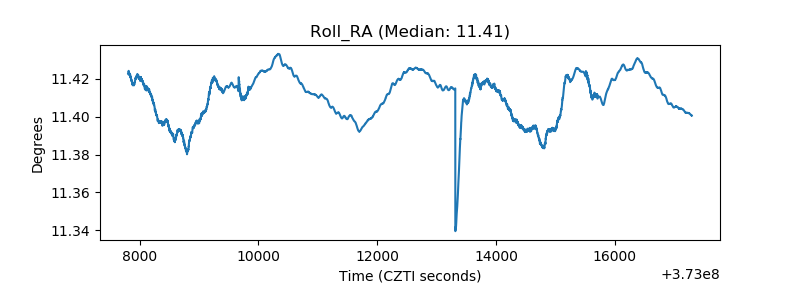 |
| Veto Counter | 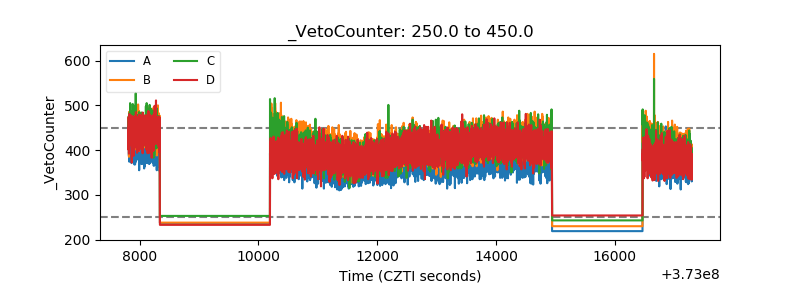 |