| Param | Original file | Final file |
|---|---|---|
| Filename | modeM0/AS1A11_005T04_9000004742_32882cztM0_level2.evt | modeM0/AS1A11_005T04_9000004742_32882cztM0_level2_quad_clean.evt |
| Size (bytes) | 384,166,080 | 46,056,960 |
| Size | 366.4 MB | 43.9 MB |
| Events in quadrant A | 1,777,774 | 301,535 |
| Events in quadrant B | 4,196,044 | 241,823 |
| Events in quadrant C | 2,137,740 | 298,185 |
| Events in quadrant D | 3,256,688 | 276,240 |
| Mode M9 | |||
|---|---|---|---|
| Quadrant | BADHDUFLAG | Total packets | Discarded packets |
| A | 0 | 15 | 0 |
| B | 0 | 15 | 0 |
| C | 0 | 15 | 0 |
| D | 0 | 15 | 0 |
| Mode M0 | |||
|---|---|---|---|
| Quadrant | BADHDUFLAG | Total packets | Discarded packets |
| A | 0 | 7884 | 1 |
| B | 0 | 15009 | 1 |
| C | 0 | 8843 | 1 |
| D | 0 | 12371 | 1 |
| Mode SS | |||
|---|---|---|---|
| Quadrant | BADHDUFLAG | Total packets | Discarded packets |
| A | 0 | 80 | 0 |
| B | 0 | 80 | 0 |
| C | 0 | 80 | 0 |
| D | 0 | 80 | 0 |
| Quadrant | Total seconds | Saturated seconds | Saturation percentage |
|---|---|---|---|
| A | 3909 | 5 | 0.127910% |
| B | 3909 | 1065 | 27.244820% |
| C | 3909 | 56 | 1.432591% |
| D | 3909 | 187 | 4.783832% |
Noise dominated data is calculated using 1-second bins in cleaned event files. If a bin has >2000 counts, and if more than 50% of those come from <1% of pixels, then it is considered to be noise-dominated and hence unusable.
| Quadrant | # 1 sec bins | Bins with >0 counts | Bins with >2000 counts | High rate bins dominated by noise | Noise dominated (total time) | Noise dominated (detector-on time) | Marked lightcurve |
|---|---|---|---|---|---|---|---|
| A | 5432 | 3910 | 0 | 0 | 0.00% | 0.00% | 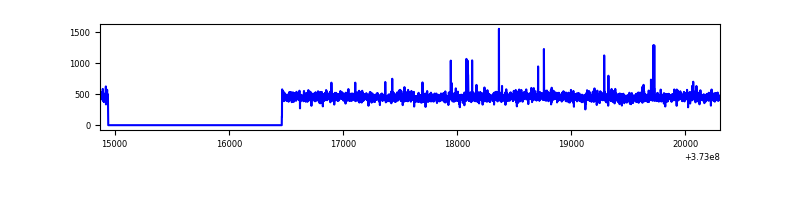 |
| B | 5432 | 3910 | 763 | 763 | 14.05% | 19.51% | 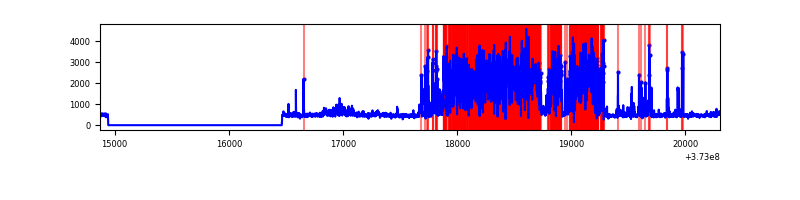 |
| C | 5432 | 3910 | 54 | 54 | 0.99% | 1.38% | 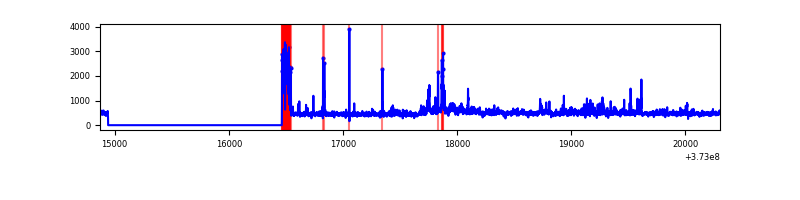 |
| D | 5432 | 3910 | 167 | 167 | 3.07% | 4.27% | 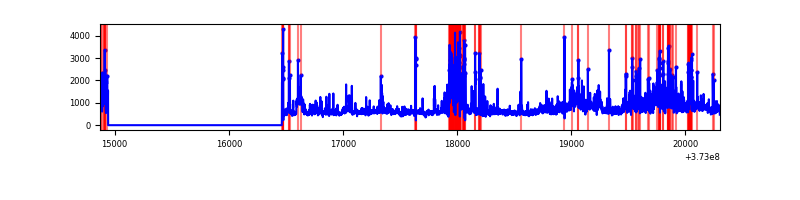 |
Top three noisy pixels from each quadrant. If the there are fewer than three noisy pixels in the level2.evt file, extra rows are filled as -1
| Pixel properties | Quadrant properties | ||||||
|---|---|---|---|---|---|---|---|
| Quadrant | DetID | PixID | Counts | Sigma | Mean | Median | Sigma |
| A | 14 | 63 | 14417 | 150.86 | 452 | 443 | 92.6 |
| A | 13 | 6 | 6946 | 70.2 | 452 | 443 | 92.6 |
| A | 13 | 254 | 6889 | 69.59 | 452 | 443 | 92.6 |
| B | 5 | 172 | 2506506 | 32592.83 | 395 | 385 | 76.9 |
| B | 0 | 197 | 72406 | 936.65 | 395 | 385 | 76.9 |
| B | 15 | 85 | 26720 | 342.49 | 395 | 385 | 76.9 |
| C | 3 | 233 | 192577 | 1888.46 | 435 | 439 | 101.7 |
| C | 0 | 10 | 163621 | 1603.86 | 435 | 439 | 101.7 |
| C | 1 | 241 | 69767 | 681.4 | 435 | 439 | 101.7 |
| D | 8 | 195 | 497936 | 4564.36 | 427 | 416 | 109.0 |
| D | 12 | 218 | 304462 | 2789.39 | 427 | 416 | 109.0 |
| D | 14 | 52 | 251965 | 2307.77 | 427 | 416 | 109.0 |
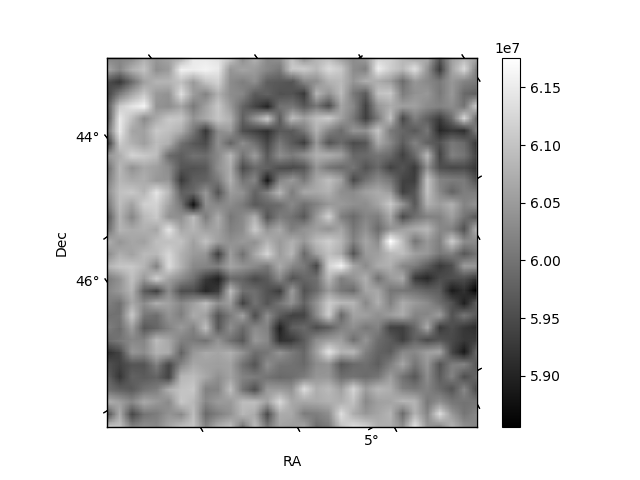
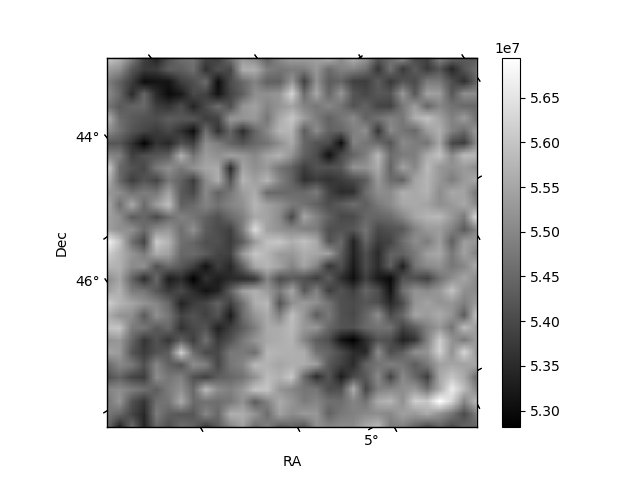
Histogram calculated using DETX and DETY for each event in the final _common_clean file
| Quadrant A | 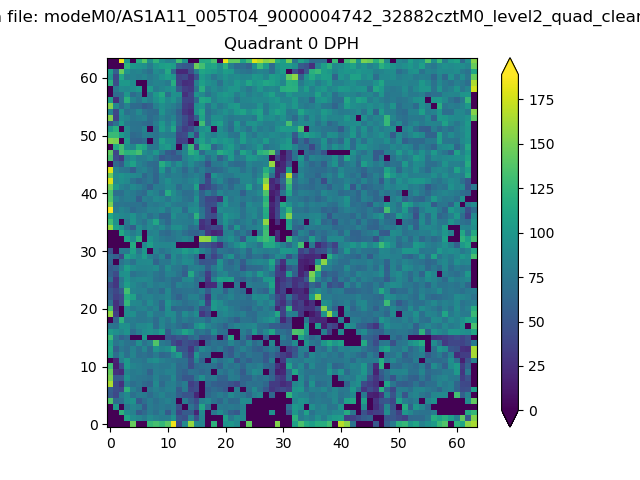 |
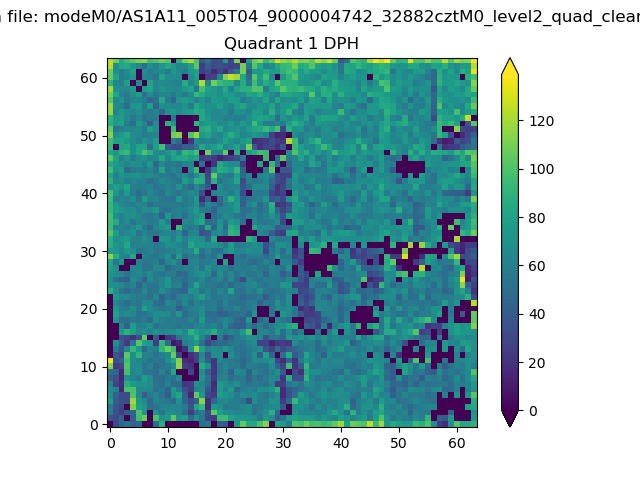 |
Quadrant B |
|---|---|---|---|
| Quadrant D | 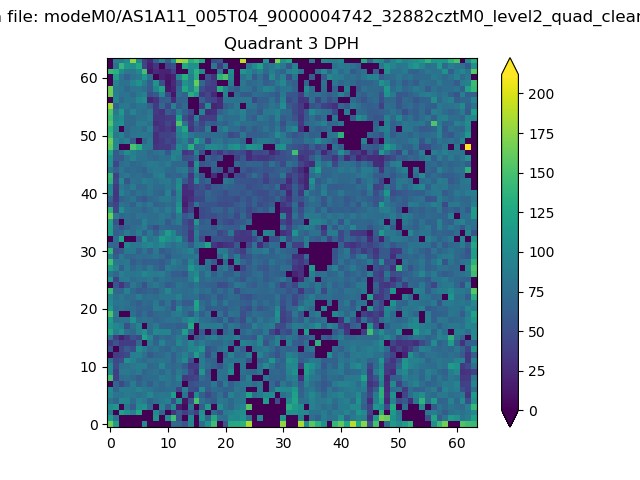 |
 |
Quadrant C |
| Plot type | Count rate plots | Images |
|---|---|---|
| Comparison with Poisson distribution Blue bars denote a histogram of data divided into 1 sec bins. Red curve is a Poisson curve with rate = median count rate of data. |
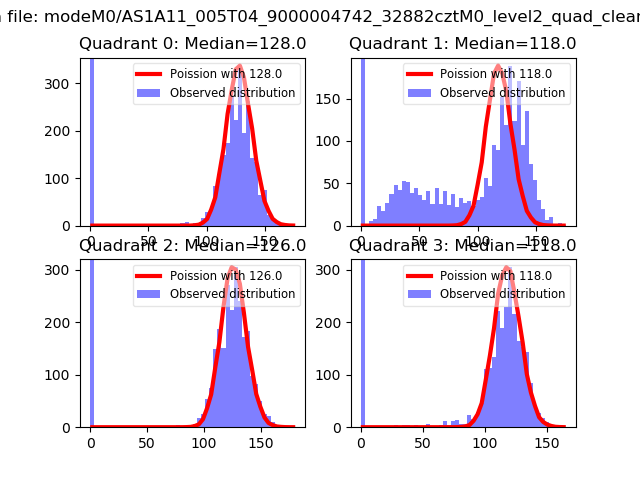 |
 |
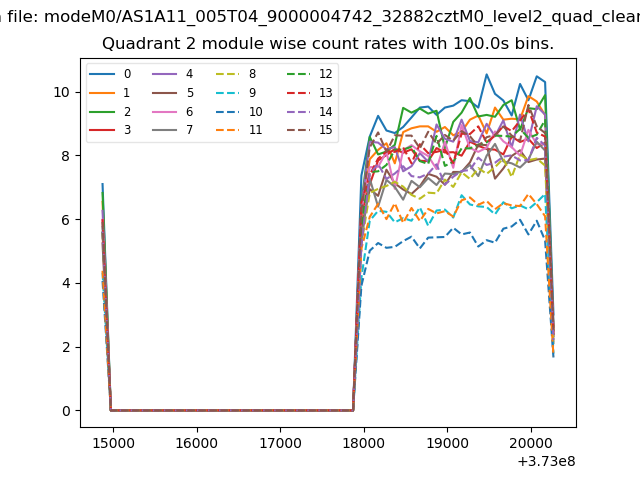
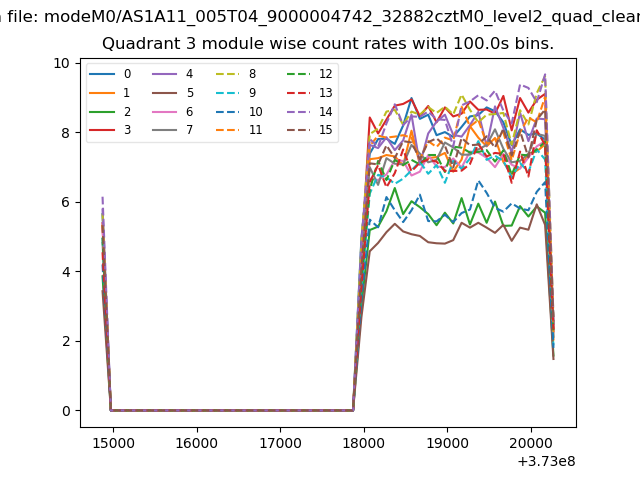
| Quadrant-wise count rates Data is divided into 100 sec bins |
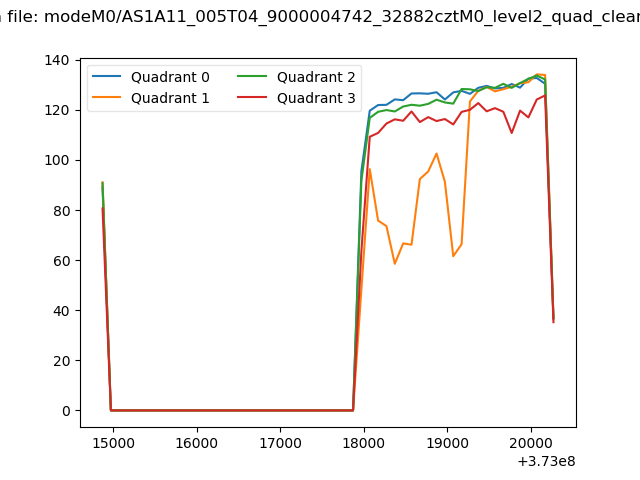 |
|
| Module-wise count rates for Quadrant A Data is divided into 100 sec bins |
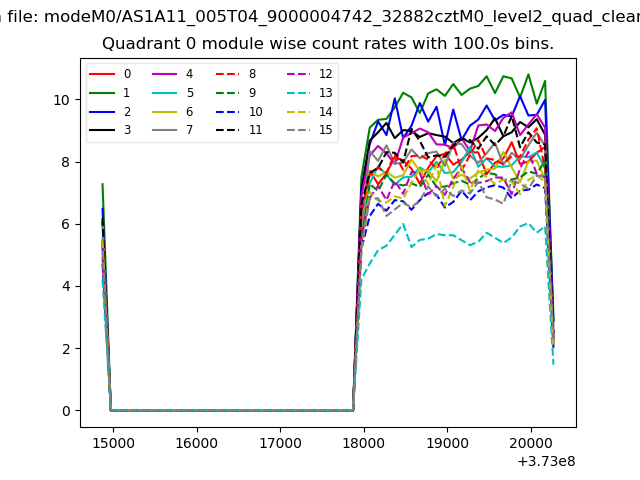 |
 |
| Module-wise count rates for Quadrant B Data is divided into 100 sec bins |
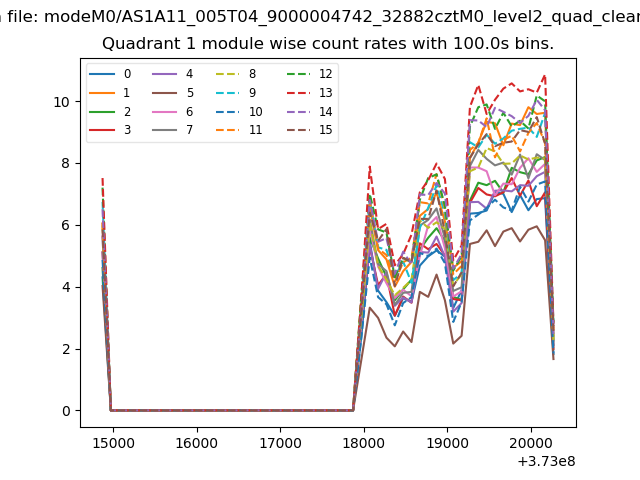 |
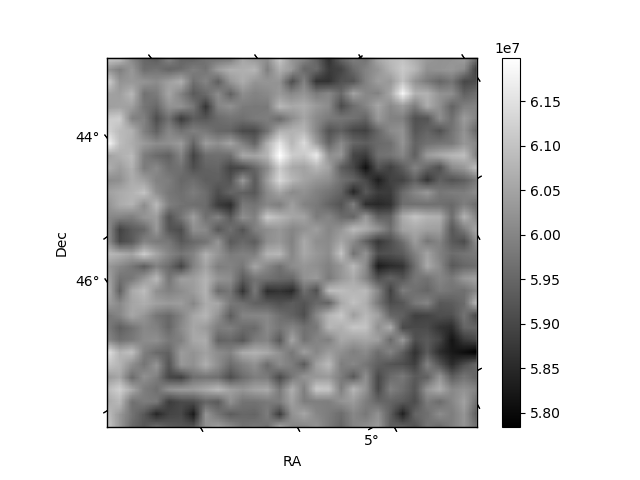 |
| Module-wise count rates for Quadrant C Data is divided into 100 sec bins |
 |
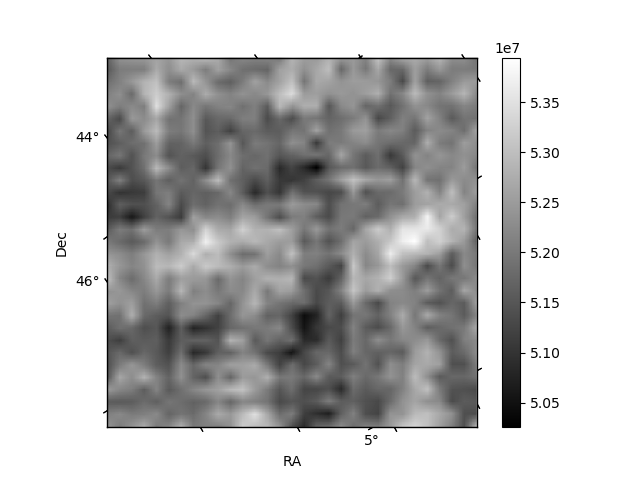 |
| Module-wise count rates for Quadrant D Data is divided into 100 sec bins |
 |
 |
| Parameter | Plot |
|---|---|
| CZT HV Monitor | 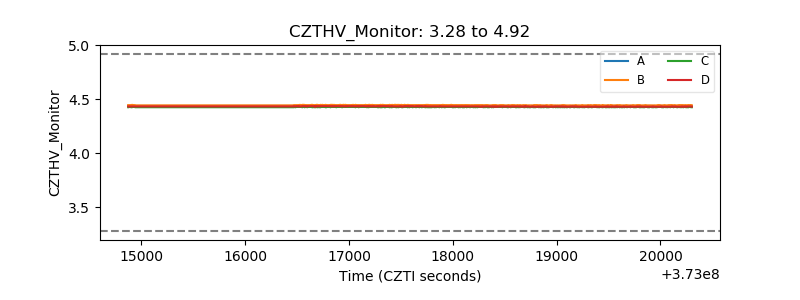 |
| D_VDD | 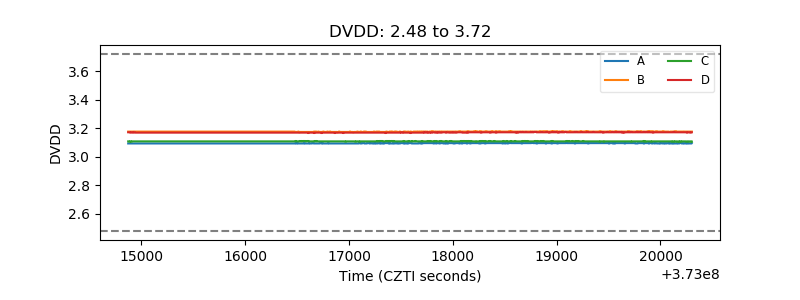 |
| Temperature 1 | 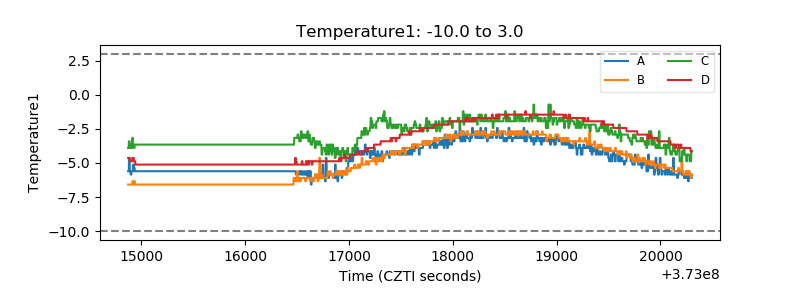 |
| Veto HV Monitor | 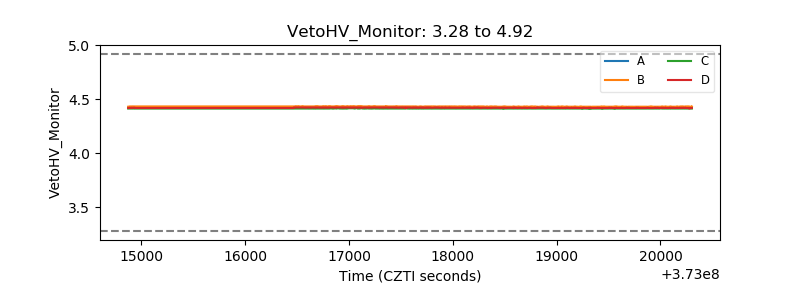 |
| Veto LLD | 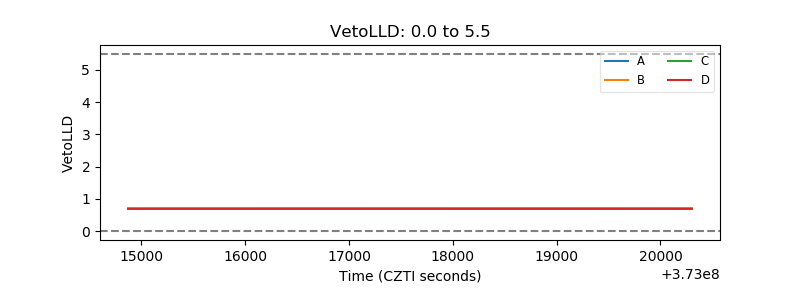 |
| Alpha Counter | 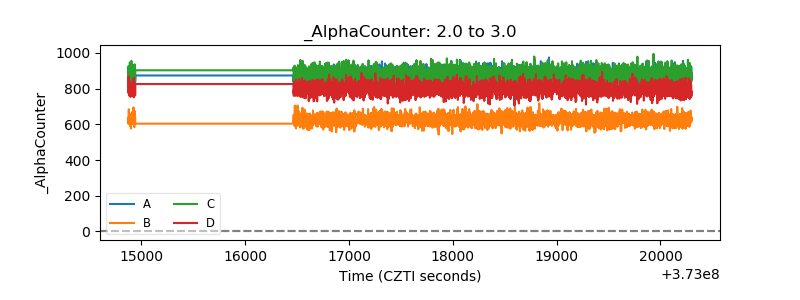 |
| _CPM_Rate | 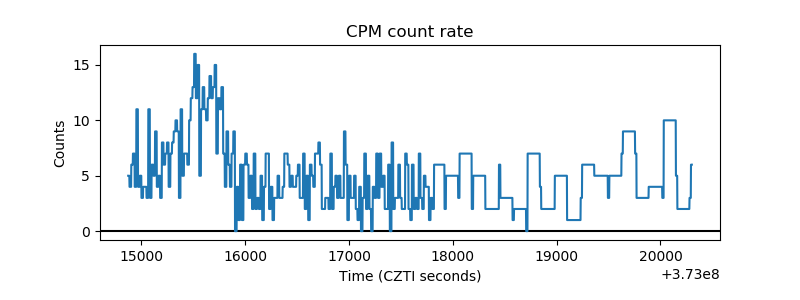 |
| CZT Counter |  |
| +2.5 Volts monitor |  |
| +5 Volts monitor |  |
| _ROLL_ROT | 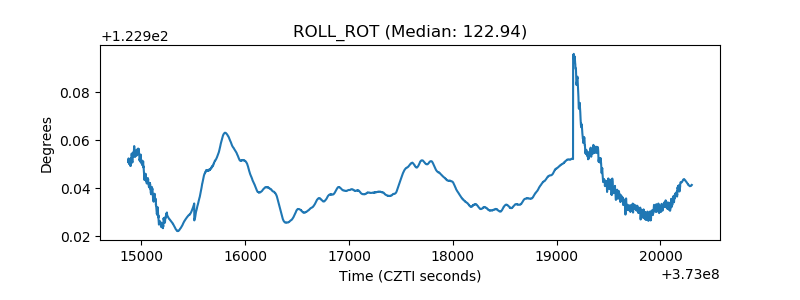 |
| _Roll_DEC | 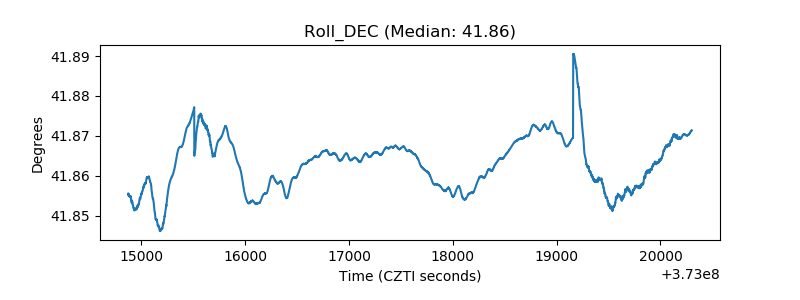 |
| _Roll_RA |  |
| Veto Counter | 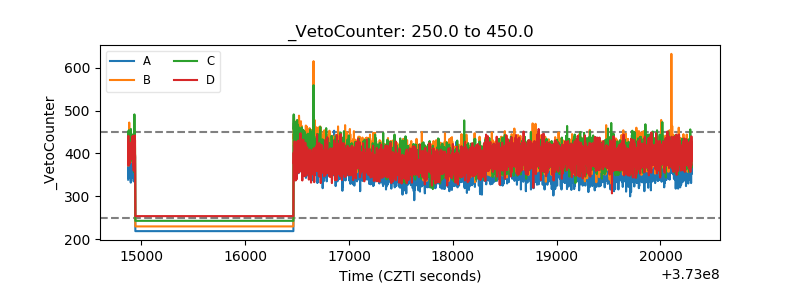 |