| Param | Original file | Final file |
|---|---|---|
| Filename | modeM0/AS1A11_088T01_9000004738_32849cztM0_level2.evt | modeM0/AS1A11_088T01_9000004738_32849cztM0_level2_quad_clean.evt |
| Size (bytes) | 256,694,400 | 26,939,520 |
| Size | 244.8 MB | 25.7 MB |
| Events in quadrant A | 1,073,549 | 167,597 |
| Events in quadrant B | 1,771,344 | 167,367 |
| Events in quadrant C | 1,201,422 | 173,261 |
| Events in quadrant D | 3,571,415 | 142,440 |
| Mode SS | |||
|---|---|---|---|
| Quadrant | BADHDUFLAG | Total packets | Discarded packets |
| A | 0 | 48 | 0 |
| B | 0 | 48 | 0 |
| C | 0 | 48 | 0 |
| D | 0 | 48 | 0 |
| Mode M0 | |||
|---|---|---|---|
| Quadrant | BADHDUFLAG | Total packets | Discarded packets |
| A | 0 | 4666 | 2 |
| B | 0 | 6718 | 1 |
| C | 0 | 5016 | 1 |
| D | 0 | 12208 | 1 |
| Mode M9 | |||
|---|---|---|---|
| Quadrant | BADHDUFLAG | Total packets | Discarded packets |
| A | 0 | 13 | 0 |
| B | 0 | 13 | 0 |
| C | 0 | 13 | 0 |
| D | 0 | 13 | 0 |
| Quadrant | Total seconds | Saturated seconds | Saturation percentage |
|---|---|---|---|
| A | 2277 | 10 | 0.439174% |
| B | 2277 | 251 | 11.023276% |
| C | 2277 | 38 | 1.668863% |
| D | 2277 | 698 | 30.654370% |
Noise dominated data is calculated using 1-second bins in cleaned event files. If a bin has >2000 counts, and if more than 50% of those come from <1% of pixels, then it is considered to be noise-dominated and hence unusable.
| Quadrant | # 1 sec bins | Bins with >0 counts | Bins with >2000 counts | High rate bins dominated by noise | Noise dominated (total time) | Noise dominated (detector-on time) | Marked lightcurve |
|---|---|---|---|---|---|---|---|
| A | 3590 | 2278 | 5 | 5 | 0.14% | 0.22% | 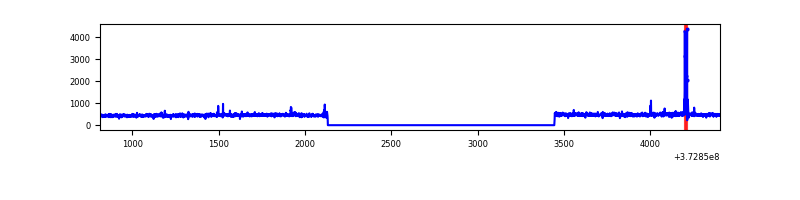 |
| B | 3590 | 2278 | 170 | 170 | 4.74% | 7.46% | 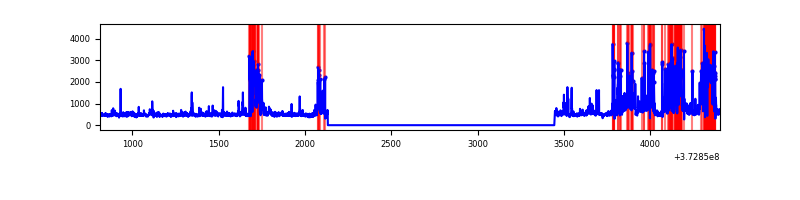 |
| C | 3590 | 2278 | 22 | 22 | 0.61% | 0.97% | 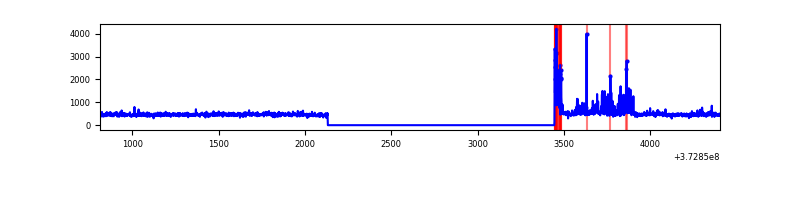 |
| D | 3590 | 2278 | 595 | 595 | 16.57% | 26.12% | 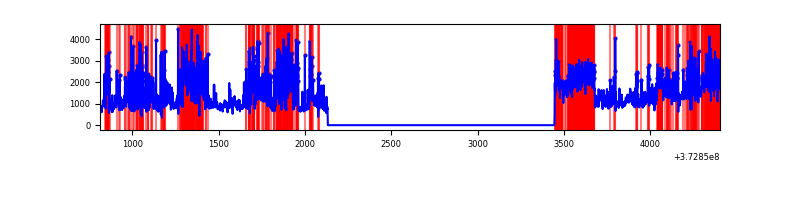 |
Top three noisy pixels from each quadrant. If the there are fewer than three noisy pixels in the level2.evt file, extra rows are filled as -1
| Pixel properties | Quadrant properties | ||||||
|---|---|---|---|---|---|---|---|
| Quadrant | DetID | PixID | Counts | Sigma | Mean | Median | Sigma |
| A | 9 | 143 | 35112 | 626.72 | 267 | 262 | 55.6 |
| A | 13 | 254 | 4283 | 72.31 | 267 | 262 | 55.6 |
| A | 13 | 6 | 2848 | 46.5 | 267 | 262 | 55.6 |
| B | 5 | 172 | 626977 | 12146.06 | 256 | 250 | 51.6 |
| B | 0 | 197 | 51109 | 985.66 | 256 | 250 | 51.6 |
| B | 0 | 199 | 39108 | 753.07 | 256 | 250 | 51.6 |
| C | 0 | 10 | 142338 | 2293.58 | 259 | 261 | 61.9 |
| C | 3 | 233 | 33501 | 536.6 | 259 | 261 | 61.9 |
| C | 14 | 67 | 10035 | 157.78 | 259 | 261 | 61.9 |
| D | 8 | 195 | 659769 | 10972.52 | 230 | 225 | 60.1 |
| D | 12 | 227 | 527866 | 8778.11 | 230 | 225 | 60.1 |
| D | 12 | 6 | 434152 | 7219.03 | 230 | 225 | 60.1 |
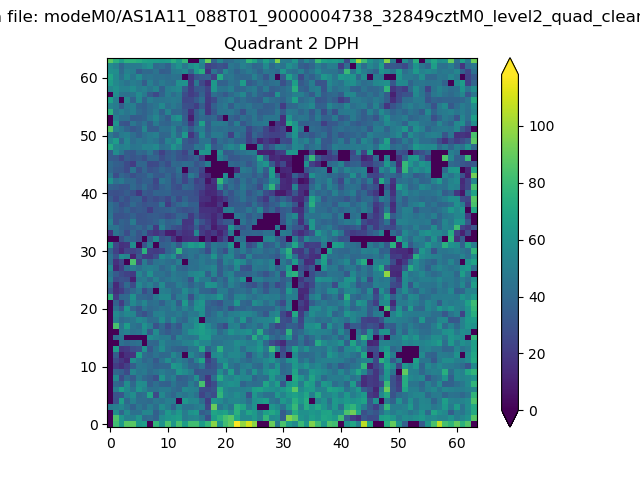
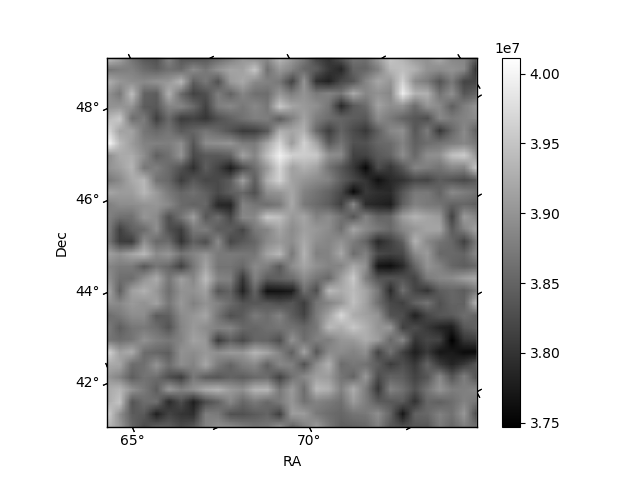
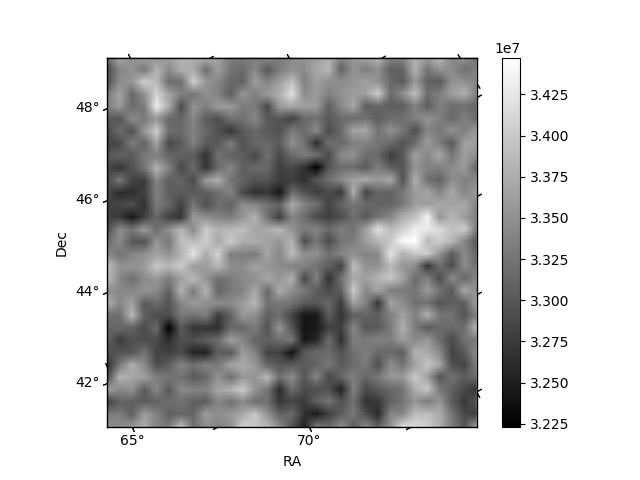
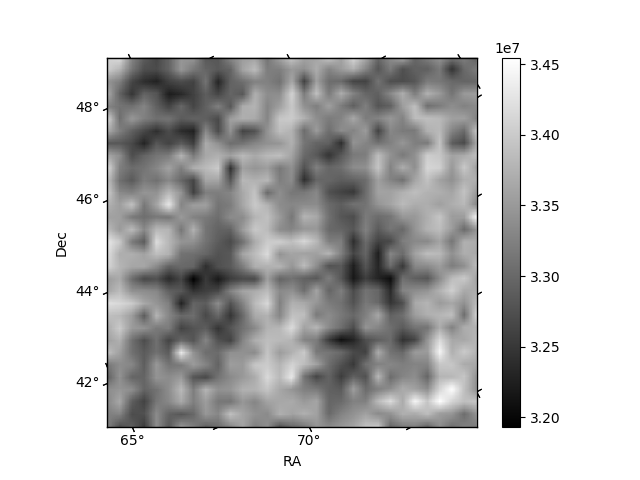
Histogram calculated using DETX and DETY for each event in the final _common_clean file
| Quadrant A | 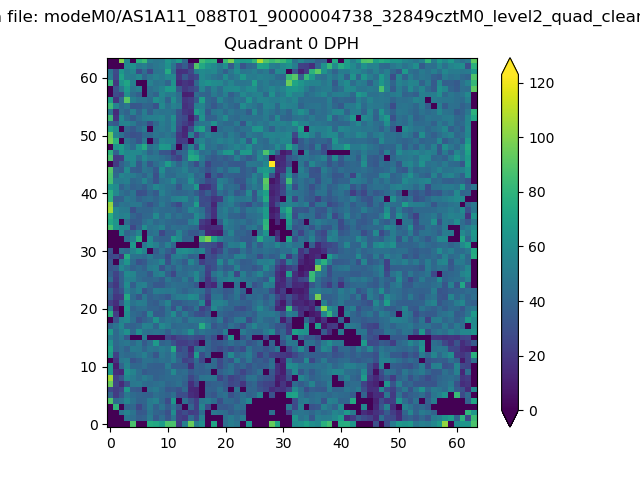 |
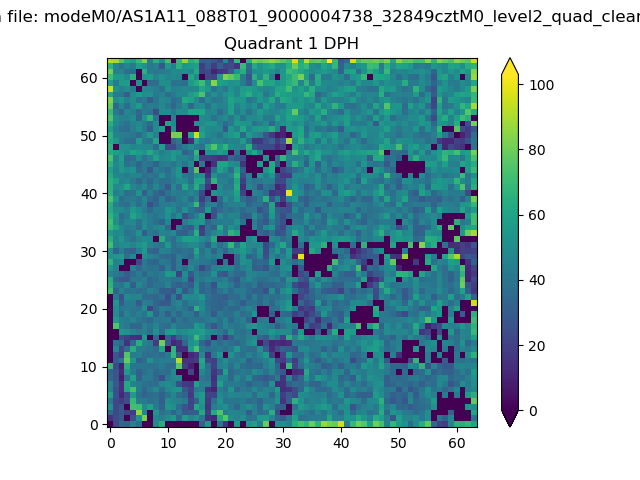 |
Quadrant B |
|---|---|---|---|
| Quadrant D | 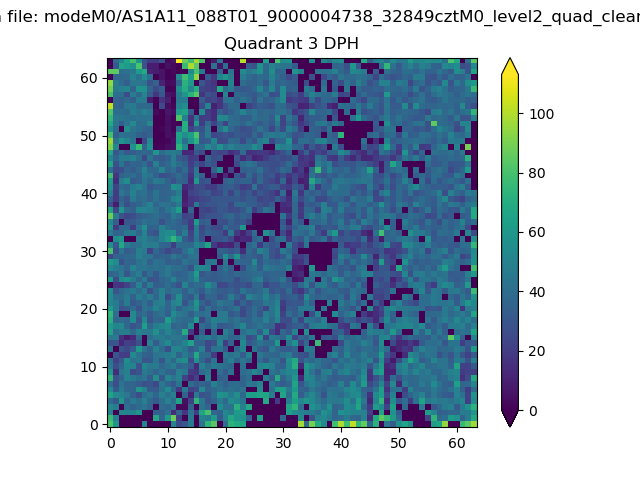 |
 |
Quadrant C |
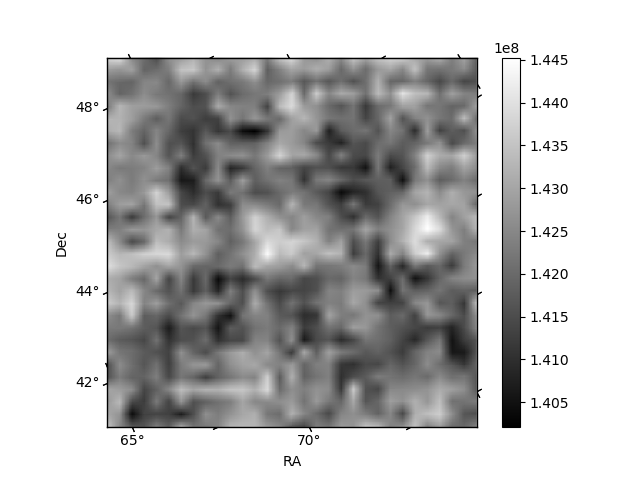
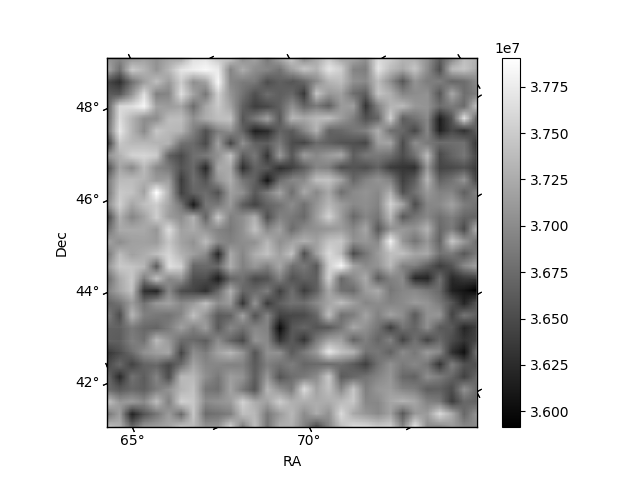
| Plot type | Count rate plots | Images |
|---|---|---|
| Comparison with Poisson distribution Blue bars denote a histogram of data divided into 1 sec bins. Red curve is a Poisson curve with rate = median count rate of data. |
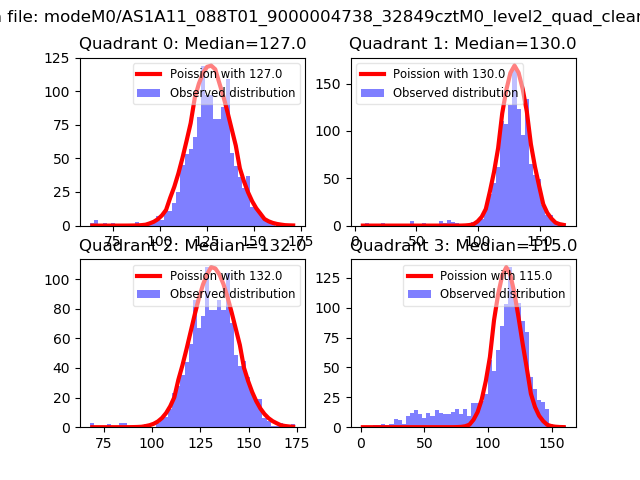 |
 |
| Quadrant-wise count rates Data is divided into 100 sec bins |
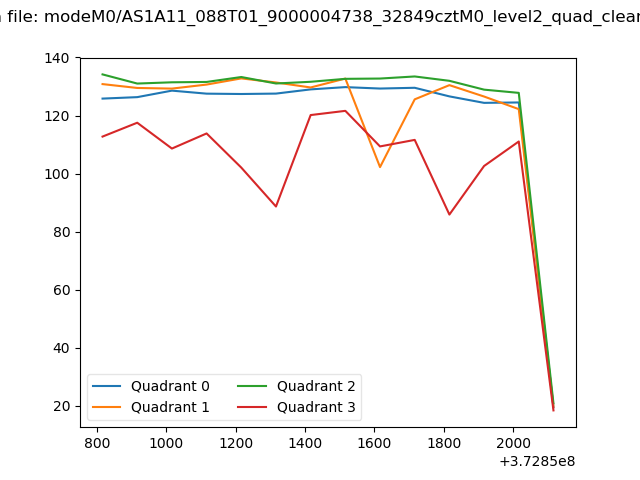 |
|
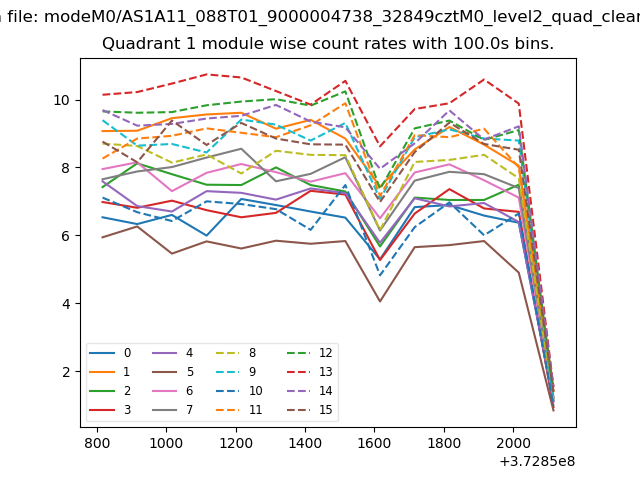
| Module-wise count rates for Quadrant A Data is divided into 100 sec bins |
 |
 |
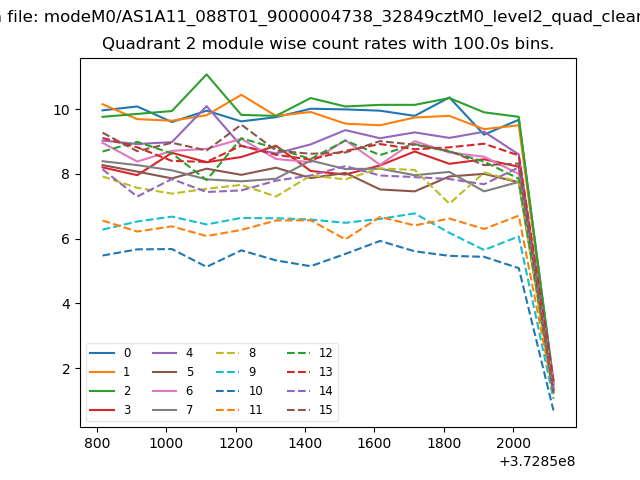
| Module-wise count rates for Quadrant B Data is divided into 100 sec bins |
 |
 |
| Module-wise count rates for Quadrant C Data is divided into 100 sec bins |
 |
 |
| Module-wise count rates for Quadrant D Data is divided into 100 sec bins |
 |
 |
| Parameter | Plot |
|---|---|
| CZT HV Monitor | 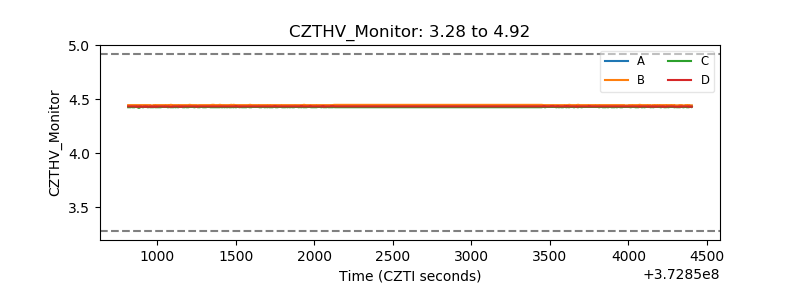 |
| D_VDD | 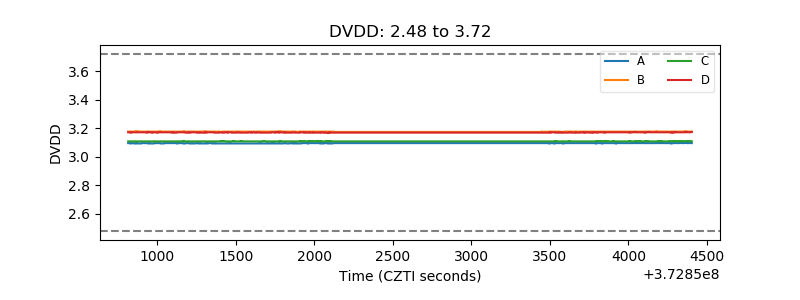 |
| Temperature 1 | 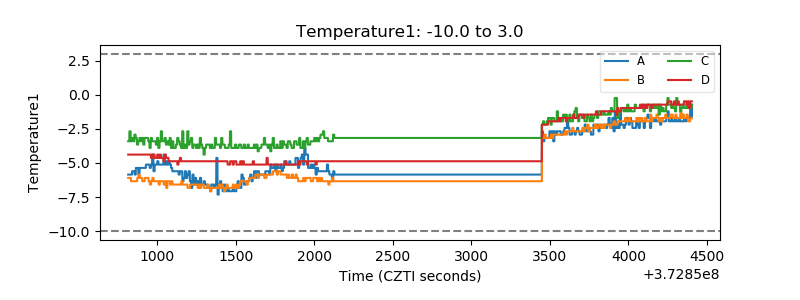 |
| Veto HV Monitor |  |
| Veto LLD |  |
| Alpha Counter | 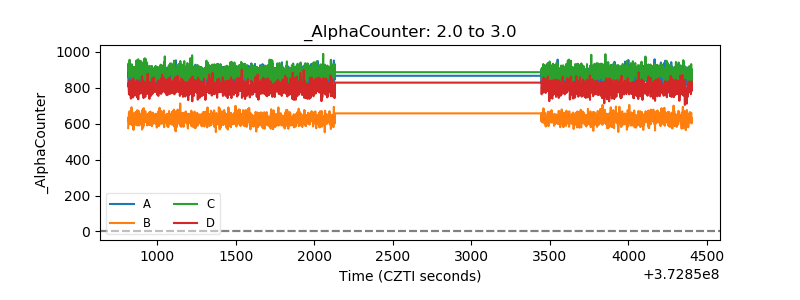 |
| _CPM_Rate | 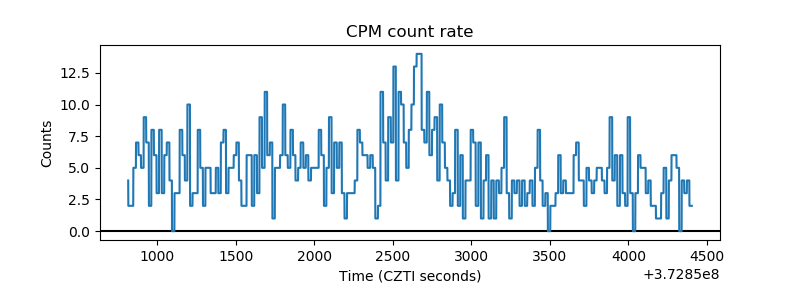 |
| CZT Counter | 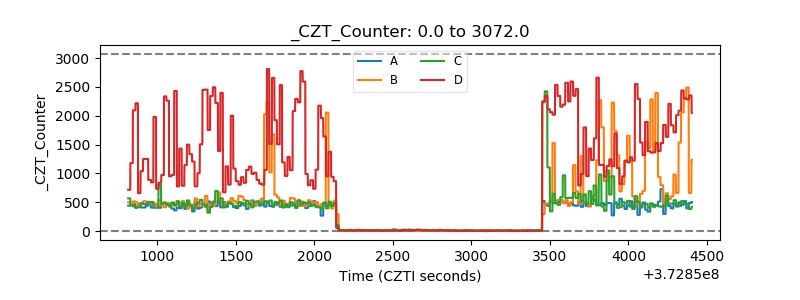 |
| +2.5 Volts monitor |  |
| +5 Volts monitor |  |
| _ROLL_ROT | 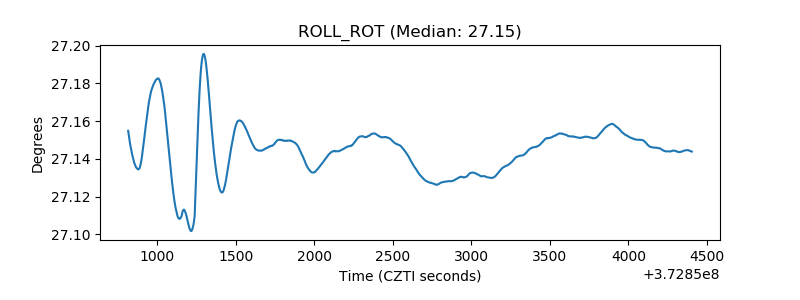 |
| _Roll_DEC | 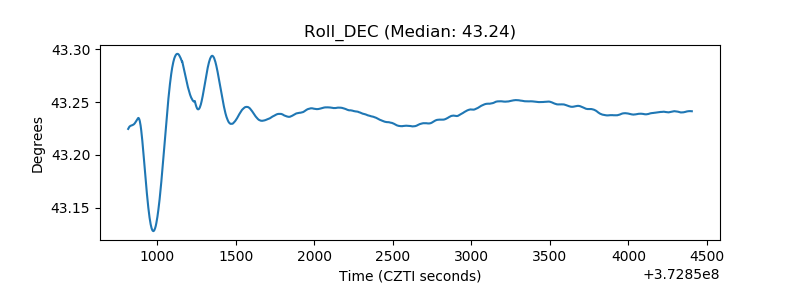 |
| _Roll_RA | 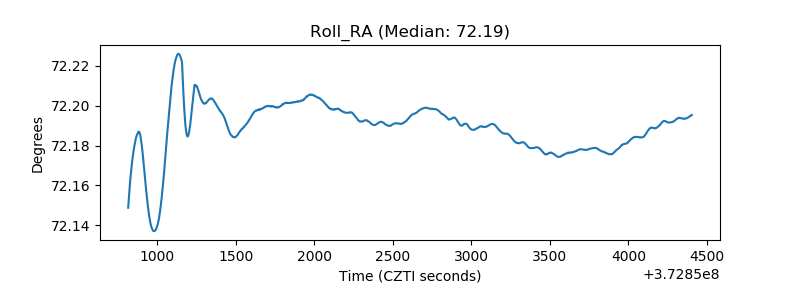 |
| Veto Counter |  |