| Param | Original file | Final file |
|---|---|---|
| Filename | modeM0/AS1A11_088T01_9000004738_32850cztM0_level2.evt | modeM0/AS1A11_088T01_9000004738_32850cztM0_level2_quad_clean.evt |
| Size (bytes) | 554,855,040 | 60,027,840 |
| Size | 529.2 MB | 57.2 MB |
| Events in quadrant A | 2,421,220 | 383,032 |
| Events in quadrant B | 3,208,025 | 388,426 |
| Events in quadrant C | 2,794,253 | 385,419 |
| Events in quadrant D | 8,042,009 | 310,414 |
| Mode SS | |||
|---|---|---|---|
| Quadrant | BADHDUFLAG | Total packets | Discarded packets |
| A | 0 | 102 | 0 |
| B | 0 | 102 | 0 |
| C | 0 | 102 | 0 |
| D | 0 | 102 | 0 |
| Mode M0 | |||
|---|---|---|---|
| Quadrant | BADHDUFLAG | Total packets | Discarded packets |
| A | 0 | 10517 | 1 |
| B | 0 | 12720 | 1 |
| C | 0 | 11500 | 1 |
| D | 0 | 27398 | 1 |
| Mode M9 | |||
|---|---|---|---|
| Quadrant | BADHDUFLAG | Total packets | Discarded packets |
| A | 0 | 13 | 0 |
| B | 0 | 13 | 0 |
| C | 0 | 13 | 0 |
| D | 0 | 14 | 0 |
| Quadrant | Total seconds | Saturated seconds | Saturation percentage |
|---|---|---|---|
| A | 4986 | 44 | 0.882471% |
| B | 4986 | 259 | 5.194545% |
| C | 4986 | 136 | 2.727637% |
| D | 4986 | 2079 | 41.696751% |
Noise dominated data is calculated using 1-second bins in cleaned event files. If a bin has >2000 counts, and if more than 50% of those come from <1% of pixels, then it is considered to be noise-dominated and hence unusable.
| Quadrant | # 1 sec bins | Bins with >0 counts | Bins with >2000 counts | High rate bins dominated by noise | Noise dominated (total time) | Noise dominated (detector-on time) | Marked lightcurve |
|---|---|---|---|---|---|---|---|
| A | 4986 | 4986 | 31 | 31 | 0.62% | 0.62% | 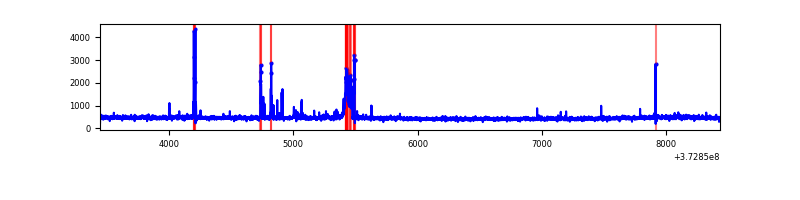 |
| B | 4986 | 4986 | 171 | 171 | 3.43% | 3.43% | 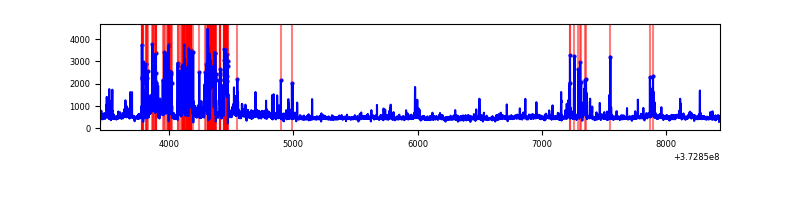 |
| C | 4986 | 4986 | 113 | 113 | 2.27% | 2.27% | 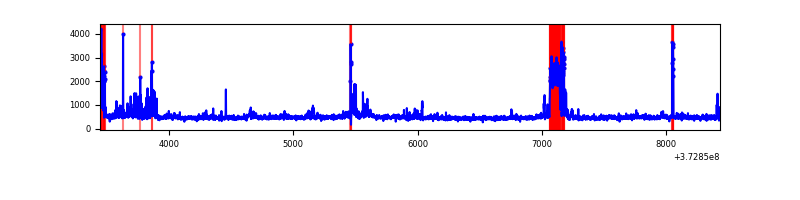 |
| D | 4986 | 4986 | 1744 | 1744 | 34.98% | 34.98% | 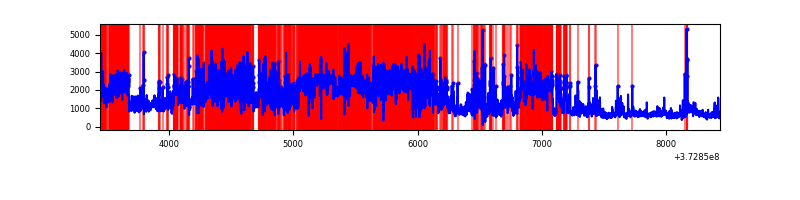 |
Top three noisy pixels from each quadrant. If the there are fewer than three noisy pixels in the level2.evt file, extra rows are filled as -1
| Pixel properties | Quadrant properties | ||||||
|---|---|---|---|---|---|---|---|
| Quadrant | DetID | PixID | Counts | Sigma | Mean | Median | Sigma |
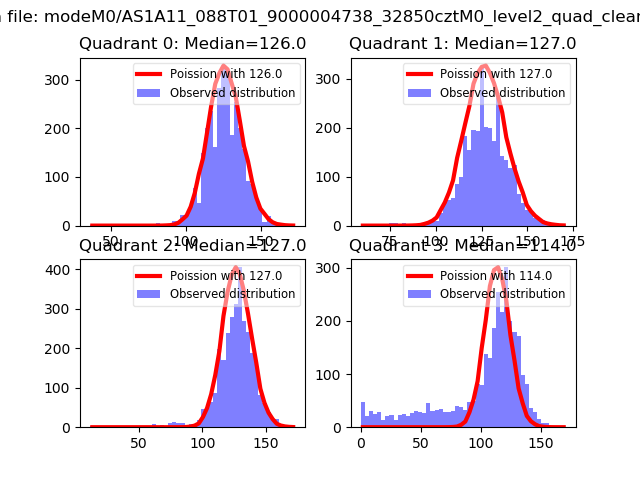
| A | 9 | 143 | 137998 | 1174.41 | 576 | 565 | 117.0 |
| A | 0 | 135 | 32618 | 273.9 | 576 | 565 | 117.0 |
| A | 13 | 254 | 9608 | 77.28 | 576 | 565 | 117.0 |
| B | 5 | 172 | 684214 | 6222.72 | 566 | 554 | 109.9 |
| B | 0 | 199 | 74259 | 670.87 | 566 | 554 | 109.9 |
| B | 0 | 197 | 71311 | 644.03 | 566 | 554 | 109.9 |
| C | 3 | 233 | 395434 | 3051.07 | 556 | 561 | 129.4 |
| C | 0 | 10 | 149137 | 1148.0 | 556 | 561 | 129.4 |
| C | 1 | 241 | 38477 | 292.97 | 556 | 561 | 129.4 |
| D | 12 | 227 | 1714391 | 15094.03 | 441 | 431 | 113.6 |
| D | 13 | 153 | 1657261 | 14590.91 | 441 | 431 | 113.6 |
| D | 8 | 195 | 1060026 | 9331.35 | 441 | 431 | 113.6 |
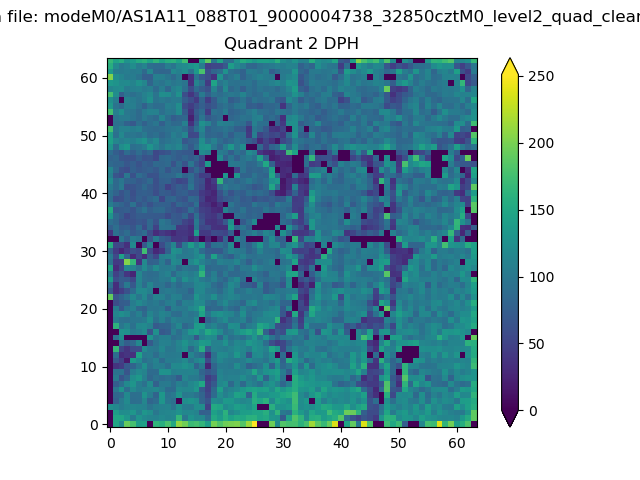
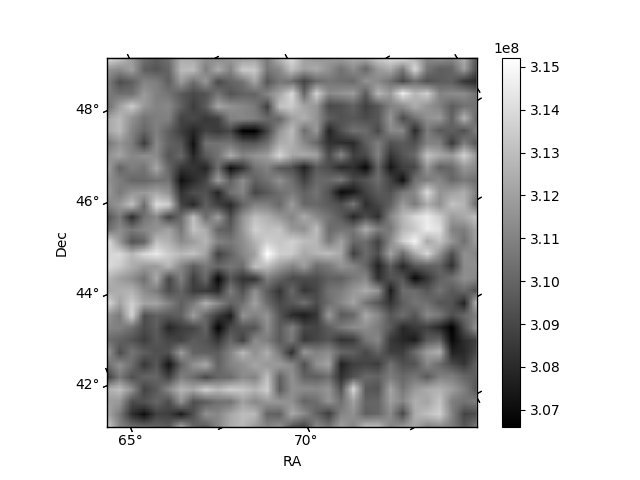
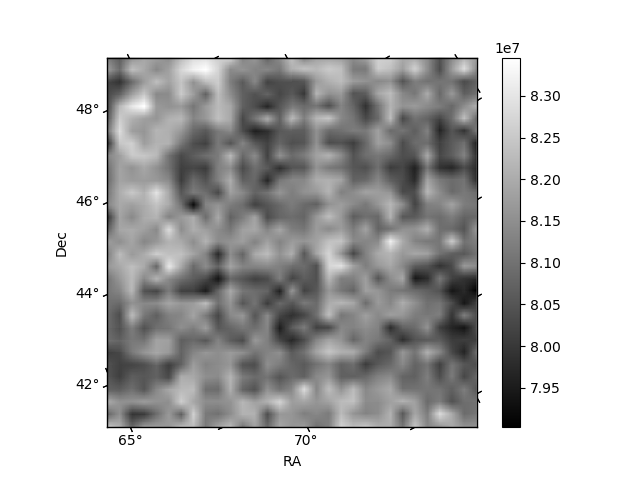
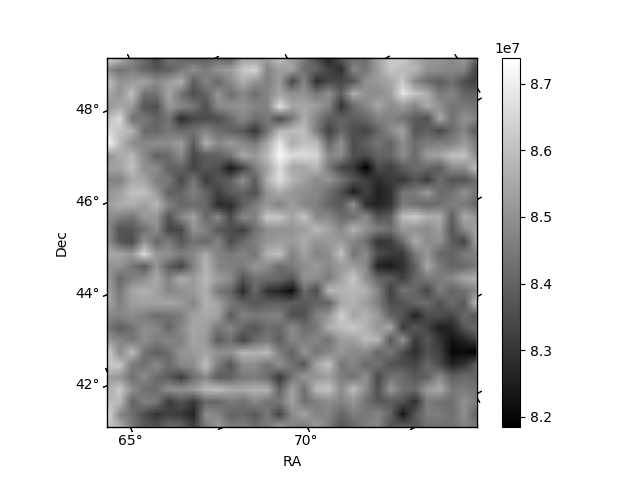
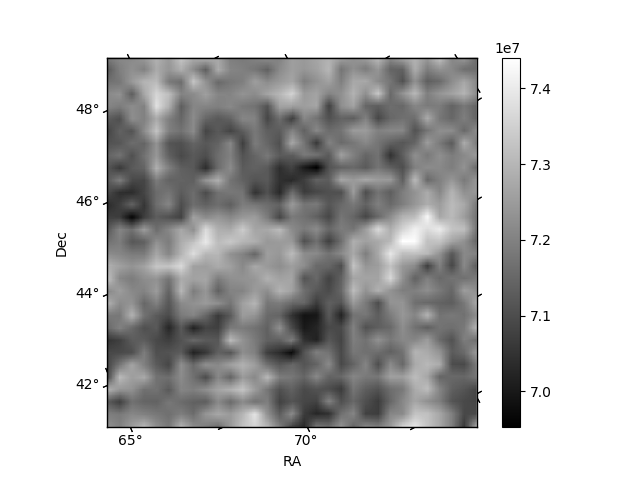
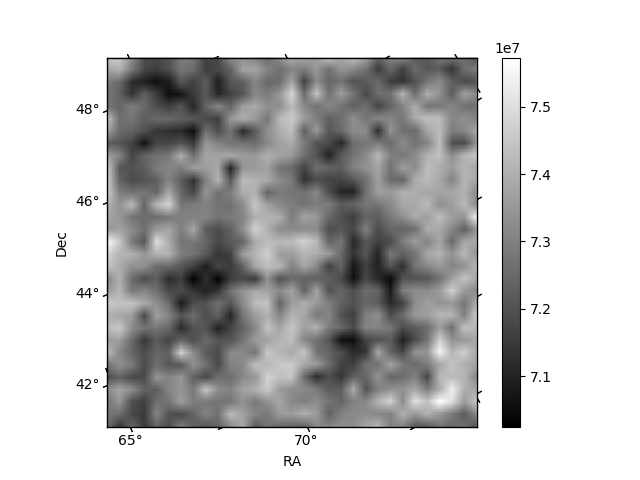
Histogram calculated using DETX and DETY for each event in the final _common_clean file
| Quadrant A | 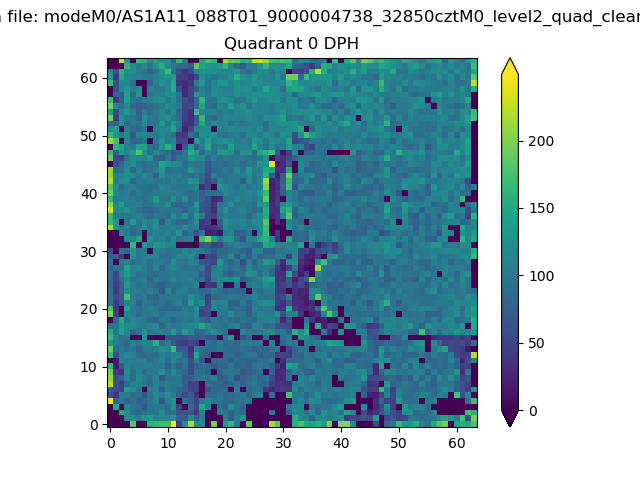 |
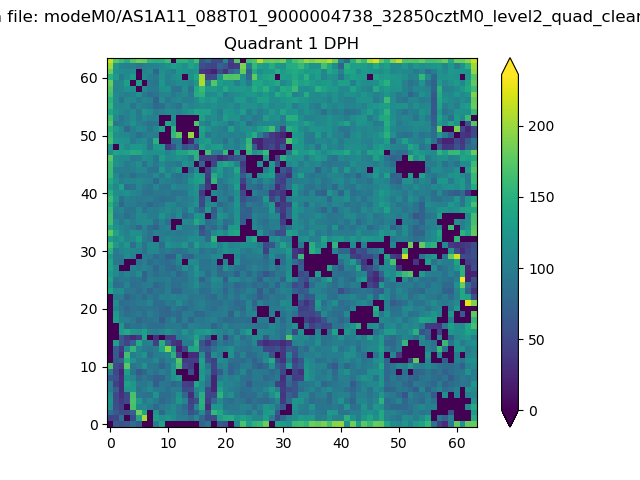 |
Quadrant B |
|---|---|---|---|
| Quadrant D | 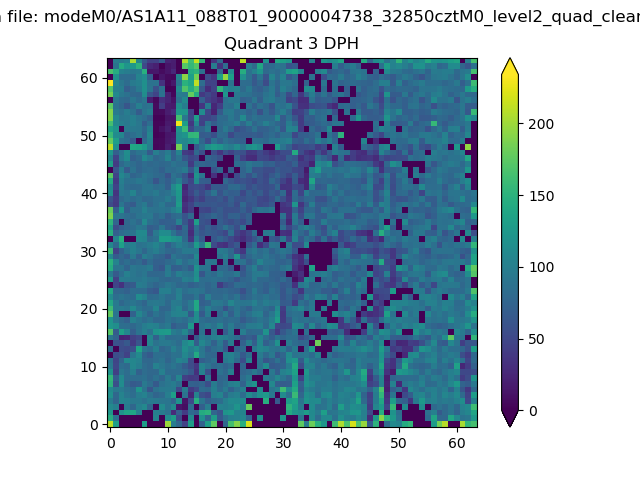 |
 |
Quadrant C |
| Plot type | Count rate plots | Images |
|---|---|---|
| Comparison with Poisson distribution Blue bars denote a histogram of data divided into 1 sec bins. Red curve is a Poisson curve with rate = median count rate of data. |
 |
 |
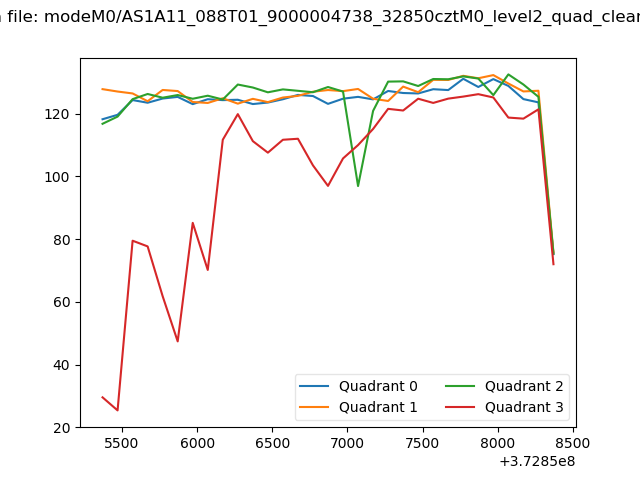
| Quadrant-wise count rates Data is divided into 100 sec bins |
 |
|
| Module-wise count rates for Quadrant A Data is divided into 100 sec bins |
 |
 |
| Module-wise count rates for Quadrant B Data is divided into 100 sec bins |
 |
 |
| Module-wise count rates for Quadrant C Data is divided into 100 sec bins |
 |
 |
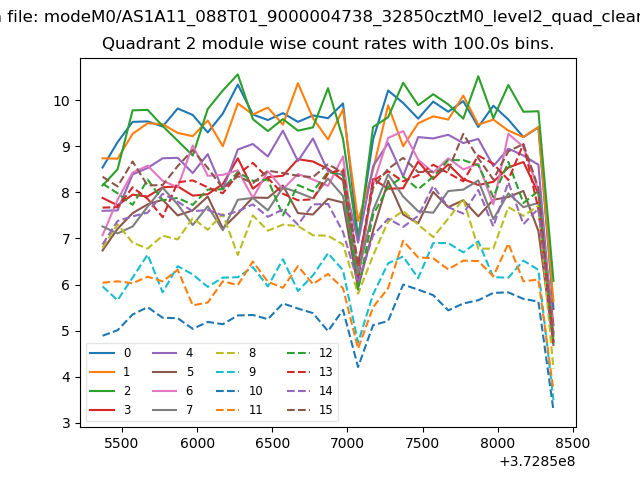
| Module-wise count rates for Quadrant D Data is divided into 100 sec bins |
 |
 |
| Parameter | Plot |
|---|---|
| CZT HV Monitor | 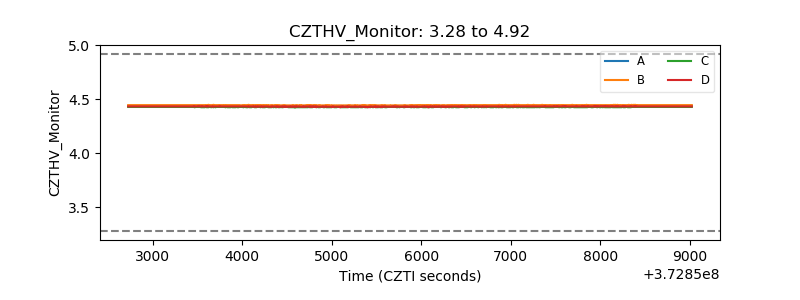 |
| D_VDD | 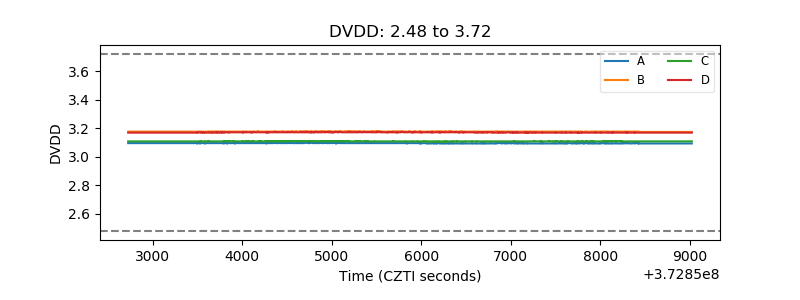 |
| Temperature 1 | 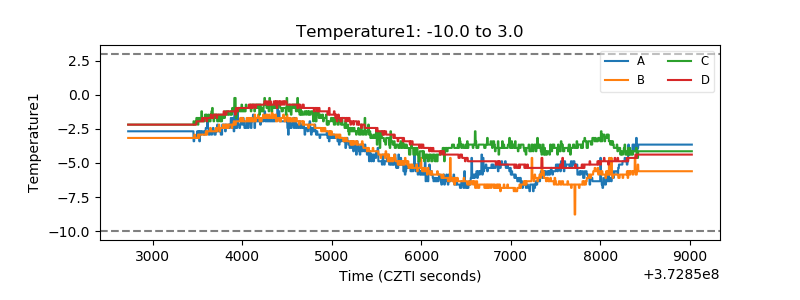 |
| Veto HV Monitor | 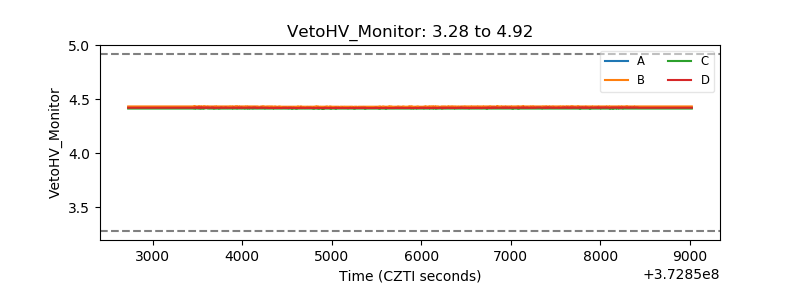 |
| Veto LLD |  |
| Alpha Counter | 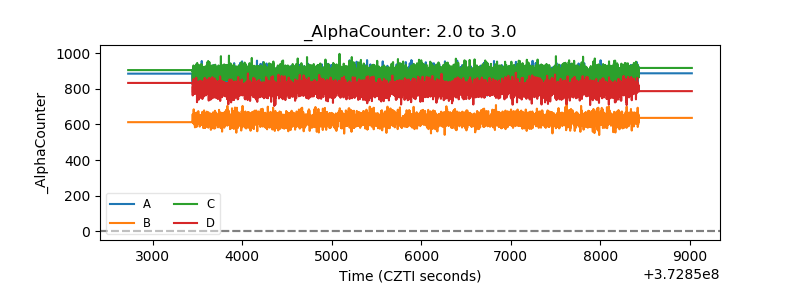 |
| _CPM_Rate | 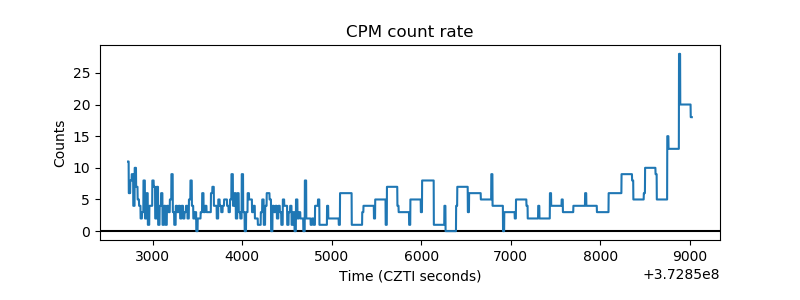 |
| CZT Counter | 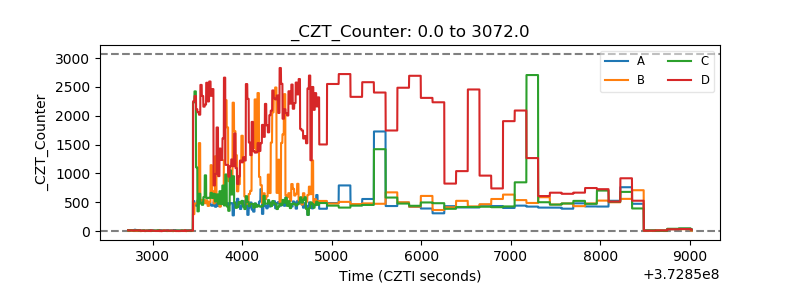 |
| +2.5 Volts monitor |  |
| +5 Volts monitor |  |
| _ROLL_ROT |  |
| _Roll_DEC | 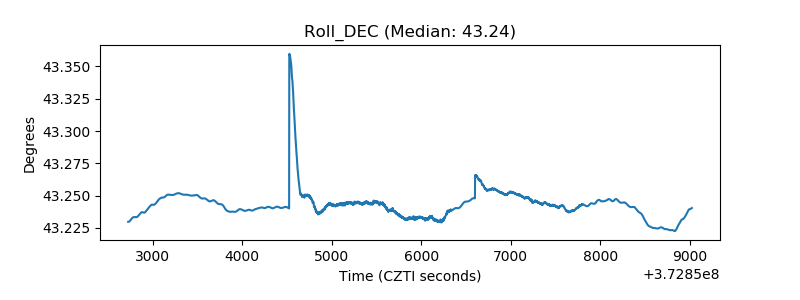 |
| _Roll_RA | 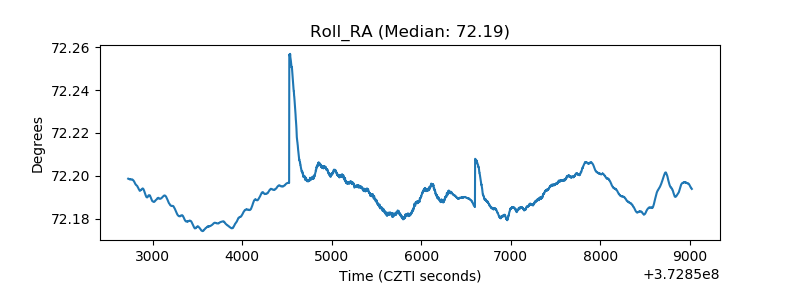 |
| Veto Counter |  |