| Param | Original file | Final file |
|---|---|---|
| Filename | modeM0/AS1A11_088T02_9000004740cztM0_level2.fits | modeM0/AS1A11_088T02_9000004740cztM0_level2_quad_clean.evt |
| Size (bytes) | 107,807,040 | 79,035,840 |
| Size | 102.8 MB | 75.4 MB |
| Events in quadrant A | 666,634 | 425,083 |
| Events in quadrant B | 625,630 | 404,837 |
| Events in quadrant C | 648,006 | 400,405 |
| Events in quadrant D | 497,504 | 336,262 |
| Mode SS | |||
|---|---|---|---|
| Quadrant | BADHDUFLAG | Total packets | Discarded packets |
| A | 0 | 242 | 0 |
| B | 0 | 242 | 0 |
| C | 0 | 242 | 0 |
| D | 0 | 242 | 0 |
| Mode M0 | |||
|---|---|---|---|
| Quadrant | BADHDUFLAG | Total packets | Discarded packets |
| A | 0 | 24271 | 0 |
| B | 0 | 30008 | 0 |
| C | 0 | 28230 | 0 |
| D | 0 | 61427 | 0 |
| Mode M9 | |||
|---|---|---|---|
| Quadrant | BADHDUFLAG | Total packets | Discarded packets |
| A | 0 | 28 | 0 |
| B | 0 | 28 | 0 |
| C | 0 | 28 | 0 |
| D | 0 | 28 | 0 |
| Quadrant | Total seconds | Saturated seconds | Saturation percentage |
|---|---|---|---|
| A | 11943 | 15 | 0.125597% |
| B | 11943 | 500 | 4.186553% |
| C | 11943 | 254 | 2.126769% |
| D | 11943 | 2916 | 24.415976% |
Noise dominated data is calculated using 1-second bins in cleaned event files. If a bin has >2000 counts, and if more than 50% of those come from <1% of pixels, then it is considered to be noise-dominated and hence unusable.
| Quadrant | # 1 sec bins | Bins with >0 counts | Bins with >2000 counts | High rate bins dominated by noise | Noise dominated (total time) | Noise dominated (detector-on time) | Marked lightcurve |
|---|---|---|---|---|---|---|---|
| A | 14719 | 11943 | 0 | 0 | 0.00% | 0.00% |  |
| B | 14719 | 11939 | 0 | 0 | 0.00% | 0.00% |  |
| C | 14719 | 11919 | 0 | 0 | 0.00% | 0.00% |  |
| D | 14719 | 11935 | 0 | 0 | 0.00% | 0.00% |  |
Top three noisy pixels from each quadrant. If the there are fewer than three noisy pixels in the level2.evt file, extra rows are filled as -1
| Pixel properties | Quadrant properties | ||||||
|---|---|---|---|---|---|---|---|
| Quadrant | DetID | PixID | Counts | Sigma | Mean | Median | Sigma |
| A | 7 | 110 | 570 | 9.05 | 174 | 164 | 44.9 |
| A | 0 | 29 | 531 | 8.18 | 174 | 164 | 44.9 |
| A | 9 | 19 | 507 | 7.64 | 174 | 164 | 44.9 |
| B | 2 | 9 | 522 | 10.26 | 166 | 158 | 35.5 |
| B | 3 | 80 | 474 | 8.91 | 166 | 158 | 35.5 |
| B | 3 | 17 | 454 | 8.34 | 166 | 158 | 35.5 |
| C | 1 | 81 | 546 | 8.5 | 171 | 160 | 45.4 |
| C | 1 | 80 | 522 | 7.97 | 171 | 160 | 45.4 |
| C | 3 | 203 | 488 | 7.22 | 171 | 160 | 45.4 |
| D | 6 | 67 | 394 | 6.69 | 142 | 129 | 39.6 |
| D | 6 | 62 | 371 | 6.11 | 142 | 129 | 39.6 |
| D | 4 | 160 | 369 | 6.06 | 142 | 129 | 39.6 |
Histogram calculated using DETX and DETY for each event in the final _common_clean file
| Quadrant A | 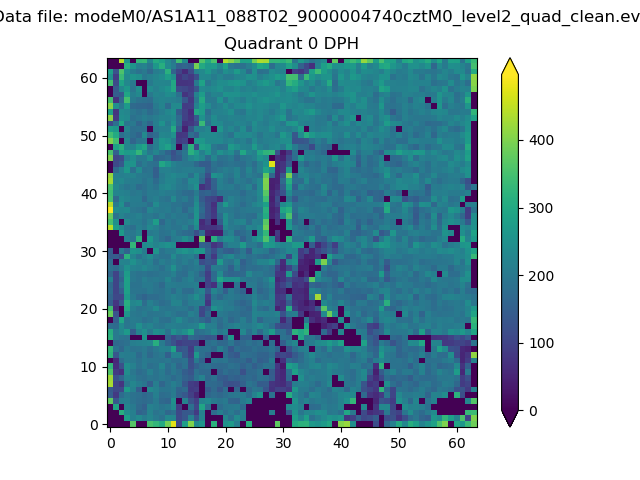 |
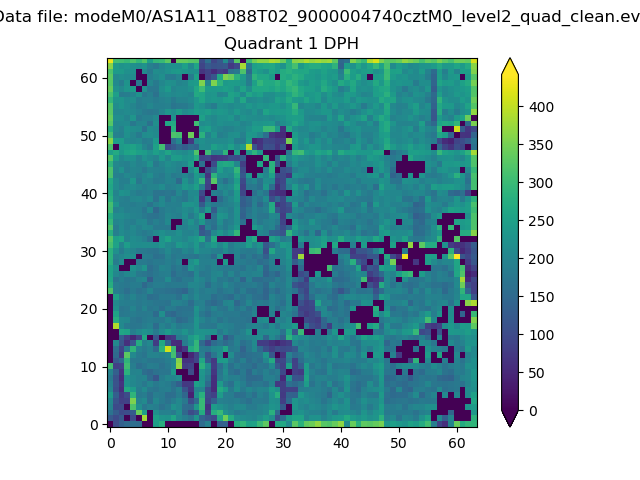 |
Quadrant B |
|---|---|---|---|
| Quadrant D |  |
 |
Quadrant C |
| Plot type | Count rate plots | Images |
|---|---|---|
| Comparison with Poisson distribution Blue bars denote a histogram of data divided into 1 sec bins. Red curve is a Poisson curve with rate = median count rate of data. |
 |
 |
| Quadrant-wise count rates Data is divided into 100 sec bins |
 |
|
| Module-wise count rates for Quadrant A Data is divided into 100 sec bins |
 |
 |
| Module-wise count rates for Quadrant B Data is divided into 100 sec bins |
 |
 |
| Module-wise count rates for Quadrant C Data is divided into 100 sec bins |
 |
 |
| Module-wise count rates for Quadrant D Data is divided into 100 sec bins |
 |
 |
| Parameter | Plot |
|---|---|
| CZT HV Monitor |  |
| D_VDD |  |
| Temperature 1 |  |
| Veto HV Monitor |  |
| Veto LLD |  |
| Alpha Counter |  |
| _CPM_Rate |  |
| CZT Counter |  |
| +2.5 Volts monitor |  |
| +5 Volts monitor |  |
| _ROLL_ROT |  |
| _Roll_DEC |  |
| _Roll_RA |  |
| Veto Counter |  |