| Param | Original file | Final file |
|---|---|---|
| Filename | modeM0/AS1A11_088T02_9000004740_32850cztM0_level2.evt | modeM0/AS1A11_088T02_9000004740_32850cztM0_level2_quad_clean.evt |
| Size (bytes) | 115,015,680 | 7,827,840 |
| Size | 109.7 MB | 7.5 MB |
| Events in quadrant A | 469,588 | 41,508 |
| Events in quadrant B | 776,270 | 42,440 |
| Events in quadrant C | 641,755 | 37,994 |
| Events in quadrant D | 1,525,398 | 37,662 |
| Mode SS | |||
|---|---|---|---|
| Quadrant | BADHDUFLAG | Total packets | Discarded packets |
| A | 0 | 20 | 0 |
| B | 0 | 20 | 0 |
| C | 0 | 20 | 0 |
| D | 0 | 20 | 0 |
| Mode M0 | |||
|---|---|---|---|
| Quadrant | BADHDUFLAG | Total packets | Discarded packets |
| A | 0 | 2007 | 1 |
| B | 0 | 2983 | 0 |
| C | 0 | 2547 | 0 |
| D | 0 | 5238 | 0 |
| Quadrant | Total seconds | Saturated seconds | Saturation percentage |
|---|---|---|---|
| A | 994 | 0 | 0.000000% |
| B | 994 | 98 | 9.859155% |
| C | 994 | 41 | 4.124748% |
| D | 994 | 254 | 25.553320% |
Noise dominated data is calculated using 1-second bins in cleaned event files. If a bin has >2000 counts, and if more than 50% of those come from <1% of pixels, then it is considered to be noise-dominated and hence unusable.
| Quadrant | # 1 sec bins | Bins with >0 counts | Bins with >2000 counts | High rate bins dominated by noise | Noise dominated (total time) | Noise dominated (detector-on time) | Marked lightcurve |
|---|---|---|---|---|---|---|---|
| A | 994 | 994 | 0 | 0 | 0.00% | 0.00% | 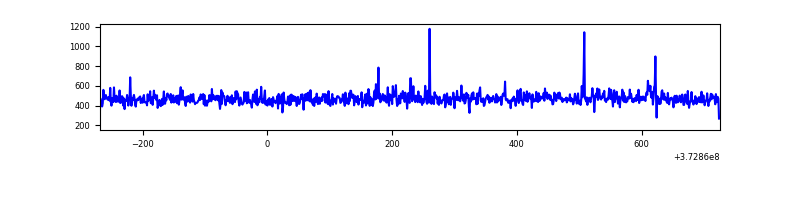 |
| B | 994 | 994 | 66 | 66 | 6.64% | 6.64% | 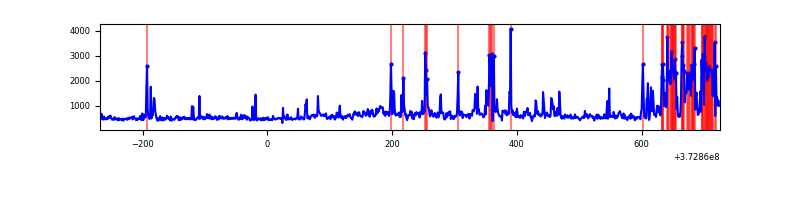 |
| C | 994 | 994 | 20 | 20 | 2.01% | 2.01% |  |
| D | 994 | 994 | 205 | 205 | 20.62% | 20.62% | 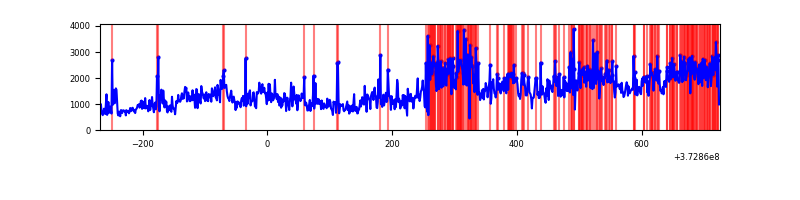 |
Top three noisy pixels from each quadrant. If the there are fewer than three noisy pixels in the level2.evt file, extra rows are filled as -1
| Pixel properties | Quadrant properties | ||||||
|---|---|---|---|---|---|---|---|
| Quadrant | DetID | PixID | Counts | Sigma | Mean | Median | Sigma |
| A | 9 | 143 | 4078 | 149.35 | 119 | 116 | 26.5 |
| A | 0 | 135 | 2543 | 91.48 | 119 | 116 | 26.5 |
| A | 13 | 254 | 1975 | 70.07 | 119 | 116 | 26.5 |
| B | 5 | 172 | 233505 | 9606.53 | 113 | 110 | 24.3 |
| B | 0 | 199 | 39185 | 1608.33 | 113 | 110 | 24.3 |
| B | 0 | 190 | 10230 | 416.54 | 113 | 110 | 24.3 |
| C | 0 | 10 | 167574 | 6113.81 | 110 | 110 | 27.4 |
| C | 3 | 233 | 28054 | 1020.19 | 110 | 110 | 27.4 |
| C | 1 | 241 | 12609 | 456.32 | 110 | 110 | 27.4 |
| D | 8 | 195 | 520701 | 18023.19 | 105 | 103 | 28.9 |
| D | 2 | 250 | 177018 | 6124.83 | 105 | 103 | 28.9 |
| D | 12 | 227 | 128990 | 4462.09 | 105 | 103 | 28.9 |
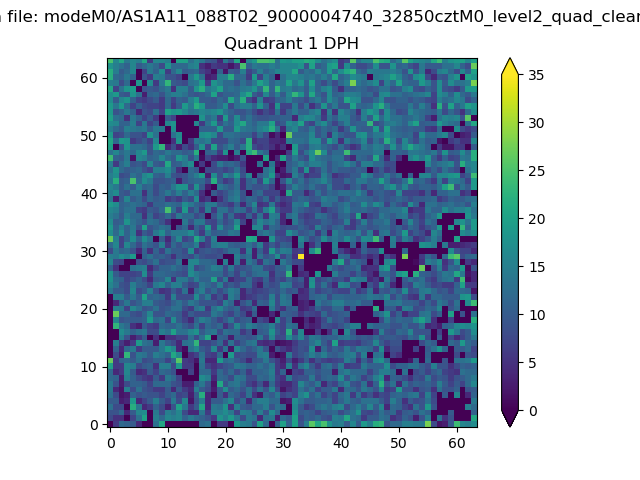
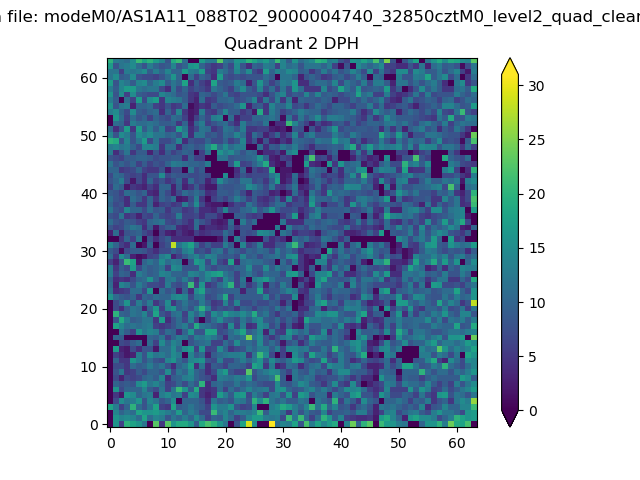
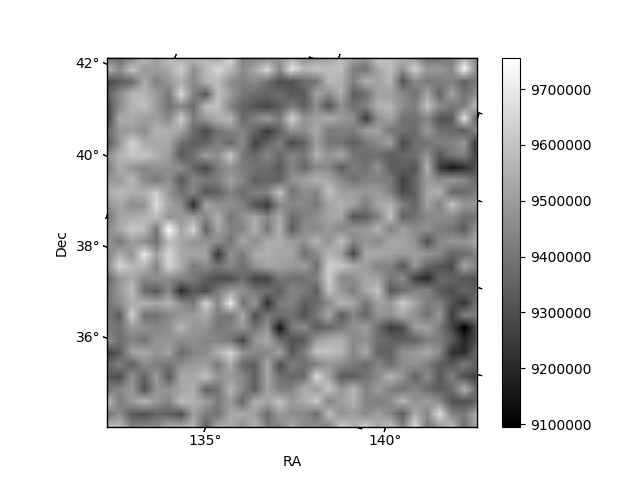
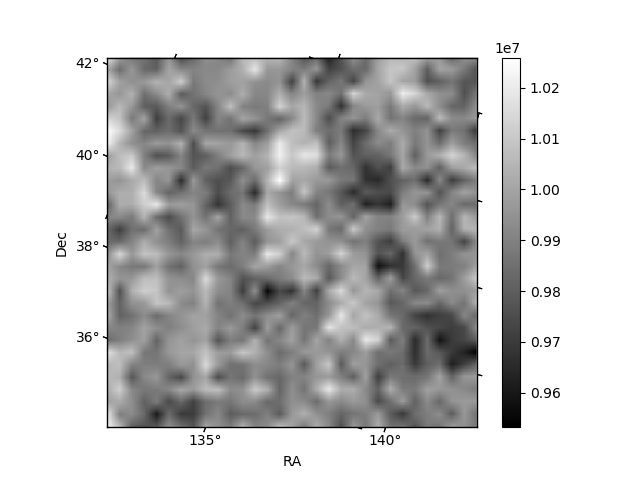
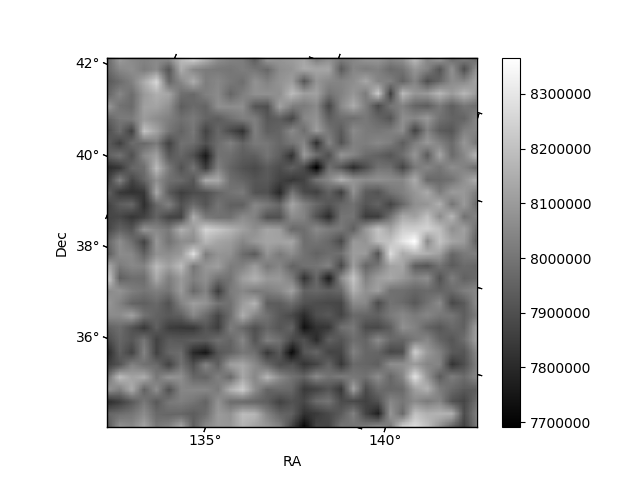
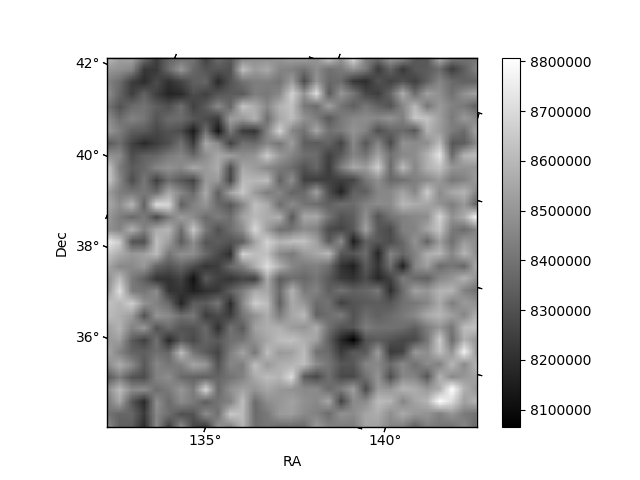
Histogram calculated using DETX and DETY for each event in the final _common_clean file
| Quadrant A | 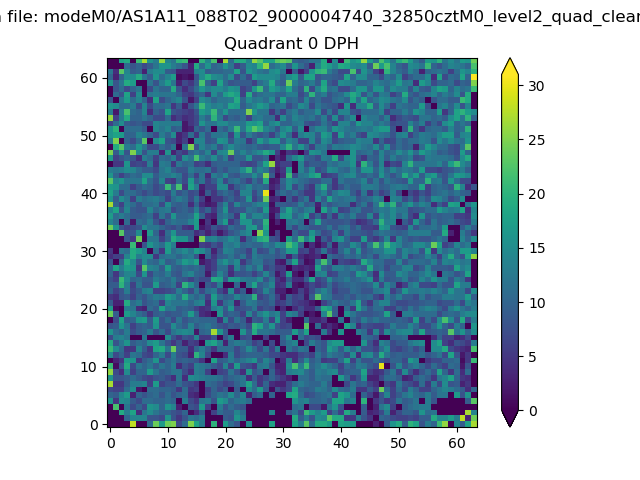 |
 |
Quadrant B |
|---|---|---|---|
| Quadrant D | 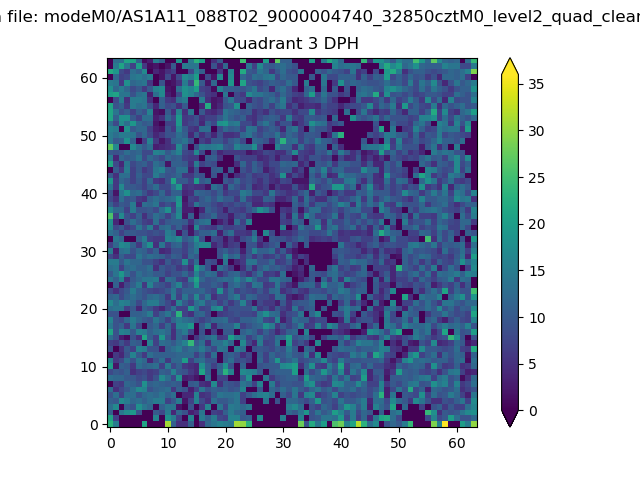 |
 |
Quadrant C |
| Plot type | Count rate plots | Images |
|---|---|---|
| Comparison with Poisson distribution Blue bars denote a histogram of data divided into 1 sec bins. Red curve is a Poisson curve with rate = median count rate of data. |
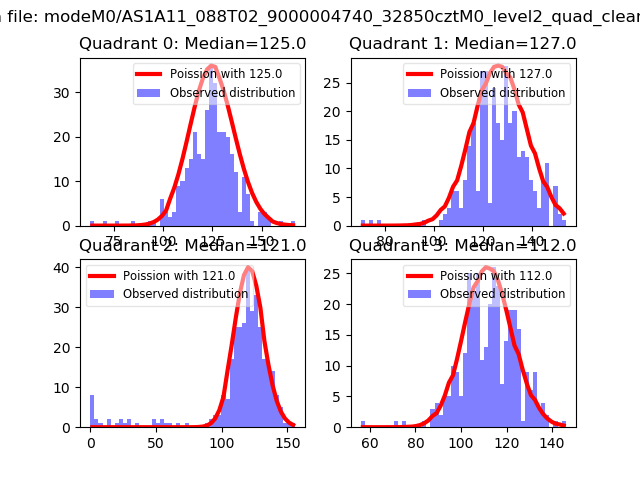 |
 |
| Quadrant-wise count rates Data is divided into 100 sec bins |
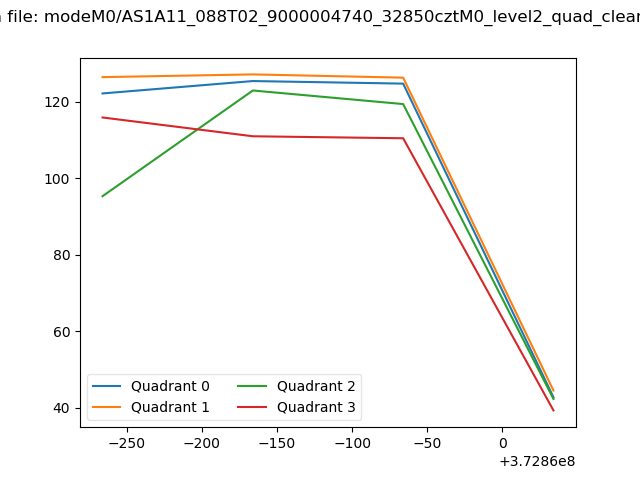 |
|
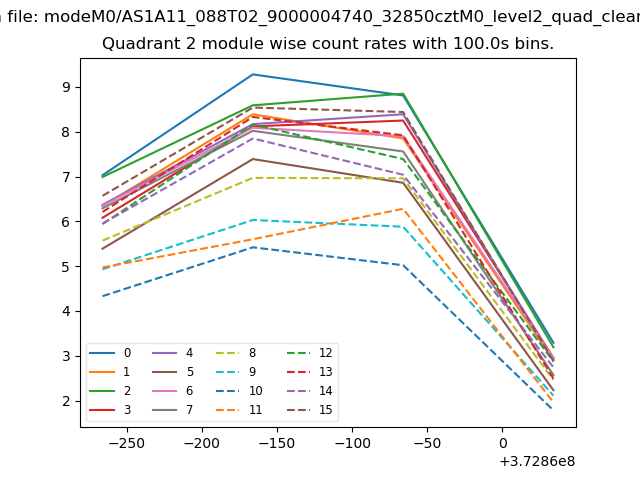
| Module-wise count rates for Quadrant A Data is divided into 100 sec bins |
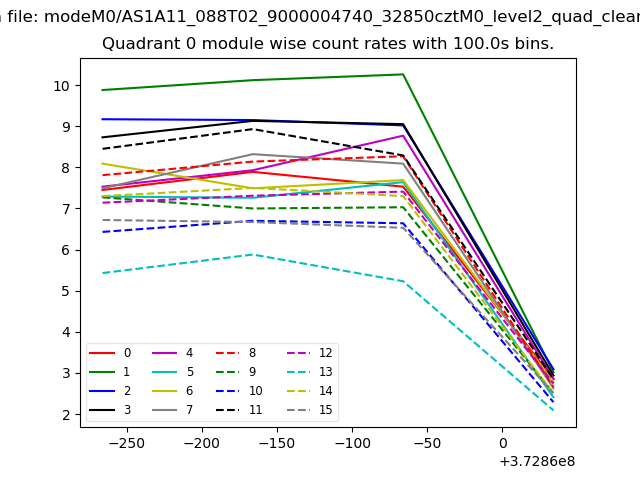 |
 |
| Module-wise count rates for Quadrant B Data is divided into 100 sec bins |
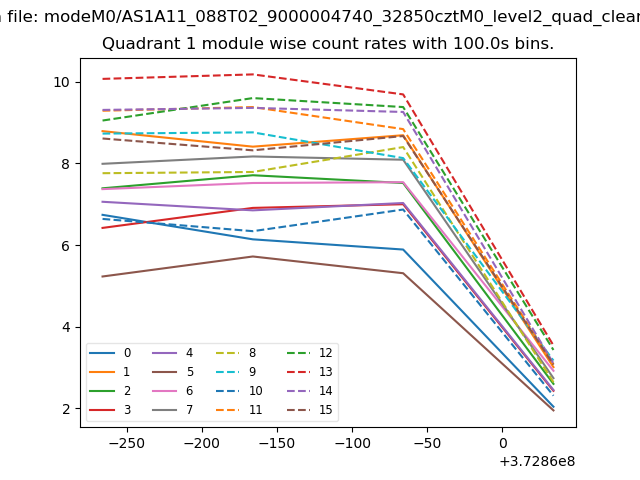 |
 |
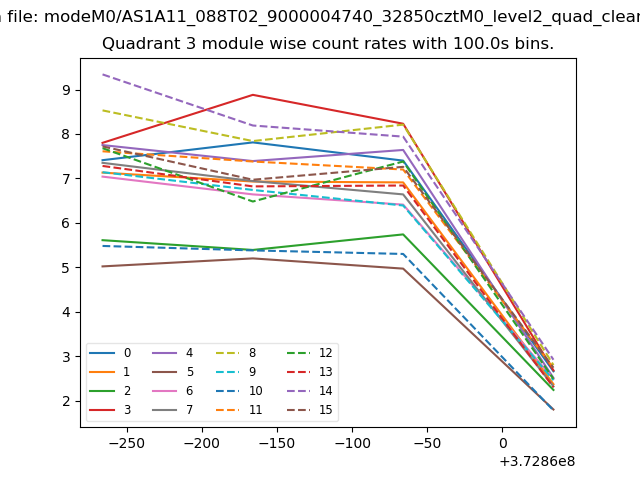
| Module-wise count rates for Quadrant C Data is divided into 100 sec bins |
 |
 |
| Module-wise count rates for Quadrant D Data is divided into 100 sec bins |
 |
 |
| Parameter | Plot |
|---|---|
| CZT HV Monitor | 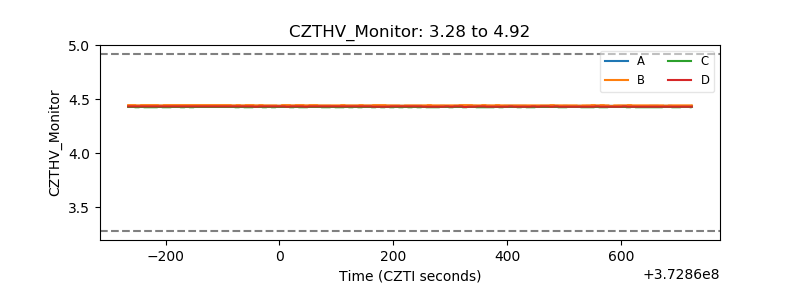 |
| D_VDD | 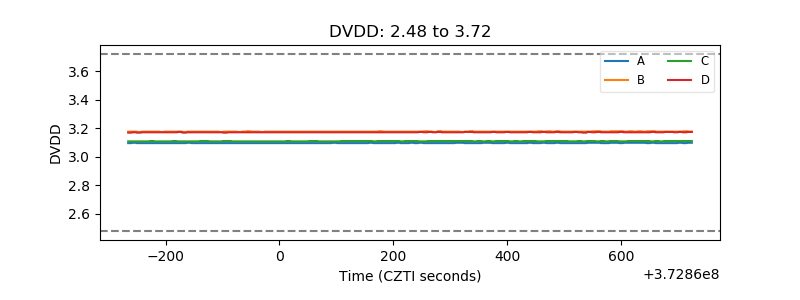 |
| Temperature 1 | 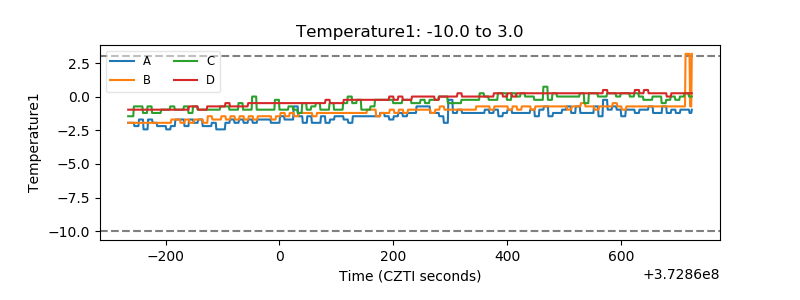 |
| Veto HV Monitor | 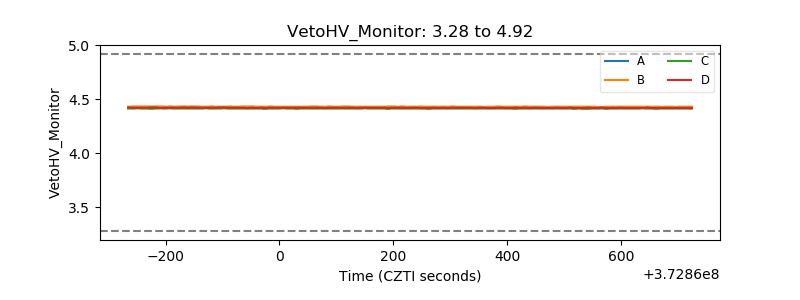 |
| Veto LLD | 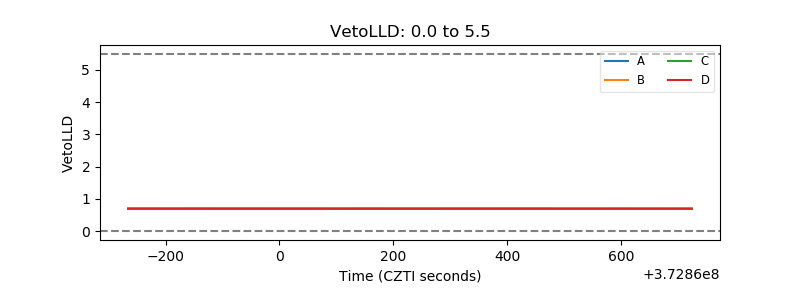 |
| Alpha Counter | 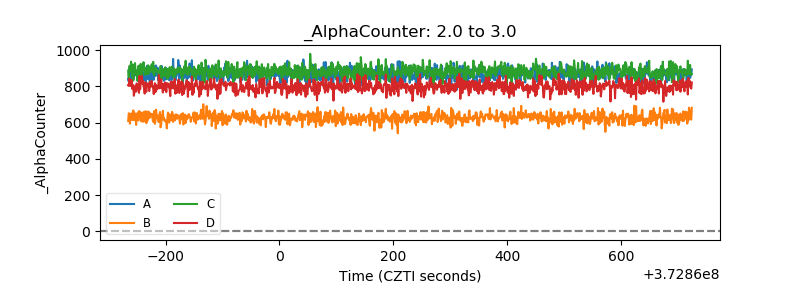 |
| _CPM_Rate | 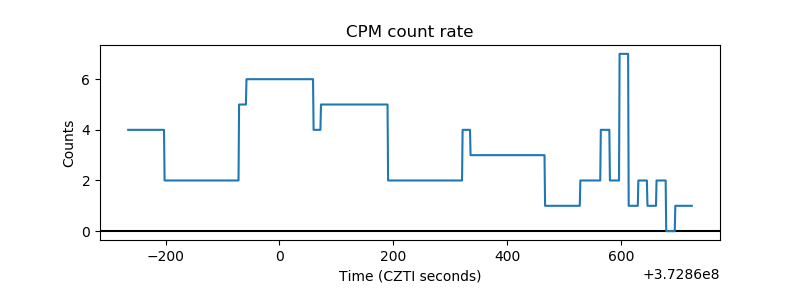 |
| CZT Counter | 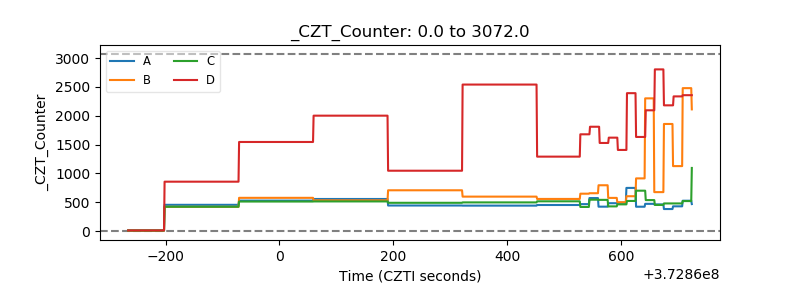 |
| +2.5 Volts monitor |  |
| +5 Volts monitor |  |
| _ROLL_ROT | 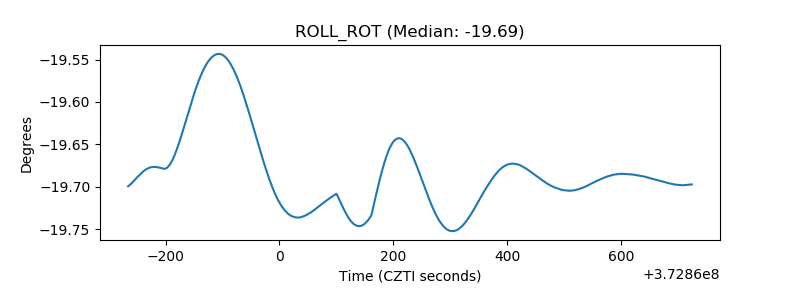 |
| _Roll_DEC | 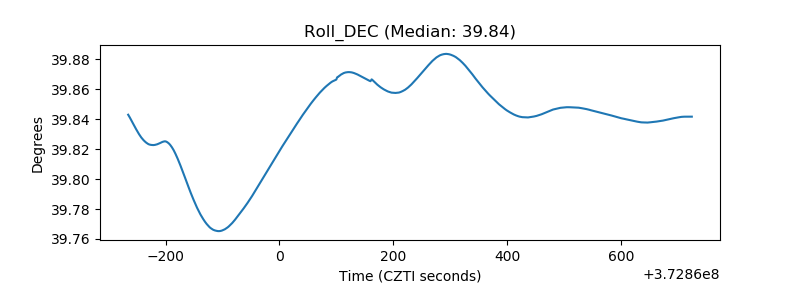 |
| _Roll_RA |  |
| Veto Counter | 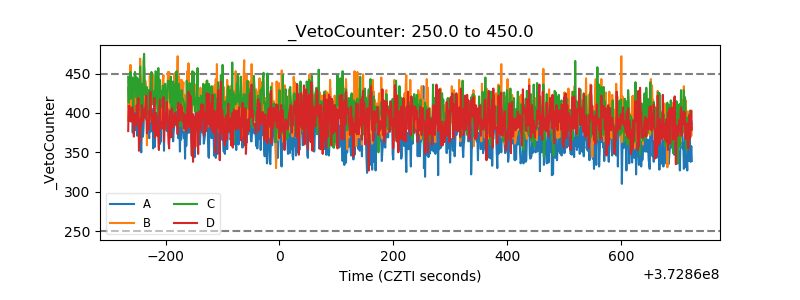 |