| Param | Original file | Final file |
|---|---|---|
| Filename | modeM0/AS1A11_088T02_9000004740_32852cztM0_level2.evt | modeM0/AS1A11_088T02_9000004740_32852cztM0_level2_quad_clean.evt |
| Size (bytes) | 1,161,889,920 | 114,197,760 |
| Size | 1.1 GB | 108.9 MB |
| Events in quadrant A | 5,069,062 | 699,056 |
| Events in quadrant B | 6,916,548 | 689,981 |
| Events in quadrant C | 6,369,818 | 687,790 |
| Events in quadrant D | 16,103,408 | 631,502 |
| Mode SS | |||
|---|---|---|---|
| Quadrant | BADHDUFLAG | Total packets | Discarded packets |
| A | 0 | 220 | 0 |
| B | 0 | 220 | 0 |
| C | 0 | 220 | 0 |
| D | 0 | 220 | 0 |
| Mode M0 | |||
|---|---|---|---|
| Quadrant | BADHDUFLAG | Total packets | Discarded packets |
| A | 0 | 22041 | 3 |
| B | 0 | 27477 | 2 |
| C | 0 | 25882 | 2 |
| D | 0 | 55509 | 2 |
| Mode M9 | |||
|---|---|---|---|
| Quadrant | BADHDUFLAG | Total packets | Discarded packets |
| A | 0 | 28 | 0 |
| B | 0 | 28 | 0 |
| C | 0 | 28 | 0 |
| D | 0 | 28 | 0 |
| Quadrant | Total seconds | Saturated seconds | Saturation percentage |
|---|---|---|---|
| A | 10829 | 15 | 0.138517% |
| B | 10829 | 487 | 4.497183% |
| C | 10829 | 253 | 2.336319% |
| D | 10829 | 2753 | 25.422477% |
Noise dominated data is calculated using 1-second bins in cleaned event files. If a bin has >2000 counts, and if more than 50% of those come from <1% of pixels, then it is considered to be noise-dominated and hence unusable.
| Quadrant | # 1 sec bins | Bins with >0 counts | Bins with >2000 counts | High rate bins dominated by noise | Noise dominated (total time) | Noise dominated (detector-on time) | Marked lightcurve |
|---|---|---|---|---|---|---|---|
| A | 13605 | 10831 | 4 | 4 | 0.03% | 0.04% | 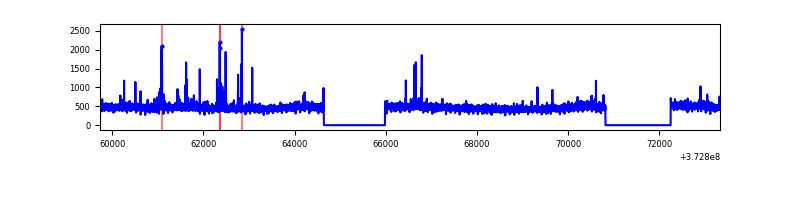 |
| B | 13605 | 10831 | 328 | 328 | 2.41% | 3.03% | 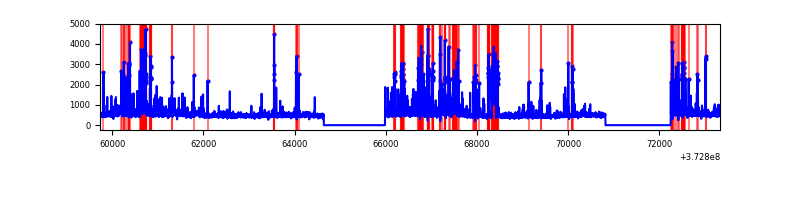 |
| C | 13605 | 10831 | 155 | 155 | 1.14% | 1.43% | 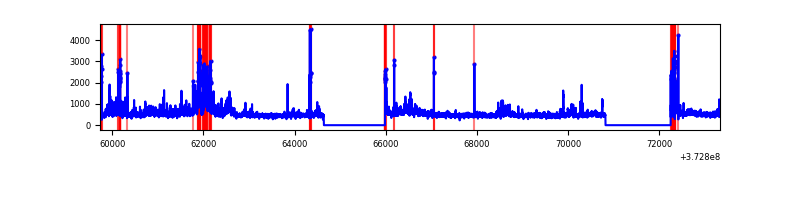 |
| D | 13605 | 10831 | 2390 | 2390 | 17.57% | 22.07% |  |
Top three noisy pixels from each quadrant. If the there are fewer than three noisy pixels in the level2.evt file, extra rows are filled as -1
| Pixel properties | Quadrant properties | ||||||
|---|---|---|---|---|---|---|---|
| Quadrant | DetID | PixID | Counts | Sigma | Mean | Median | Sigma |
| A | 9 | 143 | 81155 | 307.78 | 1278 | 1254 | 259.6 |
| A | 15 | 174 | 21850 | 79.34 | 1278 | 1254 | 259.6 |
| A | 13 | 254 | 20910 | 75.71 | 1278 | 1254 | 259.6 |
| B | 5 | 172 | 875604 | 3616.95 | 1262 | 1230 | 241.7 |
| B | 15 | 201 | 596563 | 2462.67 | 1262 | 1230 | 241.7 |
| B | 0 | 219 | 122225 | 500.51 | 1262 | 1230 | 241.7 |
| C | 3 | 233 | 897368 | 3162.91 | 1225 | 1235 | 283.3 |
| C | 0 | 10 | 454893 | 1601.19 | 1225 | 1235 | 283.3 |
| C | 1 | 241 | 86841 | 302.15 | 1225 | 1235 | 283.3 |
| D | 8 | 195 | 4480048 | 15637.05 | 1138 | 1111 | 286.4 |
| D | 12 | 227 | 2342228 | 8173.4 | 1138 | 1111 | 286.4 |
| D | 10 | 203 | 1389401 | 4846.86 | 1138 | 1111 | 286.4 |
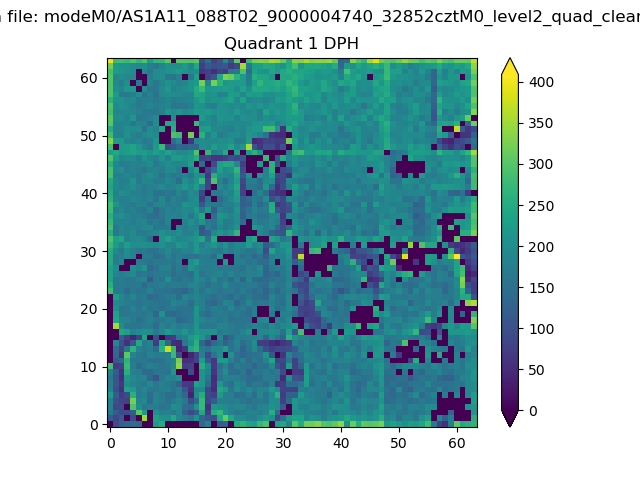
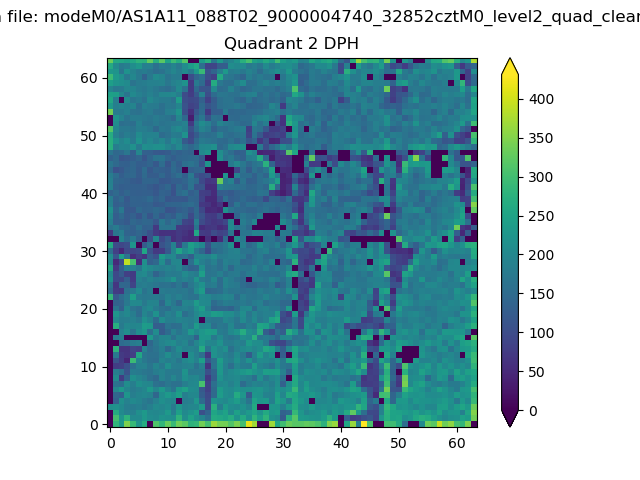
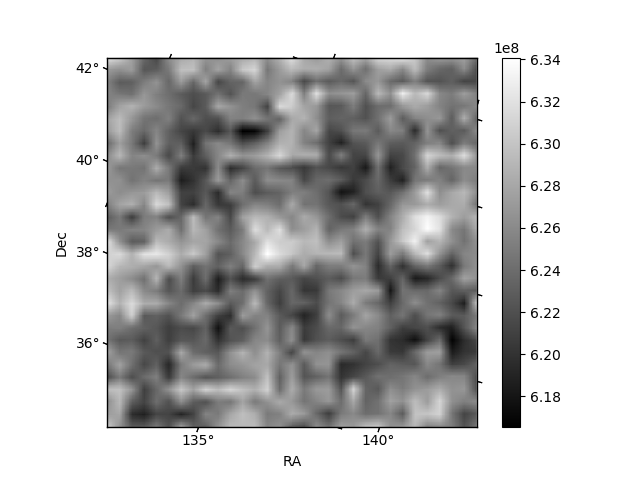
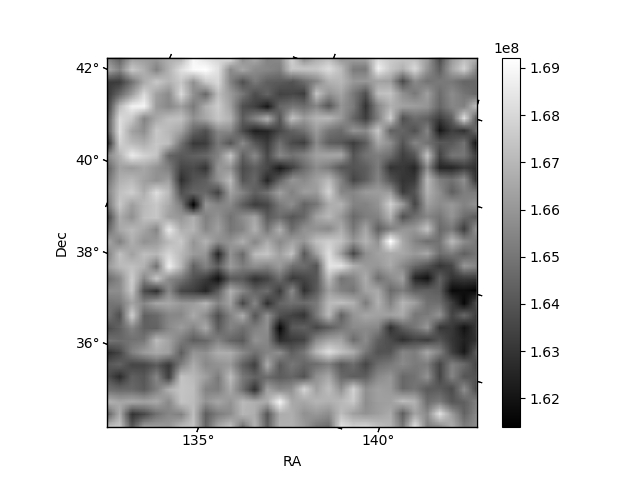
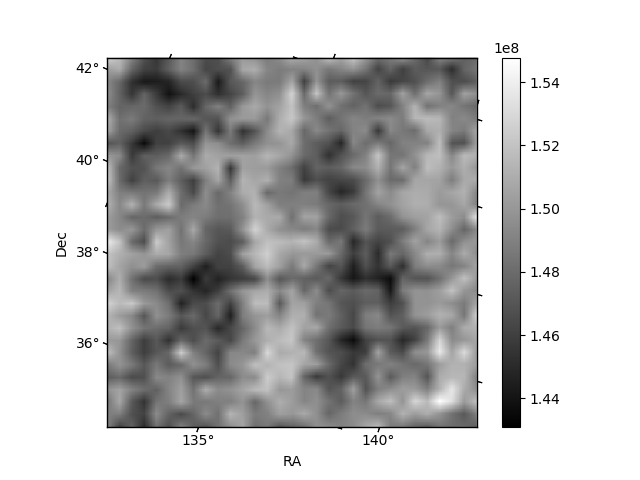
Histogram calculated using DETX and DETY for each event in the final _common_clean file
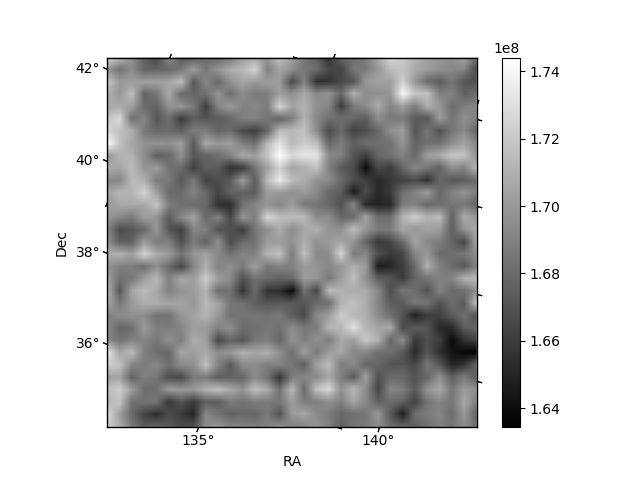
| Quadrant A | 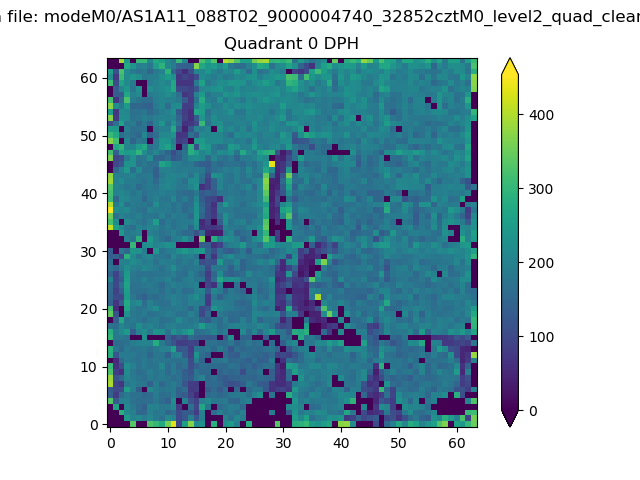 |
 |
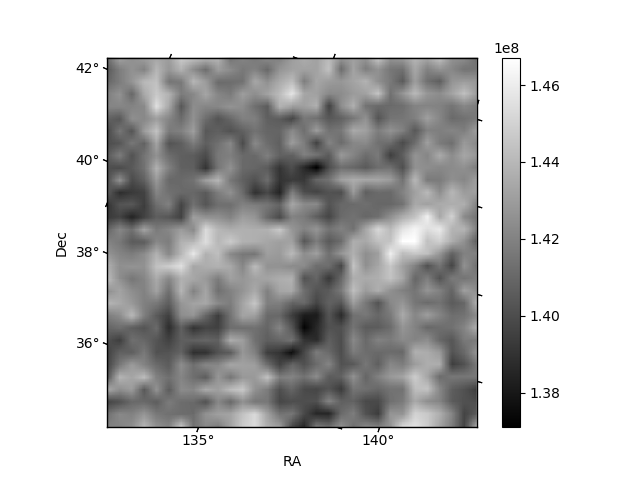
Quadrant B |
|---|---|---|---|
| Quadrant D | 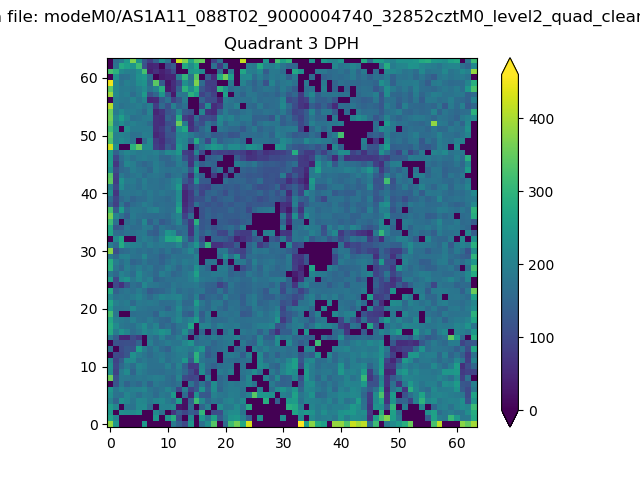 |
 |
Quadrant C |
| Plot type | Count rate plots | Images |
|---|---|---|
| Comparison with Poisson distribution Blue bars denote a histogram of data divided into 1 sec bins. Red curve is a Poisson curve with rate = median count rate of data. |
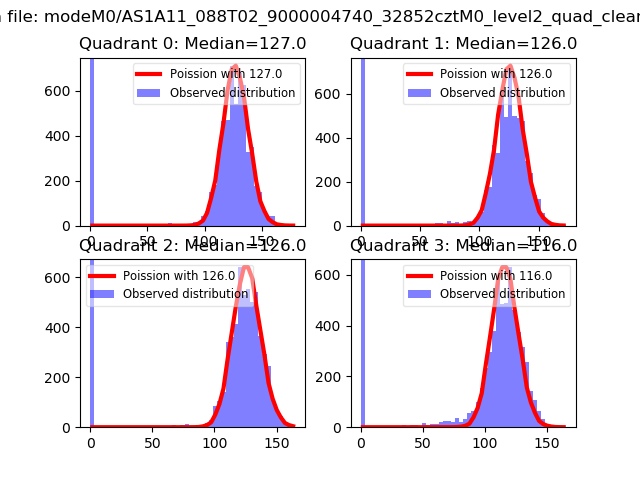 |
 |
| Quadrant-wise count rates Data is divided into 100 sec bins |
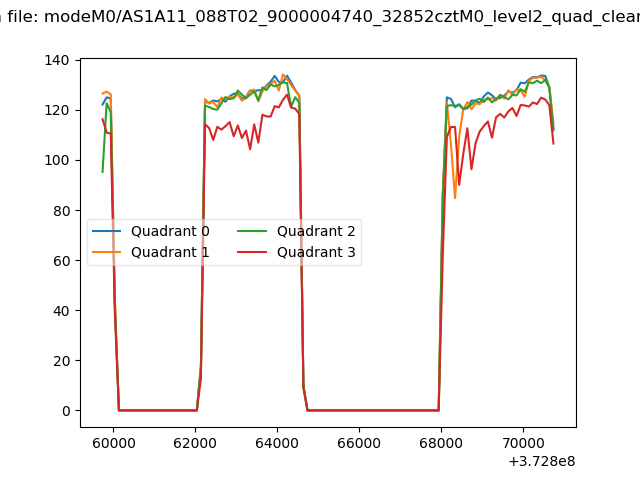 |
|
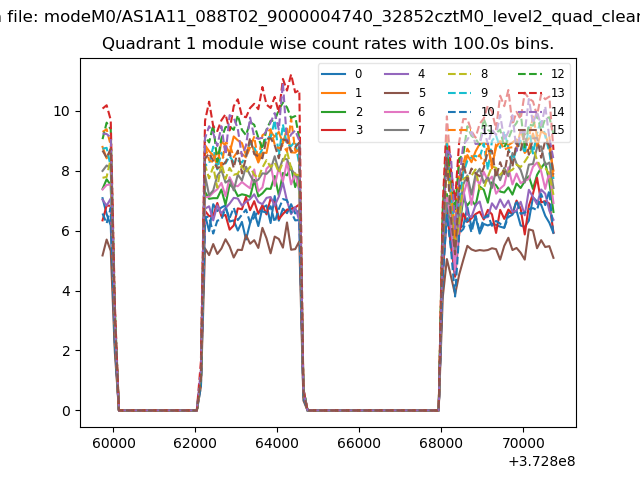
| Module-wise count rates for Quadrant A Data is divided into 100 sec bins |
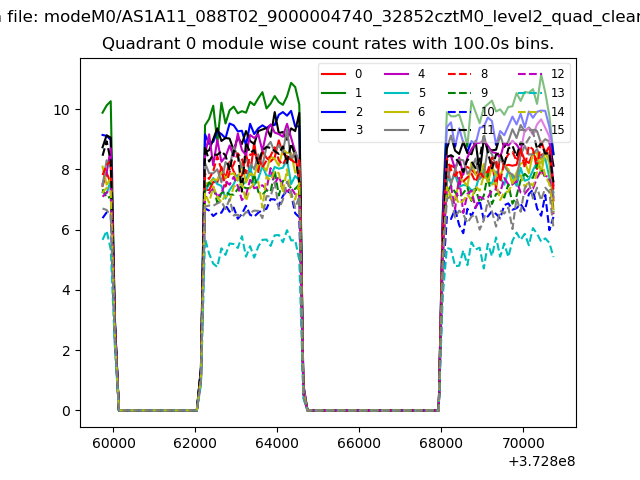 |
 |
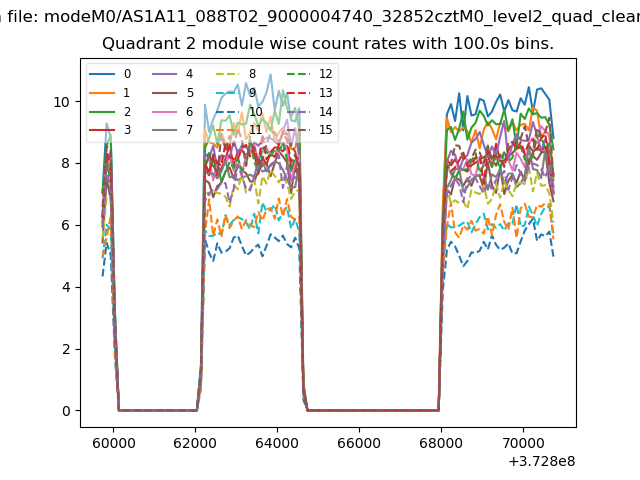
| Module-wise count rates for Quadrant B Data is divided into 100 sec bins |
 |
 |
| Module-wise count rates for Quadrant C Data is divided into 100 sec bins |
 |
 |
| Module-wise count rates for Quadrant D Data is divided into 100 sec bins |
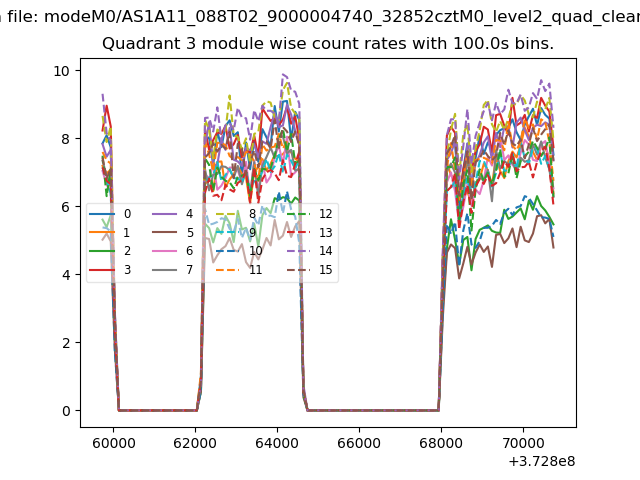 |
 |
| Parameter | Plot |
|---|---|
| CZT HV Monitor | 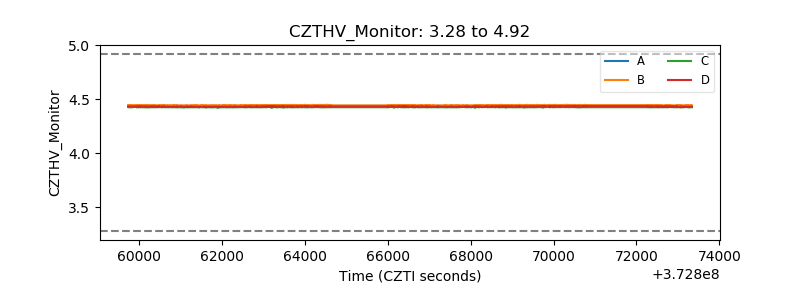 |
| D_VDD | 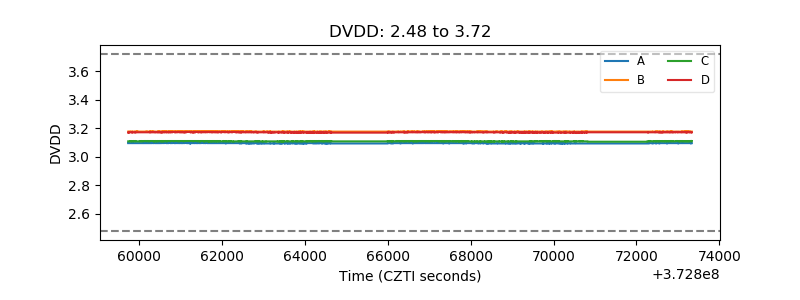 |
| Temperature 1 | 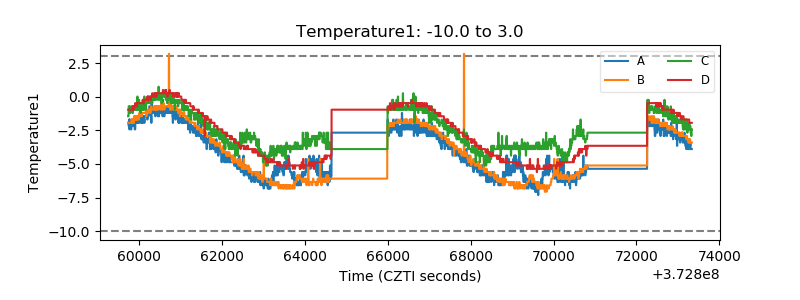 |
| Veto HV Monitor |  |
| Veto LLD | 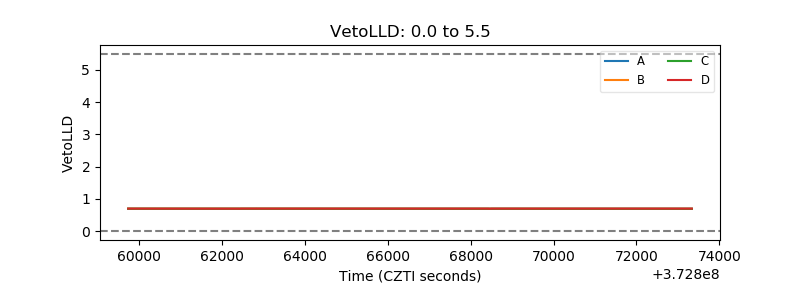 |
| Alpha Counter | 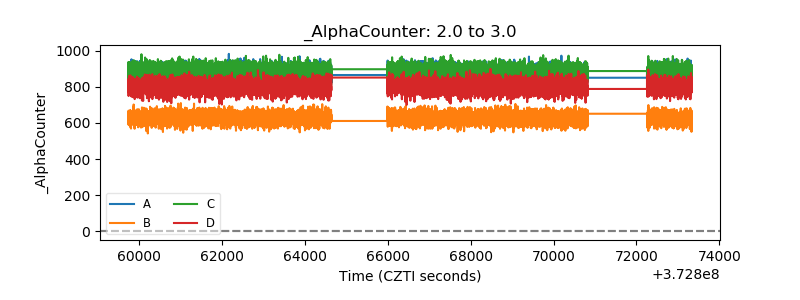 |
| _CPM_Rate | 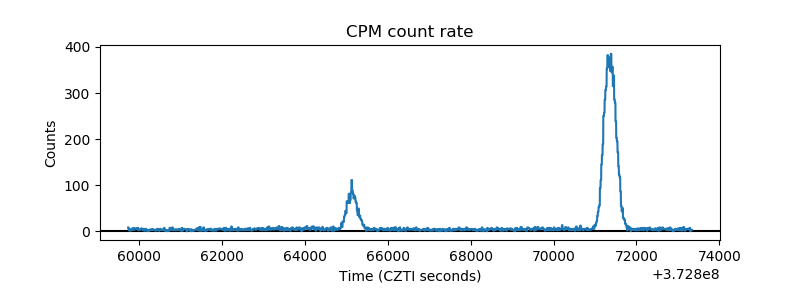 |
| CZT Counter | 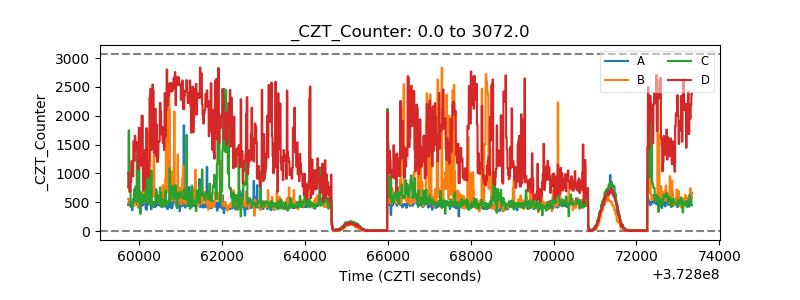 |
| +2.5 Volts monitor |  |
| +5 Volts monitor | 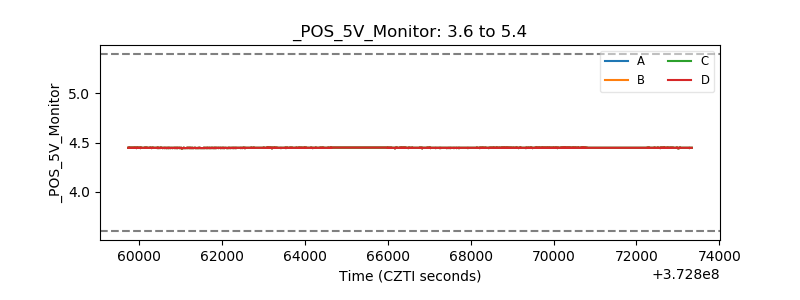 |
| _ROLL_ROT | 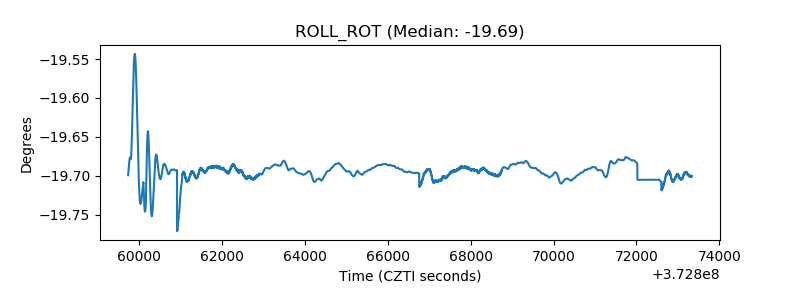 |
| _Roll_DEC | 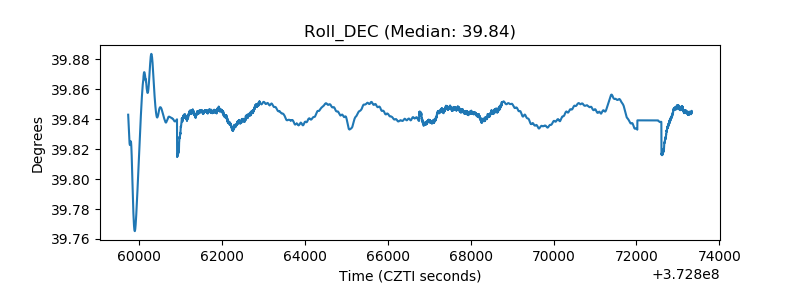 |
| _Roll_RA | 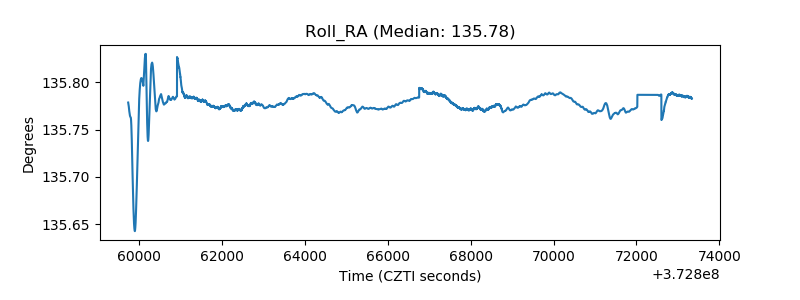 |
| Veto Counter | 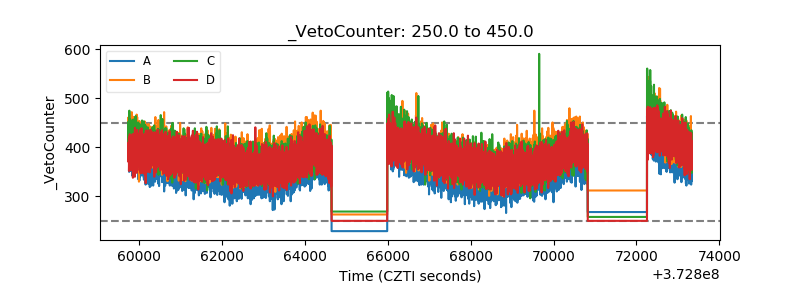 |