| Param | Original file | Final file |
|---|---|---|
| Filename | modeM0/AS1A11_088T02_9000004740_32853cztM0_level2.evt | modeM0/AS1A11_088T02_9000004740_32853cztM0_level2_quad_clean.evt |
| Size (bytes) | 247,147,200 | 13,818,240 |
| Size | 235.7 MB | 13.2 MB |
| Events in quadrant A | 1,031,203 | 66,352 |
| Events in quadrant B | 1,339,487 | 66,111 |
| Events in quadrant C | 1,261,186 | 66,162 |
| Events in quadrant D | 3,702,271 | 60,105 |
| Mode SS | |||
|---|---|---|---|
| Quadrant | BADHDUFLAG | Total packets | Discarded packets |
| A | 0 | 44 | 0 |
| B | 0 | 44 | 0 |
| C | 0 | 44 | 0 |
| D | 0 | 44 | 0 |
| Mode M0 | |||
|---|---|---|---|
| Quadrant | BADHDUFLAG | Total packets | Discarded packets |
| A | 0 | 4445 | 1 |
| B | 0 | 5382 | 1 |
| C | 0 | 5081 | 1 |
| D | 0 | 12534 | 1 |
| Mode M9 | |||
|---|---|---|---|
| Quadrant | BADHDUFLAG | Total packets | Discarded packets |
| A | 0 | 8 | 0 |
| B | 0 | 8 | 0 |
| C | 0 | 8 | 0 |
| D | 0 | 9 | 0 |
| Quadrant | Total seconds | Saturated seconds | Saturation percentage |
|---|---|---|---|
| A | 2196 | 2 | 0.091075% |
| B | 2196 | 61 | 2.777778% |
| C | 2196 | 96 | 4.371585% |
| D | 2196 | 684 | 31.147541% |
Noise dominated data is calculated using 1-second bins in cleaned event files. If a bin has >2000 counts, and if more than 50% of those come from <1% of pixels, then it is considered to be noise-dominated and hence unusable.
| Quadrant | # 1 sec bins | Bins with >0 counts | Bins with >2000 counts | High rate bins dominated by noise | Noise dominated (total time) | Noise dominated (detector-on time) | Marked lightcurve |
|---|---|---|---|---|---|---|---|
| A | 2196 | 2196 | 0 | 0 | 0.00% | 0.00% | 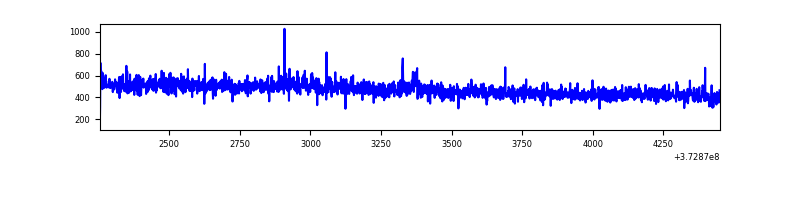 |
| B | 2196 | 2196 | 41 | 41 | 1.87% | 1.87% | 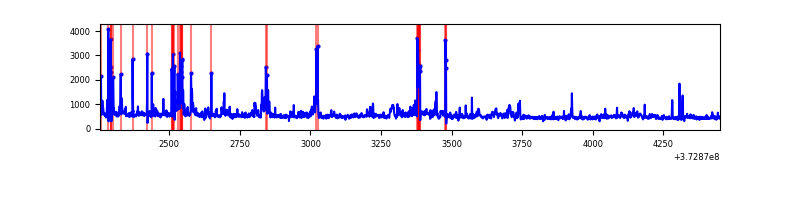 |
| C | 2196 | 2196 | 42 | 42 | 1.91% | 1.91% | 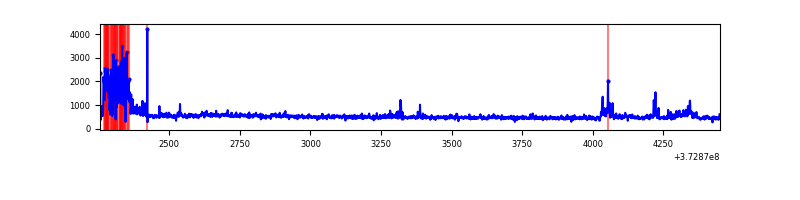 |
| D | 2196 | 2196 | 550 | 550 | 25.05% | 25.05% | 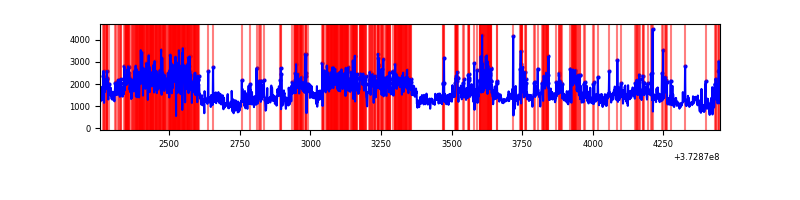 |
Top three noisy pixels from each quadrant. If the there are fewer than three noisy pixels in the level2.evt file, extra rows are filled as -1
| Pixel properties | Quadrant properties | ||||||
|---|---|---|---|---|---|---|---|
| Quadrant | DetID | PixID | Counts | Sigma | Mean | Median | Sigma |
| A | 9 | 143 | 8254 | 144.34 | 264 | 259 | 55.4 |
| A | 13 | 254 | 4415 | 75.03 | 264 | 259 | 55.4 |
| A | 13 | 6 | 2840 | 46.6 | 264 | 259 | 55.4 |
| B | 5 | 172 | 174126 | 3374.79 | 261 | 254 | 51.5 |
| B | 0 | 219 | 51090 | 986.71 | 261 | 254 | 51.5 |
| B | 10 | 244 | 22292 | 427.75 | 261 | 254 | 51.5 |
| C | 0 | 10 | 185357 | 3098.55 | 250 | 252 | 59.7 |
| C | 3 | 233 | 64395 | 1073.72 | 250 | 252 | 59.7 |
| C | 7 | 247 | 10844 | 177.3 | 250 | 252 | 59.7 |
| D | 8 | 195 | 980091 | 16162.45 | 237 | 231 | 60.6 |
| D | 12 | 227 | 816791 | 13468.87 | 237 | 231 | 60.6 |
| D | 2 | 249 | 309870 | 5107.39 | 237 | 231 | 60.6 |
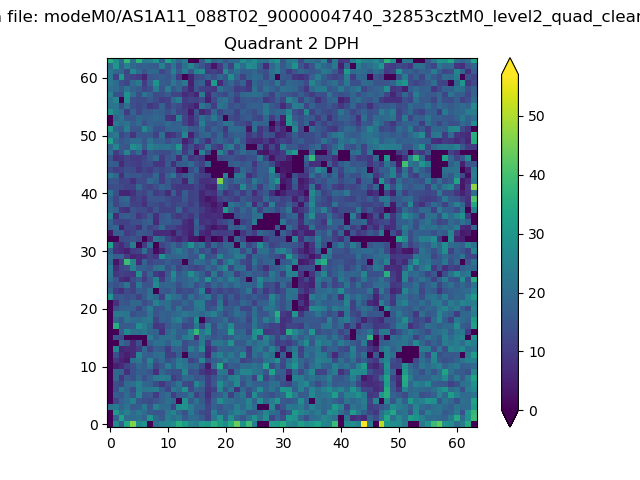
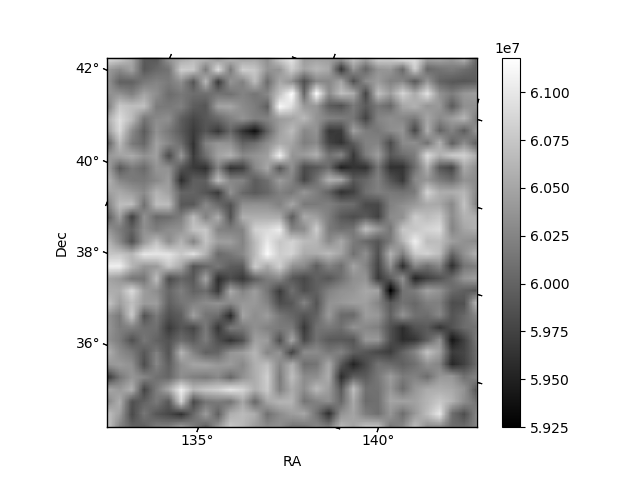
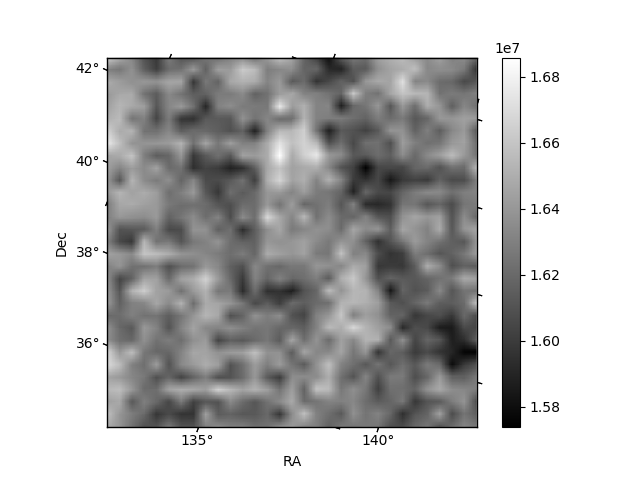
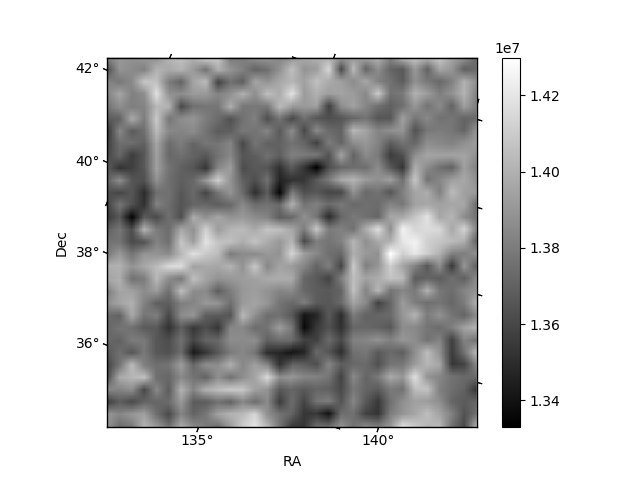
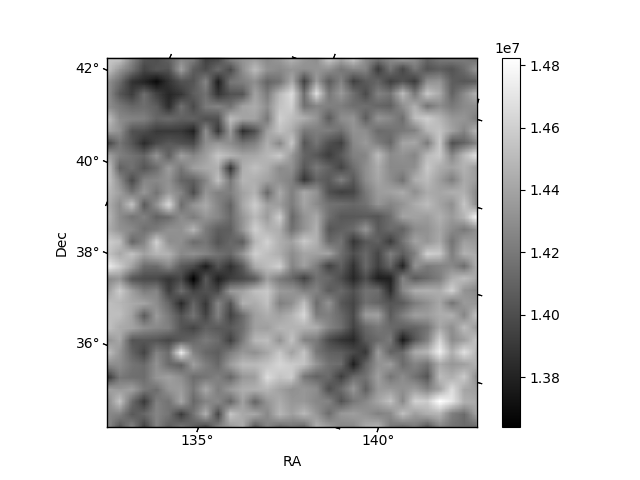
Histogram calculated using DETX and DETY for each event in the final _common_clean file
| Quadrant A | 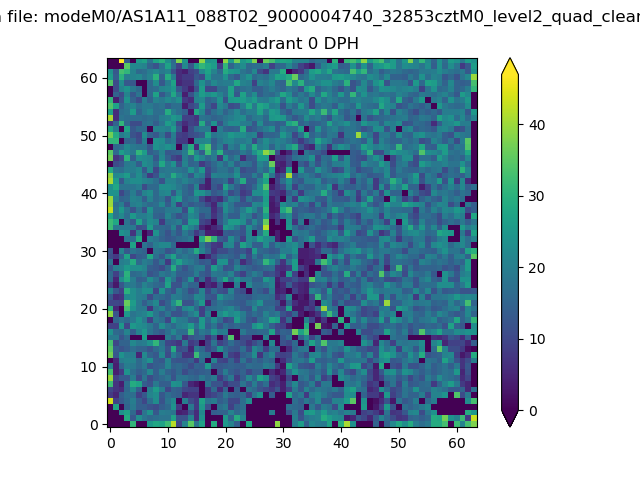 |
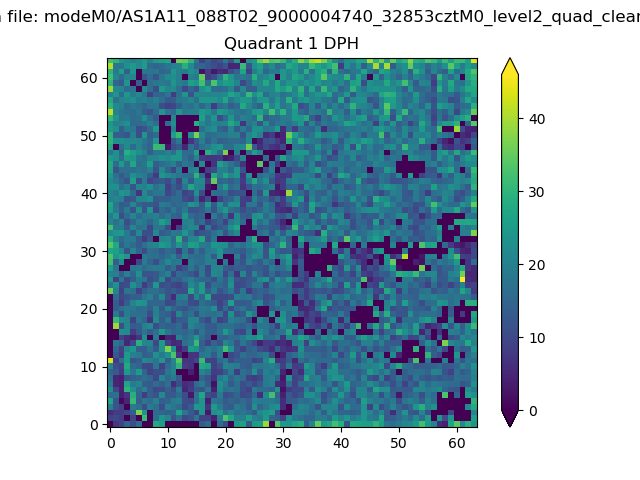 |
Quadrant B |
|---|---|---|---|
| Quadrant D | 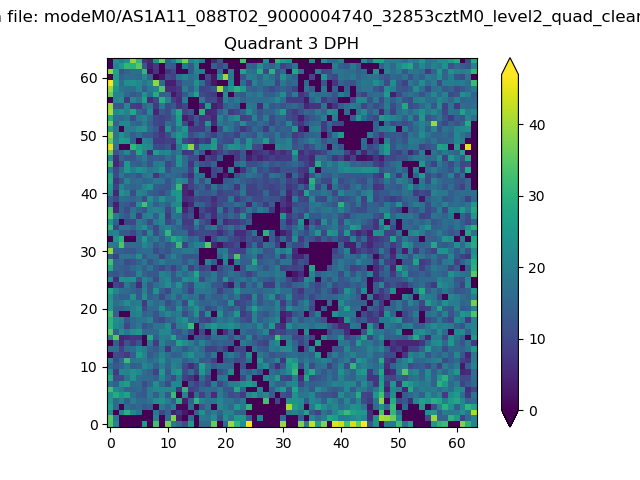 |
 |
Quadrant C |
| Plot type | Count rate plots | Images |
|---|---|---|
| Comparison with Poisson distribution Blue bars denote a histogram of data divided into 1 sec bins. Red curve is a Poisson curve with rate = median count rate of data. |
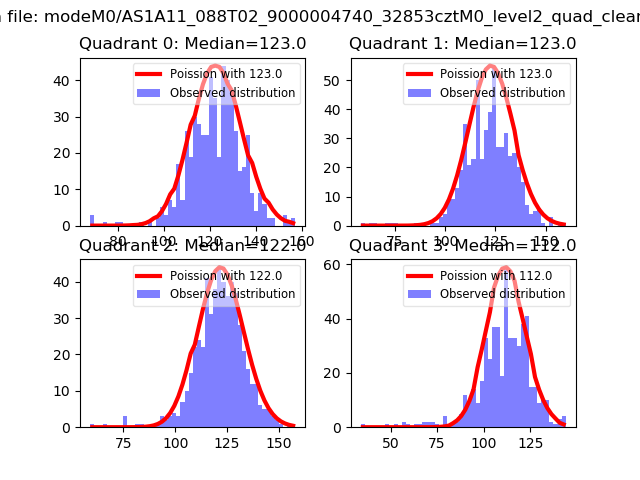 |
 |
| Quadrant-wise count rates Data is divided into 100 sec bins |
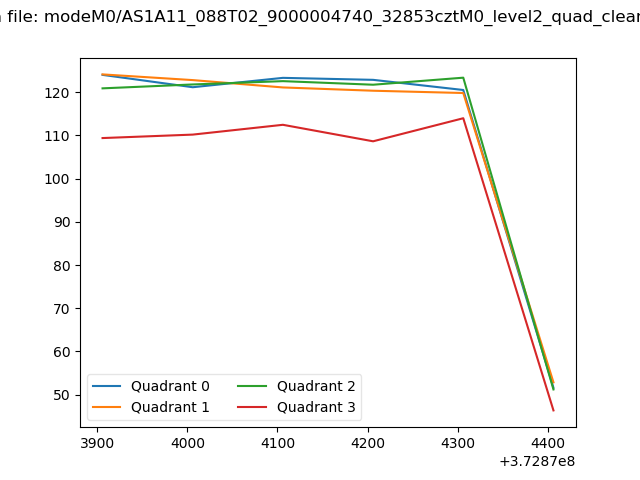 |
|
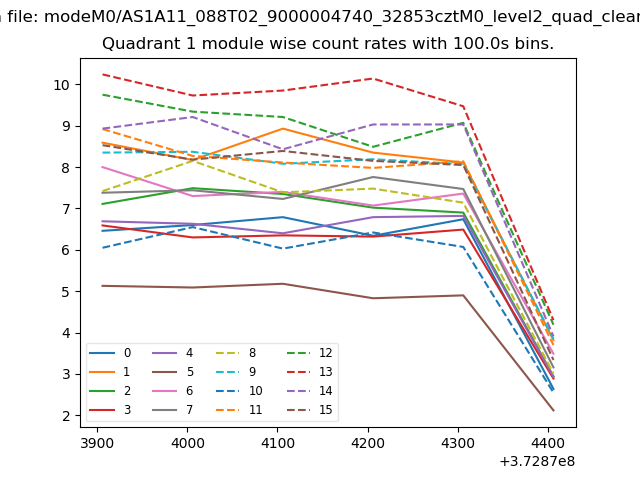
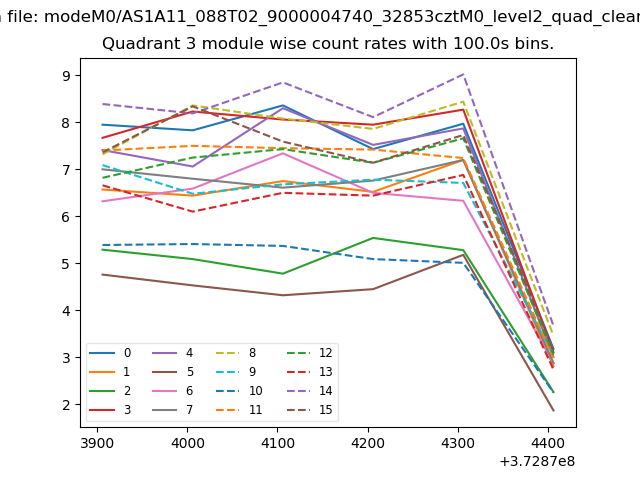
| Module-wise count rates for Quadrant A Data is divided into 100 sec bins |
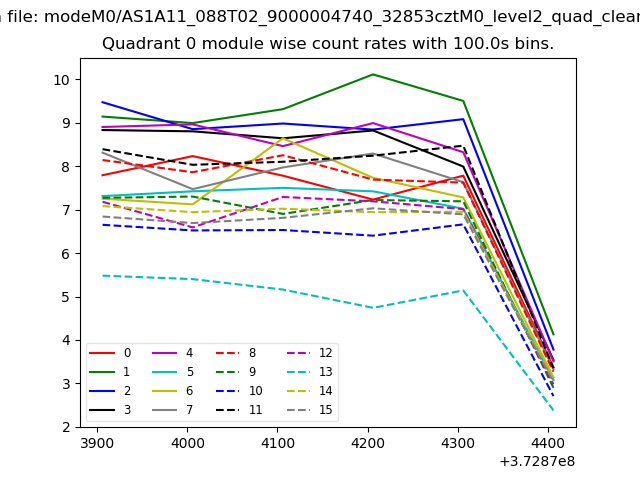 |
 |
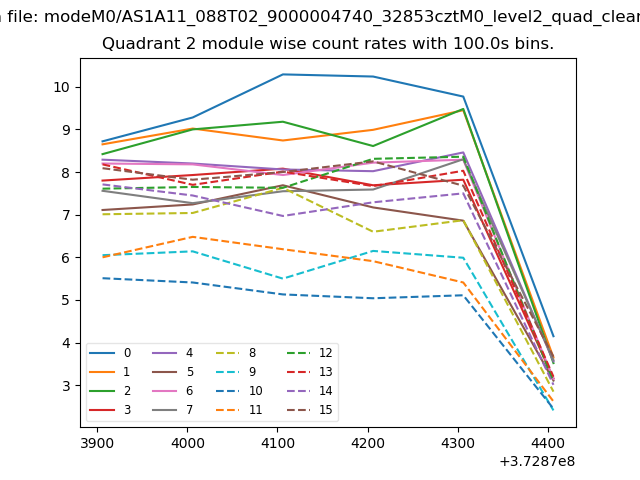
| Module-wise count rates for Quadrant B Data is divided into 100 sec bins |
 |
 |
| Module-wise count rates for Quadrant C Data is divided into 100 sec bins |
 |
 |
| Module-wise count rates for Quadrant D Data is divided into 100 sec bins |
 |
 |
| Parameter | Plot |
|---|---|
| CZT HV Monitor | 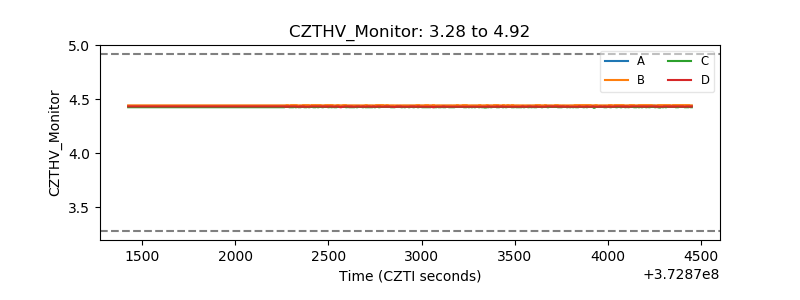 |
| D_VDD | 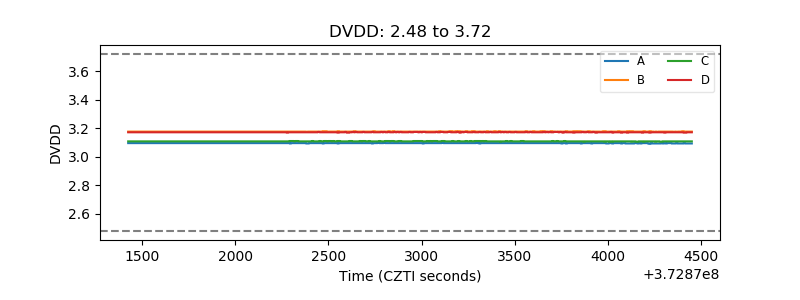 |
| Temperature 1 |  |
| Veto HV Monitor | 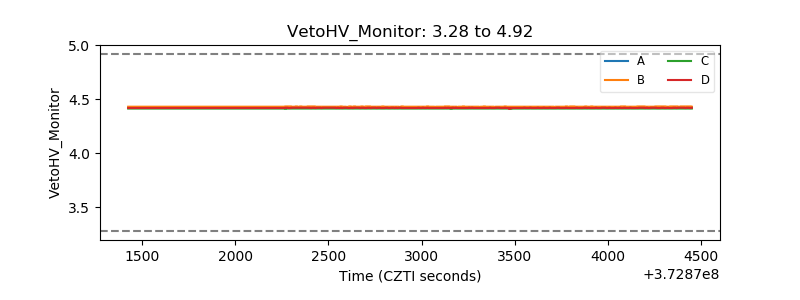 |
| Veto LLD | 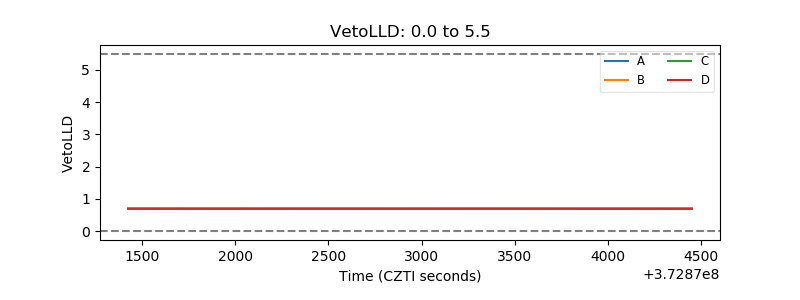 |
| Alpha Counter | 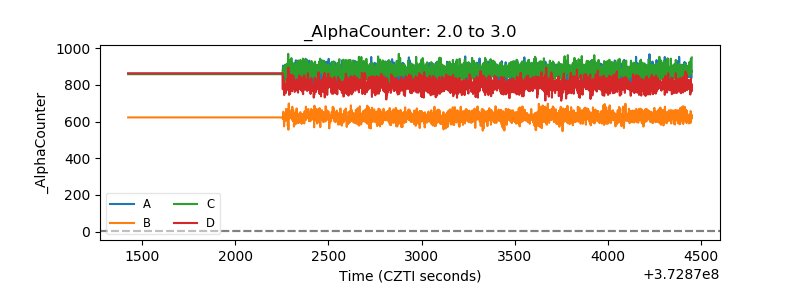 |
| _CPM_Rate | 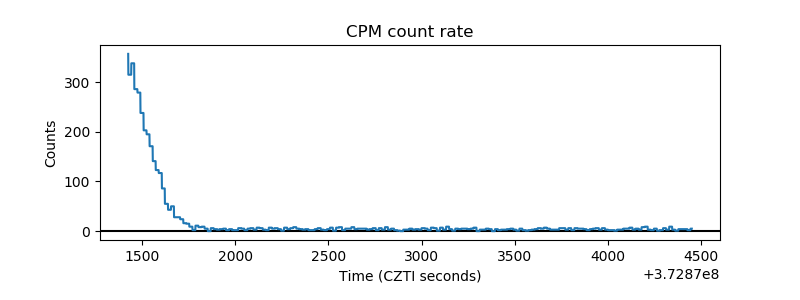 |
| CZT Counter | 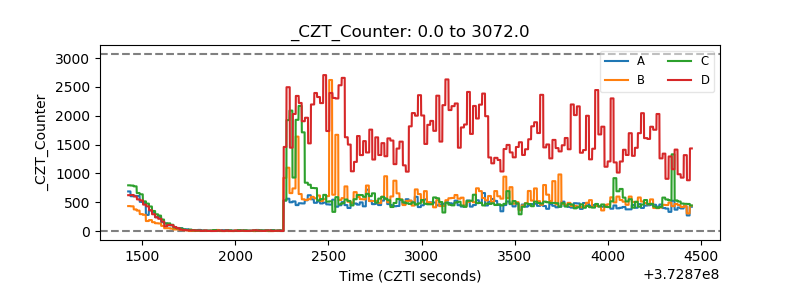 |
| +2.5 Volts monitor |  |
| +5 Volts monitor |  |
| _ROLL_ROT | 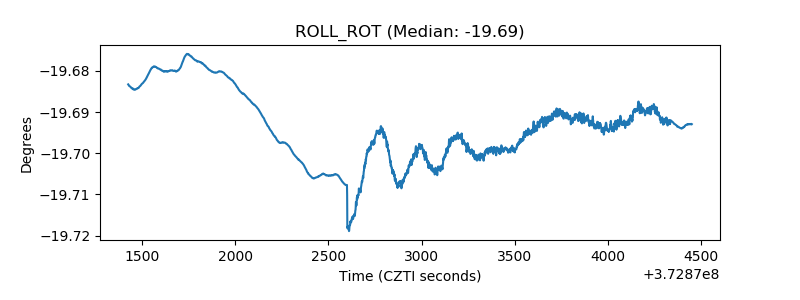 |
| _Roll_DEC | 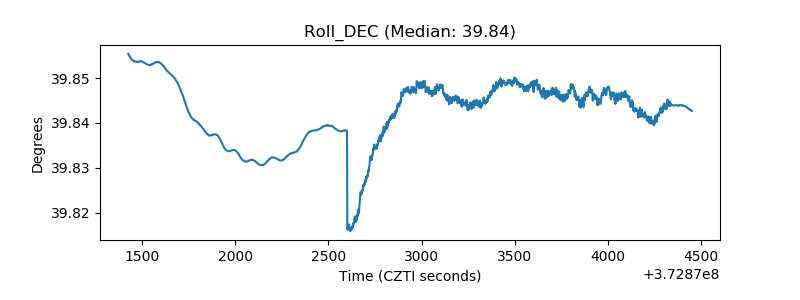 |
| _Roll_RA | 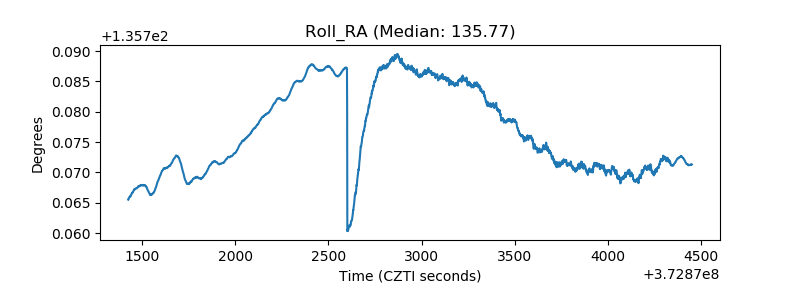 |
| Veto Counter | 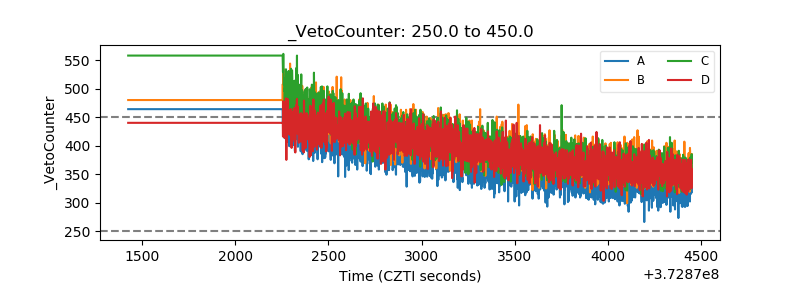 |