| Param | Original file | Final file |
|---|---|---|
| Filename | modeM0/AS1C06_010T05_9000004736_32845cztM0_level2.evt | modeM0/AS1C06_010T05_9000004736_32845cztM0_level2_quad_clean.evt |
| Size (bytes) | 377,326,080 | 69,246,720 |
| Size | 359.8 MB | 66.0 MB |
| Events in quadrant A | 1,639,516 | 481,725 |
| Events in quadrant B | 2,702,700 | 477,746 |
| Events in quadrant C | 2,998,944 | 467,527 |
| Events in quadrant D | 3,848,420 | 421,751 |
| Mode M9 | |||
|---|---|---|---|
| Quadrant | BADHDUFLAG | Total packets | Discarded packets |
| A | 0 | 21 | 0 |
| B | 0 | 21 | 0 |
| C | 0 | 21 | 0 |
| D | 0 | 21 | 0 |
| Mode M0 | |||
|---|---|---|---|
| Quadrant | BADHDUFLAG | Total packets | Discarded packets |
| A | 0 | 7063 | 2 |
| B | 0 | 10323 | 1 |
| C | 0 | 11285 | 1 |
| D | 0 | 13828 | 1 |
| Mode SS | |||
|---|---|---|---|
| Quadrant | BADHDUFLAG | Total packets | Discarded packets |
| A | 0 | 74 | 0 |
| B | 0 | 74 | 0 |
| C | 0 | 74 | 0 |
| D | 0 | 74 | 0 |
| Quadrant | Total seconds | Saturated seconds | Saturation percentage |
|---|---|---|---|
| A | 3489 | 5 | 0.143308% |
| B | 3489 | 294 | 8.426483% |
| C | 3489 | 144 | 4.127257% |
| D | 3489 | 521 | 14.932645% |
Noise dominated data is calculated using 1-second bins in cleaned event files. If a bin has >2000 counts, and if more than 50% of those come from <1% of pixels, then it is considered to be noise-dominated and hence unusable.
| Quadrant | # 1 sec bins | Bins with >0 counts | Bins with >2000 counts | High rate bins dominated by noise | Noise dominated (total time) | Noise dominated (detector-on time) | Marked lightcurve |
|---|---|---|---|---|---|---|---|
| A | 5642 | 3490 | 2 | 2 | 0.04% | 0.06% | 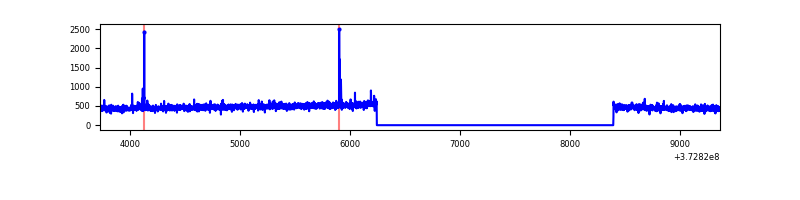 |
| B | 5642 | 3490 | 204 | 204 | 3.62% | 5.85% | 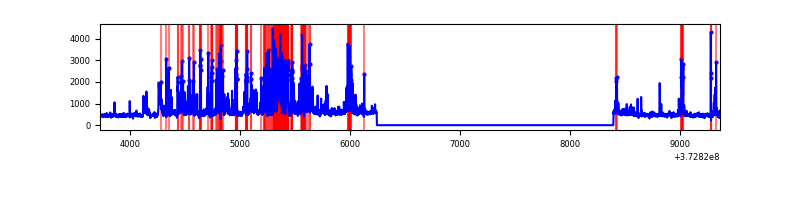 |
| C | 5642 | 3490 | 103 | 103 | 1.83% | 2.95% | 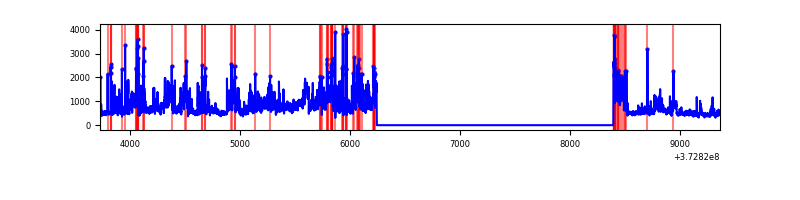 |
| D | 5642 | 3490 | 380 | 380 | 6.74% | 10.89% | 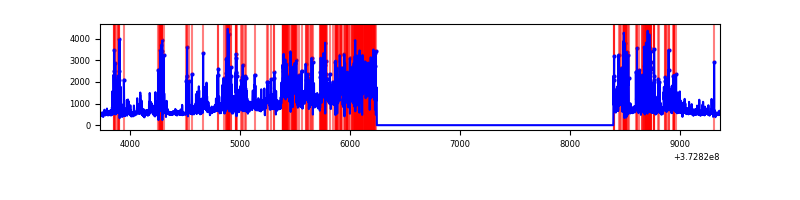 |
Top three noisy pixels from each quadrant. If the there are fewer than three noisy pixels in the level2.evt file, extra rows are filled as -1
| Pixel properties | Quadrant properties | ||||||
|---|---|---|---|---|---|---|---|
| Quadrant | DetID | PixID | Counts | Sigma | Mean | Median | Sigma |
| A | 7 | 16 | 12250 | 141.85 | 418 | 411 | 83.5 |
| A | 13 | 254 | 7310 | 82.66 | 418 | 411 | 83.5 |
| A | 9 | 143 | 4805 | 52.65 | 418 | 411 | 83.5 |
| B | 5 | 172 | 826344 | 10763.35 | 406 | 398 | 76.7 |
| B | 12 | 1 | 56103 | 725.92 | 406 | 398 | 76.7 |
| B | 0 | 219 | 38637 | 498.31 | 406 | 398 | 76.7 |
| C | 9 | 160 | 1186703 | 13090.06 | 395 | 398 | 90.6 |
| C | 3 | 233 | 163658 | 1801.46 | 395 | 398 | 90.6 |
| C | 0 | 10 | 40793 | 445.73 | 395 | 398 | 90.6 |
| D | 2 | 250 | 770551 | 8138.16 | 377 | 368 | 94.6 |
| D | 8 | 195 | 678183 | 7162.15 | 377 | 368 | 94.6 |
| D | 12 | 6 | 346004 | 3652.17 | 377 | 368 | 94.6 |
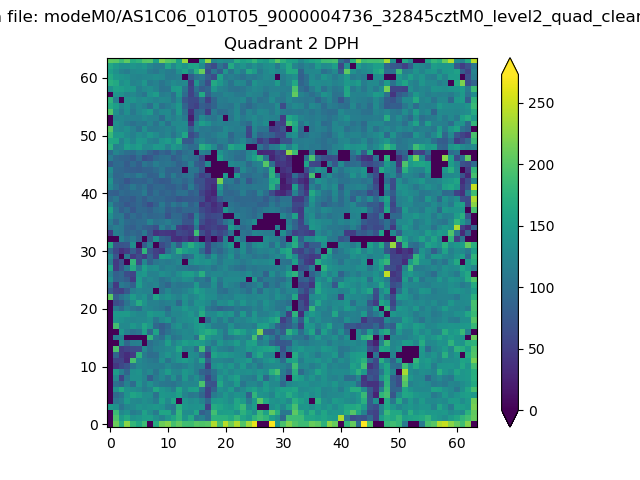
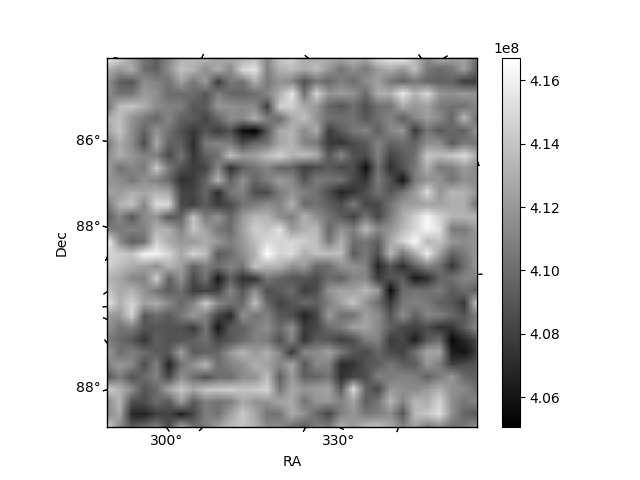
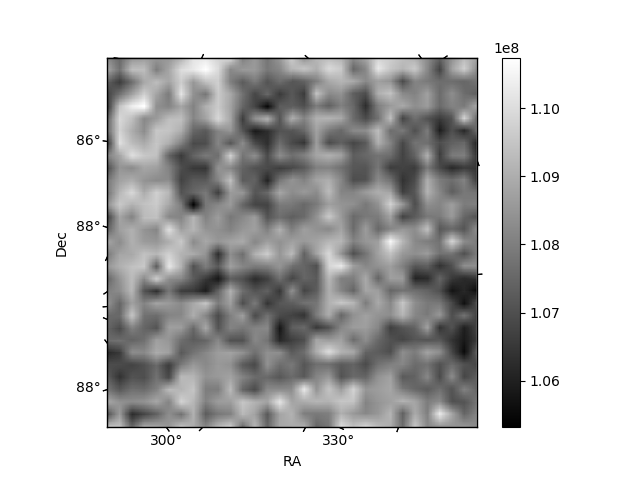
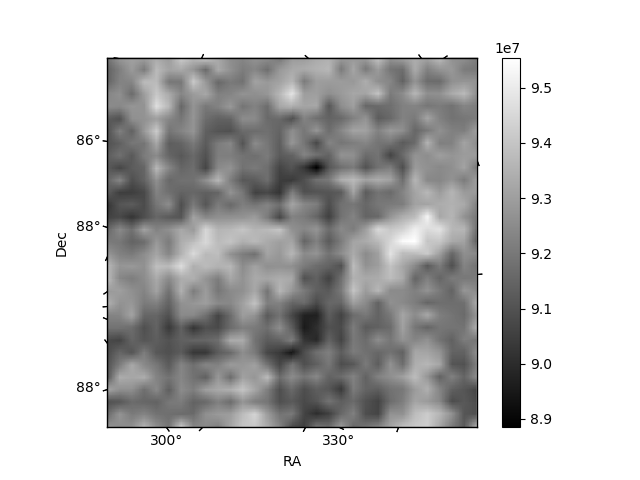
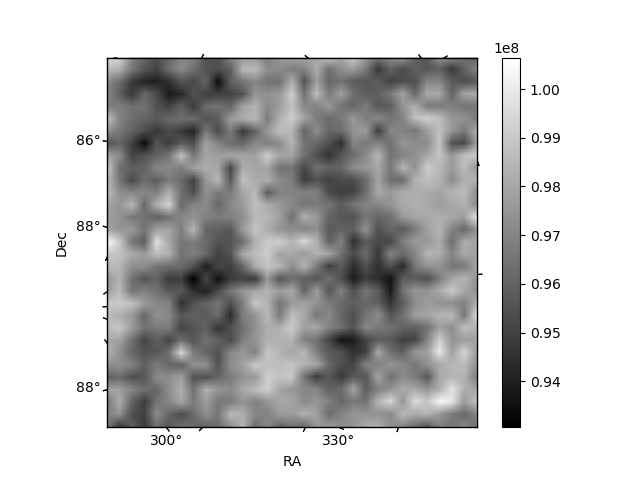
Histogram calculated using DETX and DETY for each event in the final _common_clean file
| Quadrant A | 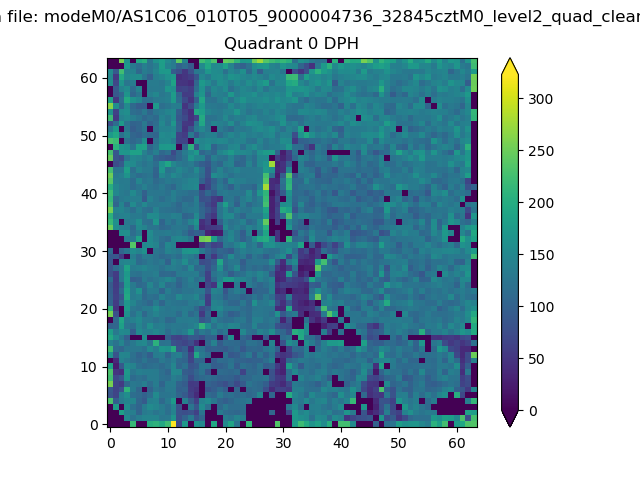 |
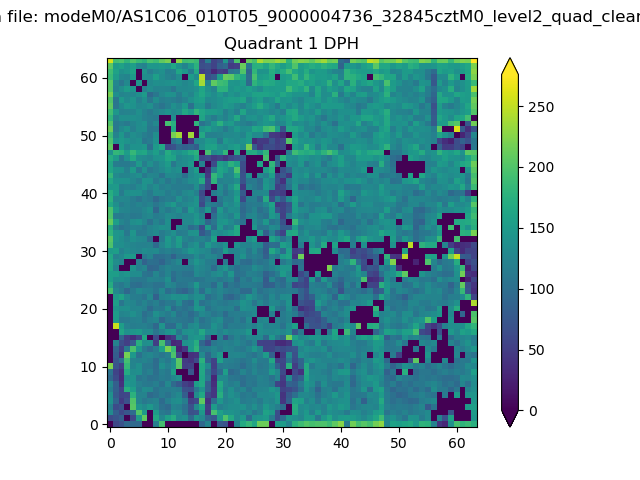 |
Quadrant B |
|---|---|---|---|
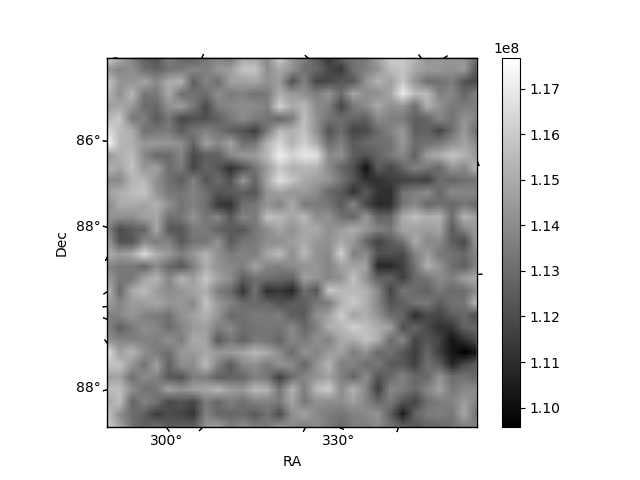
| Quadrant D | 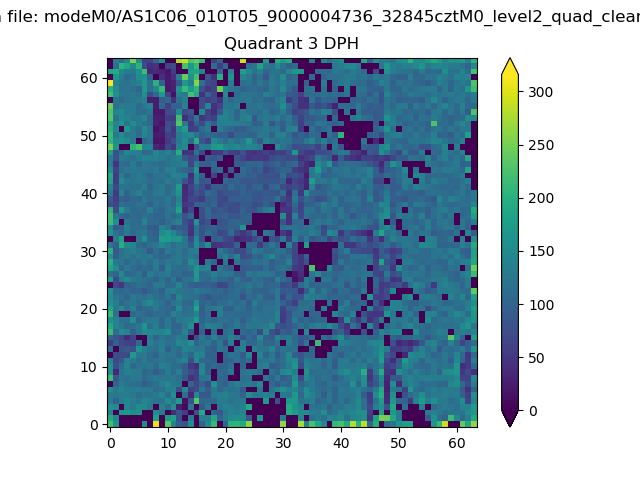 |
 |
Quadrant C |
| Plot type | Count rate plots | Images |
|---|---|---|
| Comparison with Poisson distribution Blue bars denote a histogram of data divided into 1 sec bins. Red curve is a Poisson curve with rate = median count rate of data. |
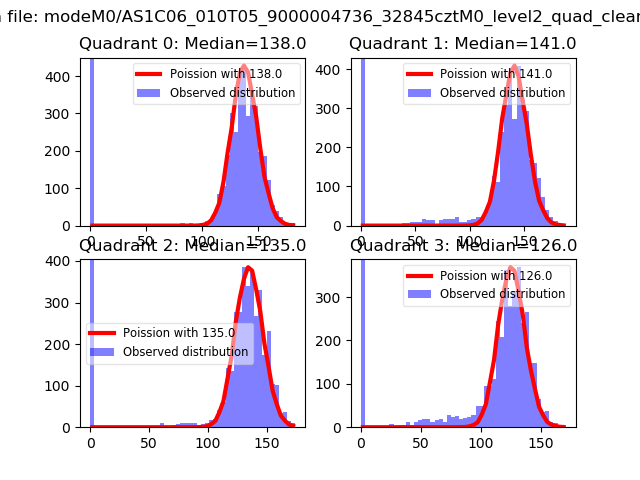 |
 |
| Quadrant-wise count rates Data is divided into 100 sec bins |
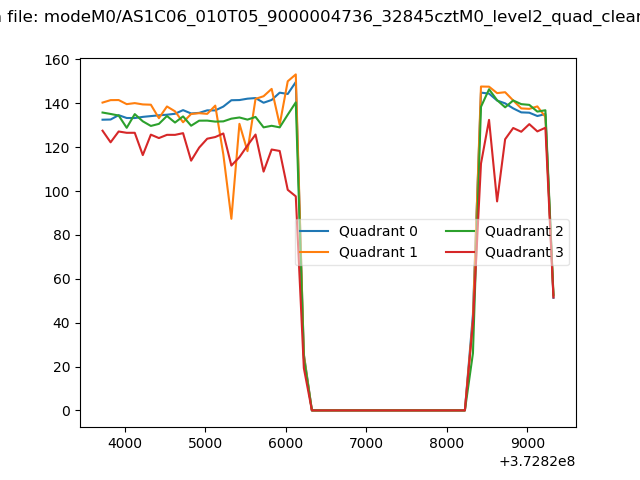 |
|
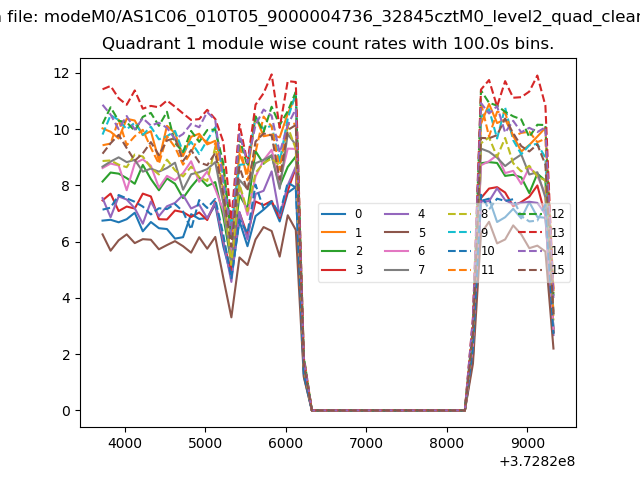
| Module-wise count rates for Quadrant A Data is divided into 100 sec bins |
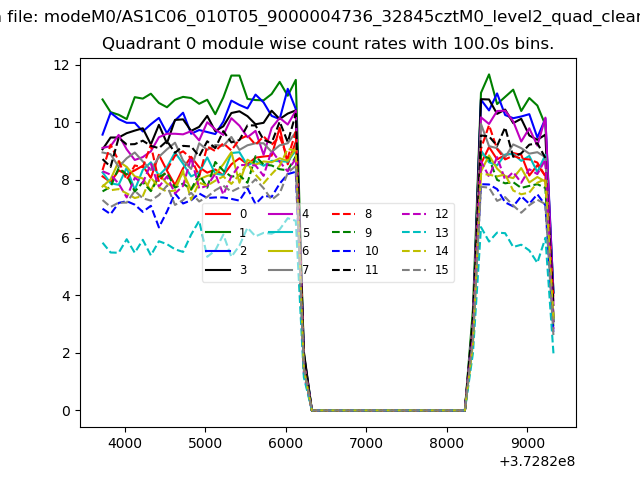 |
 |
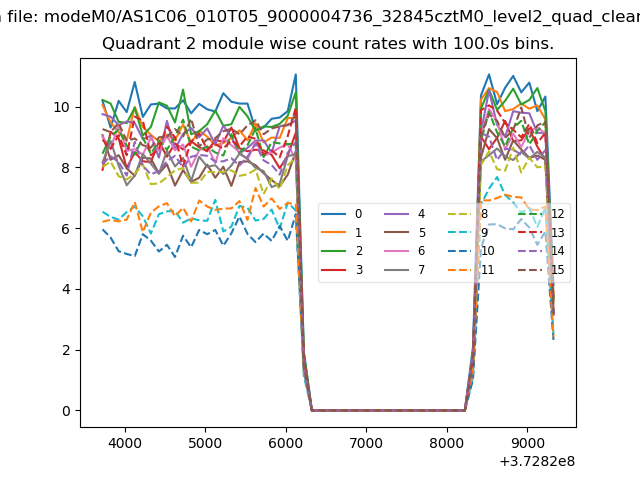
| Module-wise count rates for Quadrant B Data is divided into 100 sec bins |
 |
 |
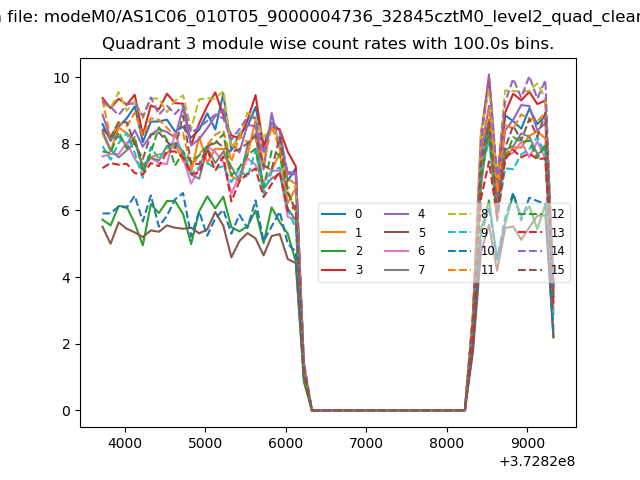
| Module-wise count rates for Quadrant C Data is divided into 100 sec bins |
 |
 |
| Module-wise count rates for Quadrant D Data is divided into 100 sec bins |
 |
 |
| Parameter | Plot |
|---|---|
| CZT HV Monitor | 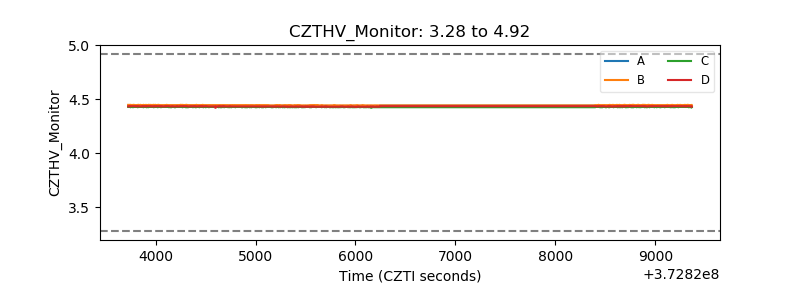 |
| D_VDD | 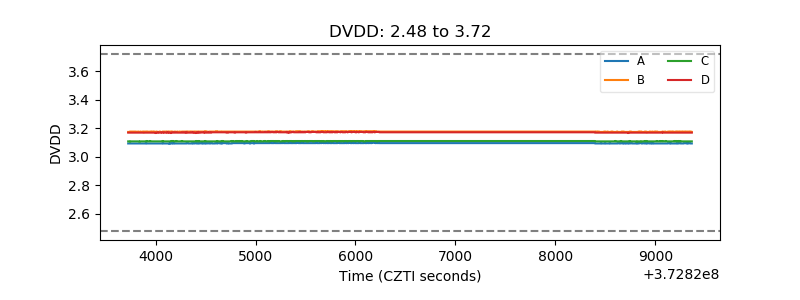 |
| Temperature 1 | 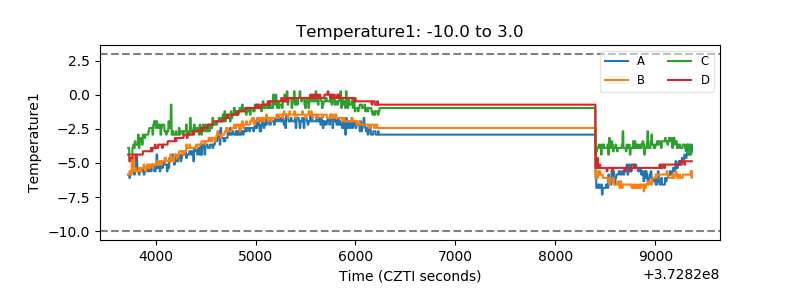 |
| Veto HV Monitor | 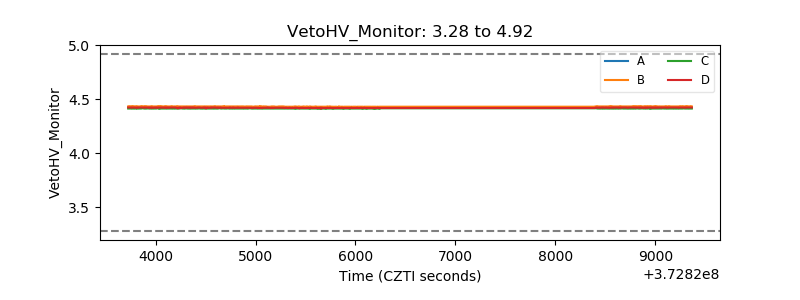 |
| Veto LLD | 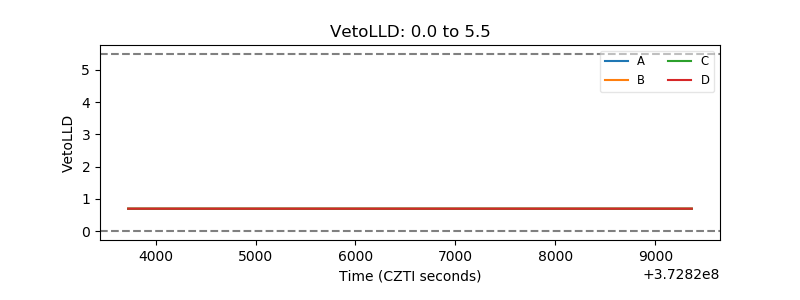 |
| Alpha Counter | 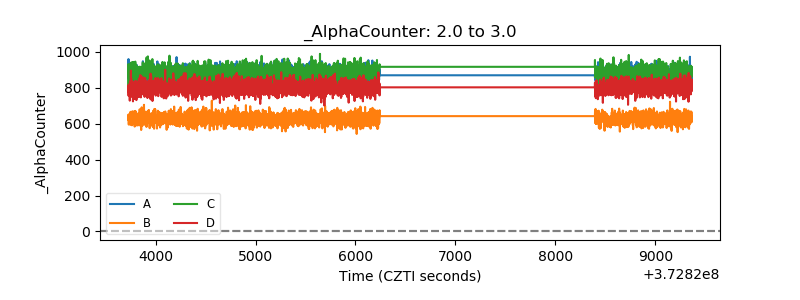 |
| _CPM_Rate | 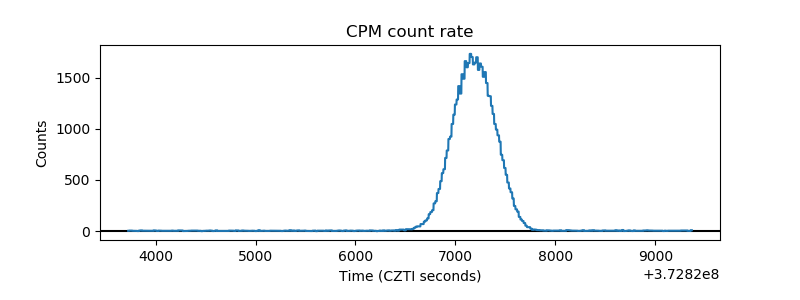 |
| CZT Counter | 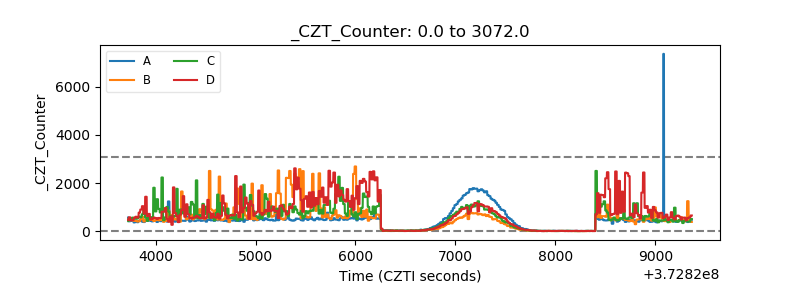 |
| +2.5 Volts monitor | 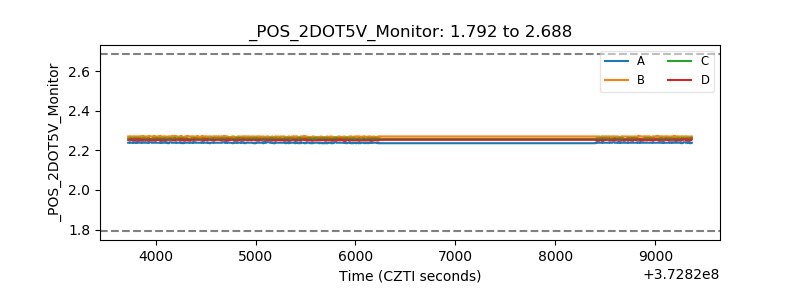 |
| +5 Volts monitor | 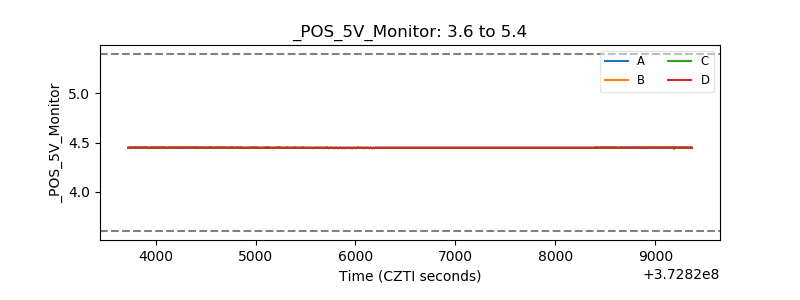 |
| _ROLL_ROT | 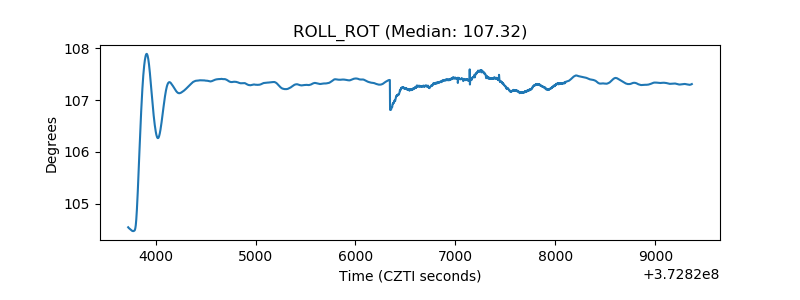 |
| _Roll_DEC | 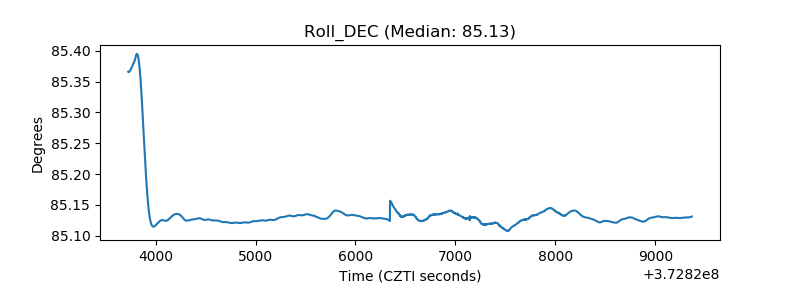 |
| _Roll_RA | 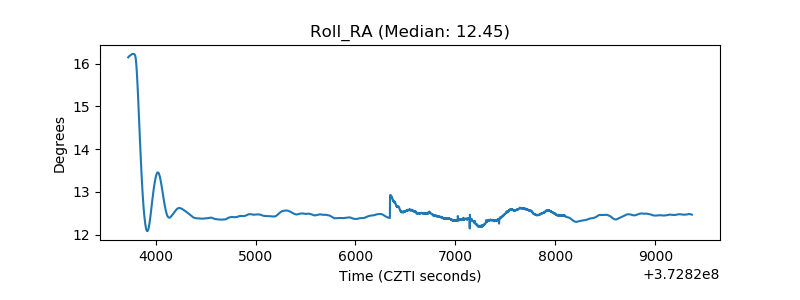 |
| Veto Counter | 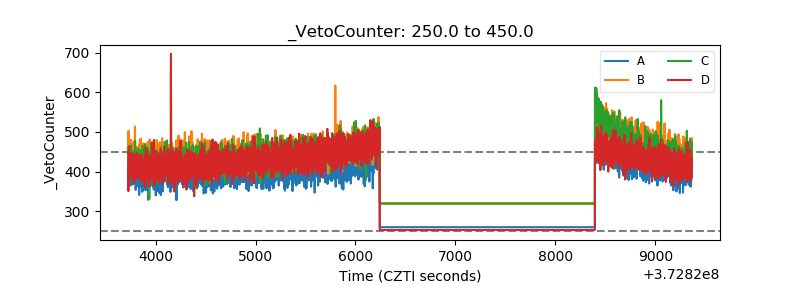 |