| Param | Original file | Final file |
|---|---|---|
| Filename | modeM0/AS1C06_010T05_9000004736_32846cztM0_level2.evt | modeM0/AS1C06_010T05_9000004736_32846cztM0_level2_quad_clean.evt |
| Size (bytes) | 515,315,520 | 97,211,520 |
| Size | 491.4 MB | 92.7 MB |
| Events in quadrant A | 2,288,049 | 674,348 |
| Events in quadrant B | 3,053,398 | 683,662 |
| Events in quadrant C | 3,902,139 | 649,943 |
| Events in quadrant D | 6,021,188 | 582,149 |
| Mode M9 | |||
|---|---|---|---|
| Quadrant | BADHDUFLAG | Total packets | Discarded packets |
| A | 0 | 24 | 0 |
| B | 0 | 24 | 0 |
| C | 0 | 24 | 0 |
| D | 0 | 25 | 0 |
| Mode M0 | |||
|---|---|---|---|
| Quadrant | BADHDUFLAG | Total packets | Discarded packets |
| A | 0 | 10122 | 3 |
| B | 0 | 12329 | 2 |
| C | 0 | 15078 | 2 |
| D | 0 | 21477 | 2 |
| Mode SS | |||
|---|---|---|---|
| Quadrant | BADHDUFLAG | Total packets | Discarded packets |
| A | 0 | 104 | 0 |
| B | 0 | 104 | 0 |
| C | 0 | 104 | 0 |
| D | 0 | 104 | 0 |
| Quadrant | Total seconds | Saturated seconds | Saturation percentage |
|---|---|---|---|
| A | 5038 | 3 | 0.059547% |
| B | 5038 | 195 | 3.870584% |
| C | 5038 | 200 | 3.969829% |
| D | 5038 | 902 | 17.903930% |
Noise dominated data is calculated using 1-second bins in cleaned event files. If a bin has >2000 counts, and if more than 50% of those come from <1% of pixels, then it is considered to be noise-dominated and hence unusable.
| Quadrant | # 1 sec bins | Bins with >0 counts | Bins with >2000 counts | High rate bins dominated by noise | Noise dominated (total time) | Noise dominated (detector-on time) | Marked lightcurve |
|---|---|---|---|---|---|---|---|
| A | 7130 | 5039 | 0 | 0 | 0.00% | 0.00% | 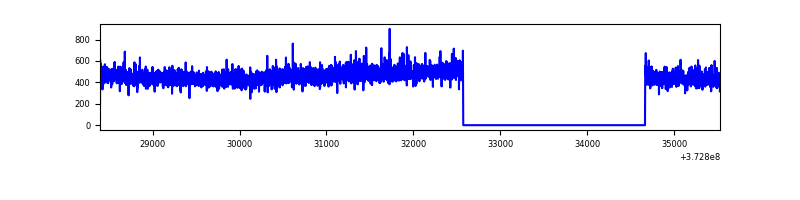 |
| B | 7130 | 5039 | 127 | 127 | 1.78% | 2.52% | 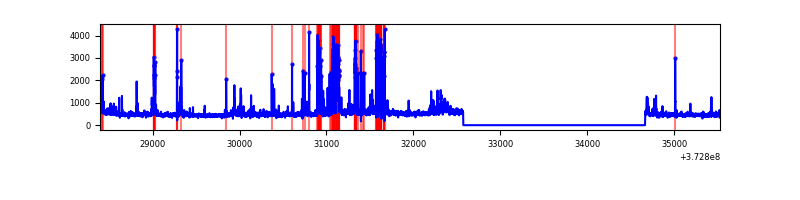 |
| C | 7130 | 5039 | 156 | 156 | 2.19% | 3.10% | 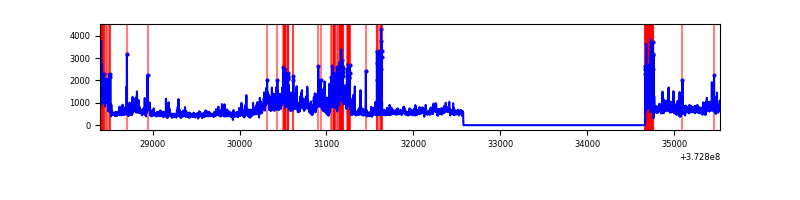 |
| D | 7130 | 5039 | 749 | 749 | 10.50% | 14.86% | 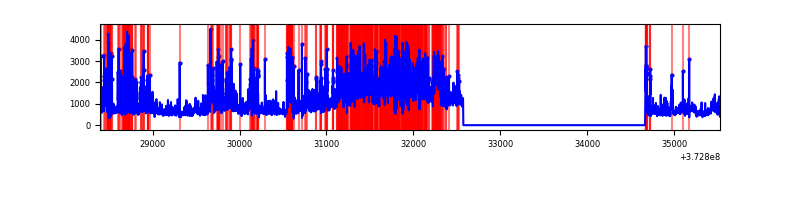 |
Top three noisy pixels from each quadrant. If the there are fewer than three noisy pixels in the level2.evt file, extra rows are filled as -1
| Pixel properties | Quadrant properties | ||||||
|---|---|---|---|---|---|---|---|
| Quadrant | DetID | PixID | Counts | Sigma | Mean | Median | Sigma |
| A | 9 | 143 | 10692 | 86.08 | 587 | 576 | 117.5 |
| A | 13 | 254 | 9712 | 77.74 | 587 | 576 | 117.5 |
| A | 0 | 226 | 5165 | 39.05 | 587 | 576 | 117.5 |
| B | 5 | 172 | 510103 | 4656.0 | 583 | 570 | 109.4 |
| B | 0 | 219 | 54358 | 491.5 | 583 | 570 | 109.4 |
| B | 0 | 197 | 50593 | 457.1 | 583 | 570 | 109.4 |
| C | 3 | 233 | 1277229 | 10183.27 | 551 | 556 | 125.4 |
| C | 9 | 160 | 225378 | 1793.27 | 551 | 556 | 125.4 |
| C | 0 | 10 | 202913 | 1614.08 | 551 | 556 | 125.4 |
| D | 8 | 195 | 1085850 | 8244.58 | 521 | 509 | 131.6 |
| D | 12 | 33 | 839240 | 6371.26 | 521 | 509 | 131.6 |
| D | 2 | 250 | 465344 | 3531.03 | 521 | 509 | 131.6 |
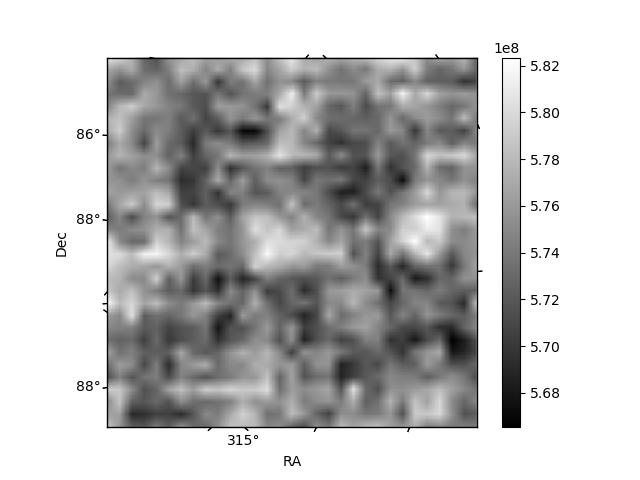
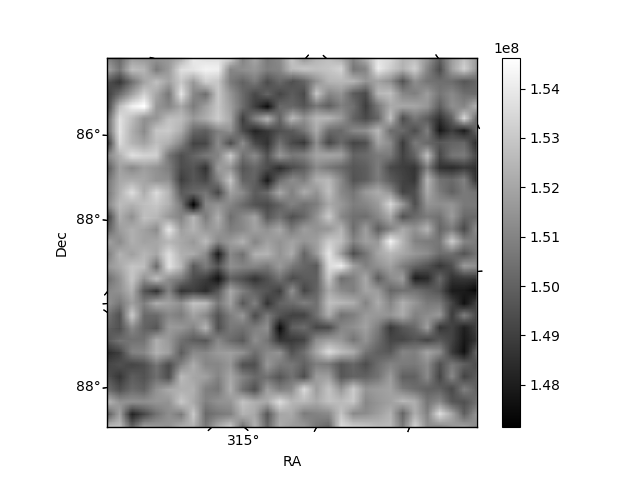
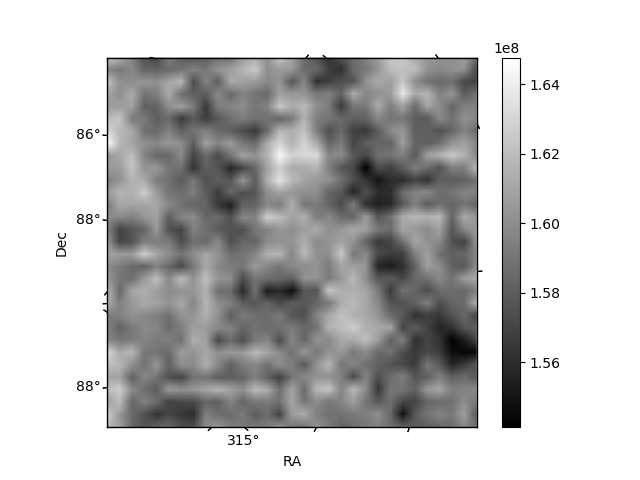
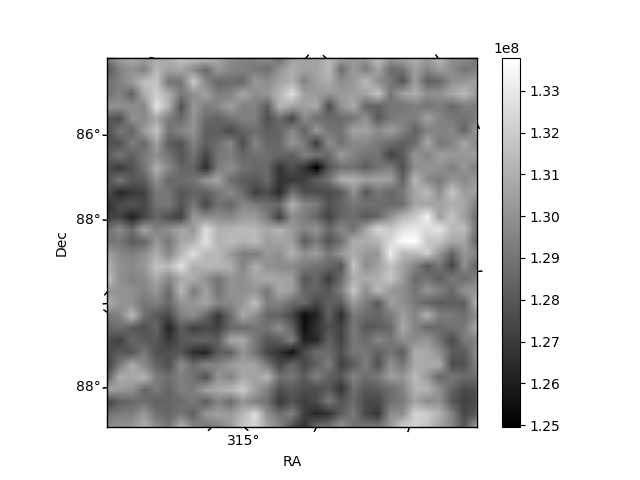
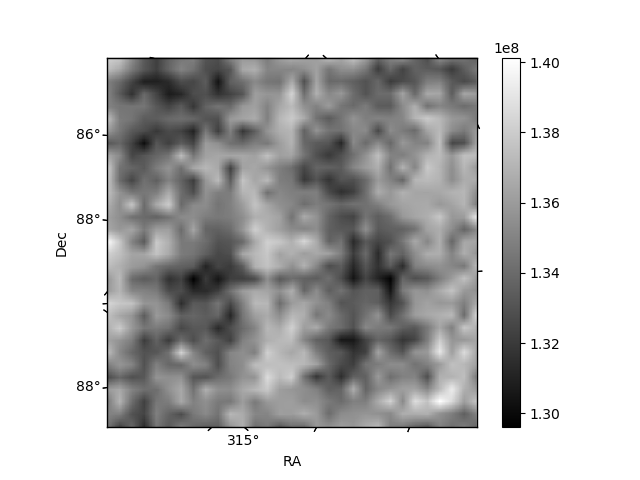
Histogram calculated using DETX and DETY for each event in the final _common_clean file
| Quadrant A | 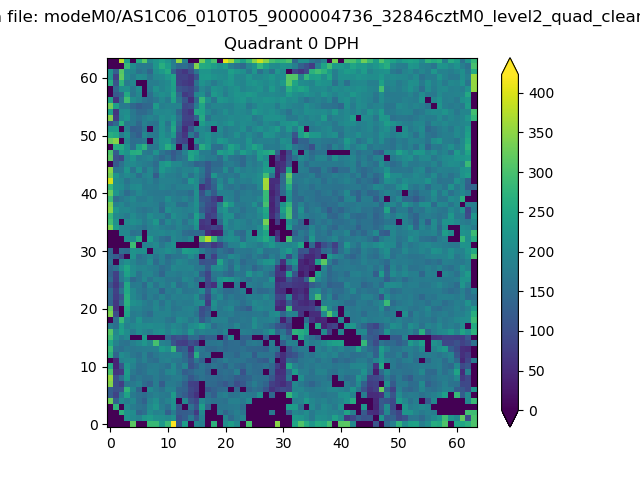 |
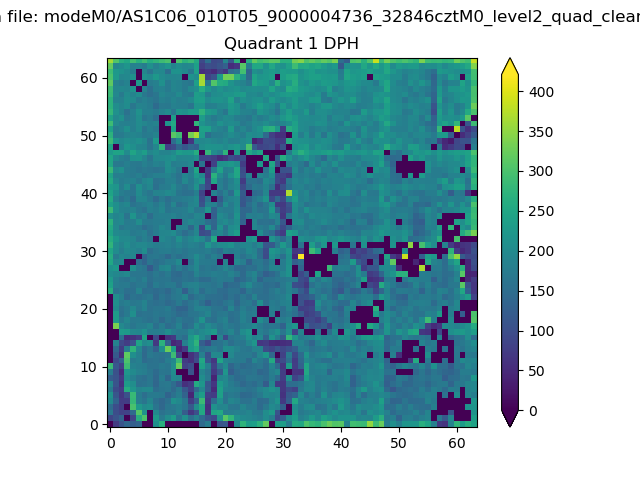 |
Quadrant B |
|---|---|---|---|
| Quadrant D | 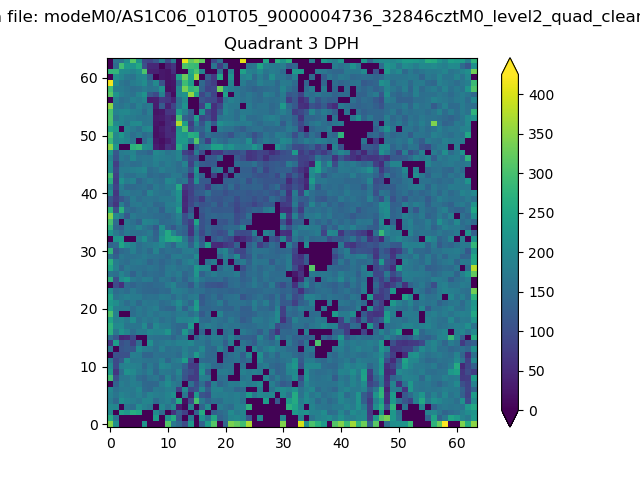 |
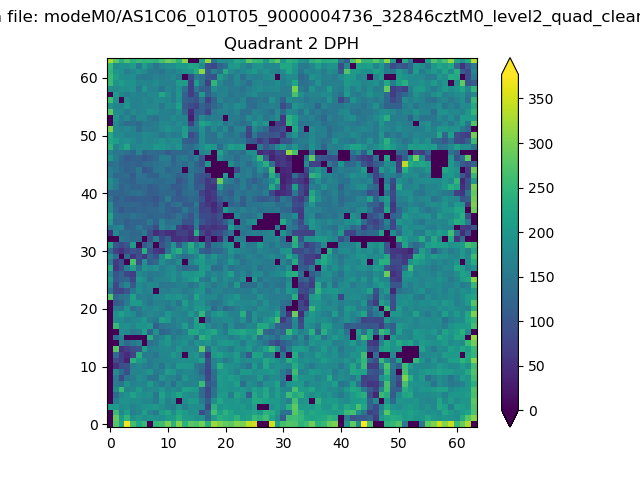 |
Quadrant C |
| Plot type | Count rate plots | Images |
|---|---|---|
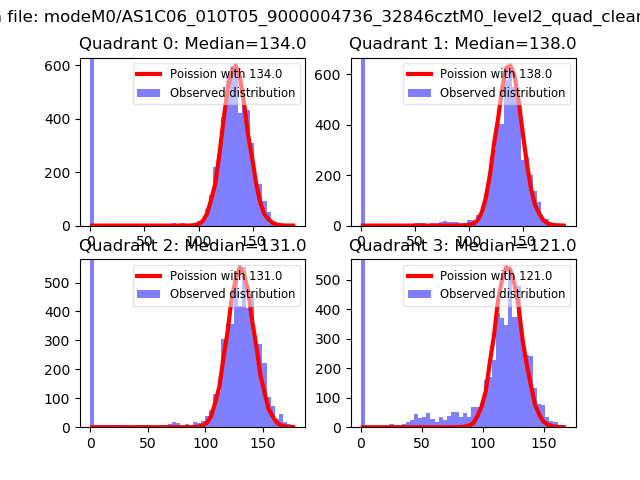
| Comparison with Poisson distribution Blue bars denote a histogram of data divided into 1 sec bins. Red curve is a Poisson curve with rate = median count rate of data. |
 |
 |
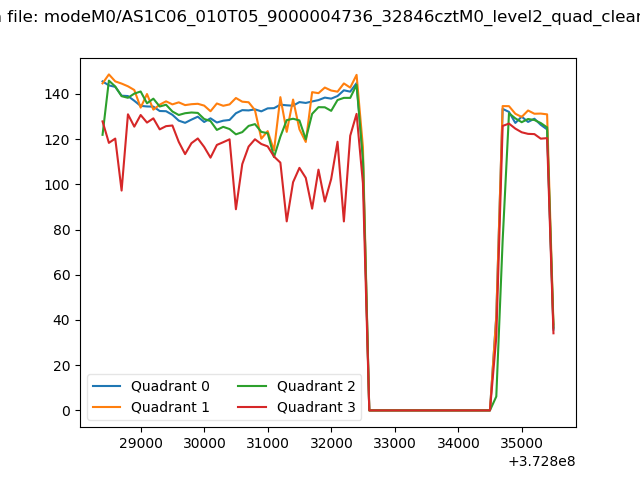
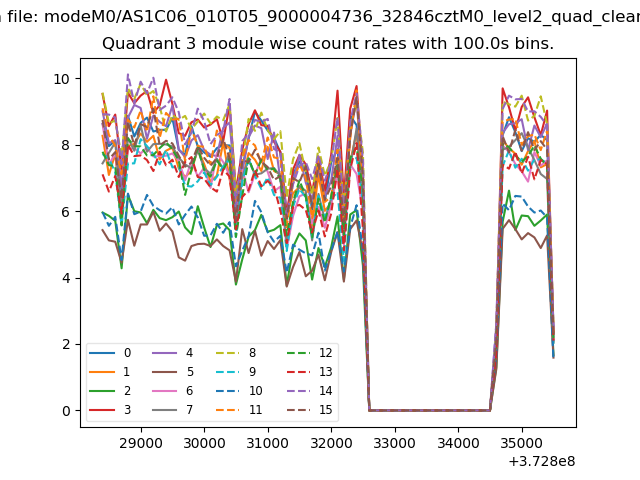
| Quadrant-wise count rates Data is divided into 100 sec bins |
 |
|
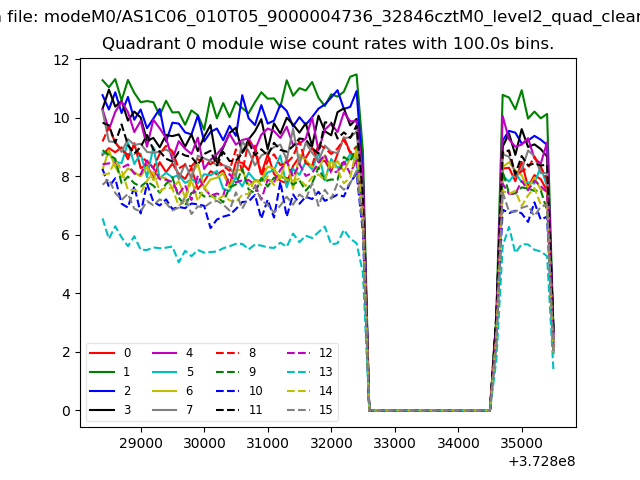
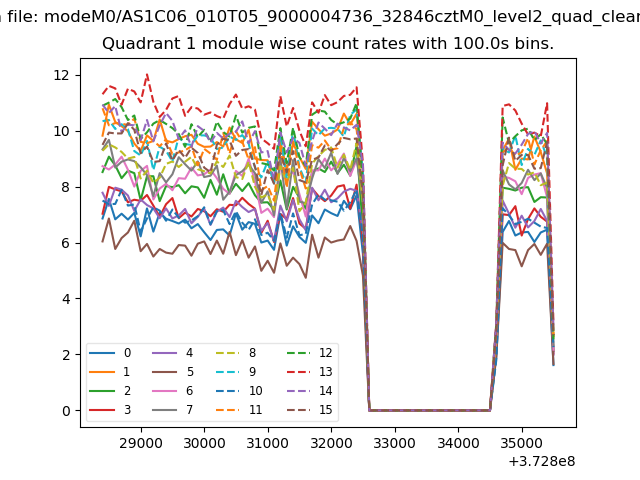
| Module-wise count rates for Quadrant A Data is divided into 100 sec bins |
 |
 |
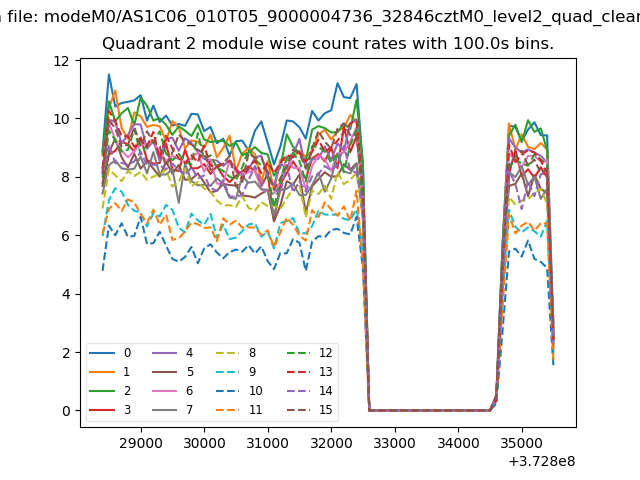
| Module-wise count rates for Quadrant B Data is divided into 100 sec bins |
 |
 |
| Module-wise count rates for Quadrant C Data is divided into 100 sec bins |
 |
 |
| Module-wise count rates for Quadrant D Data is divided into 100 sec bins |
 |
 |
| Parameter | Plot |
|---|---|
| CZT HV Monitor | 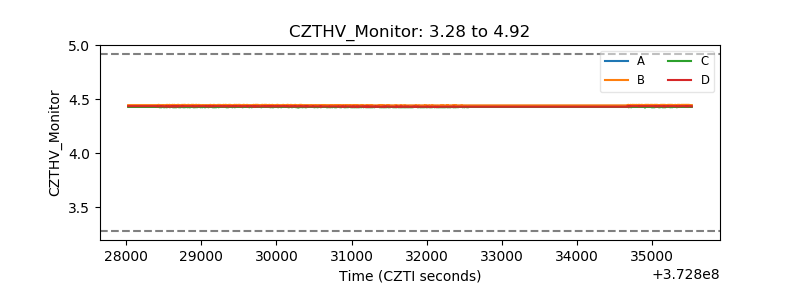 |
| D_VDD | 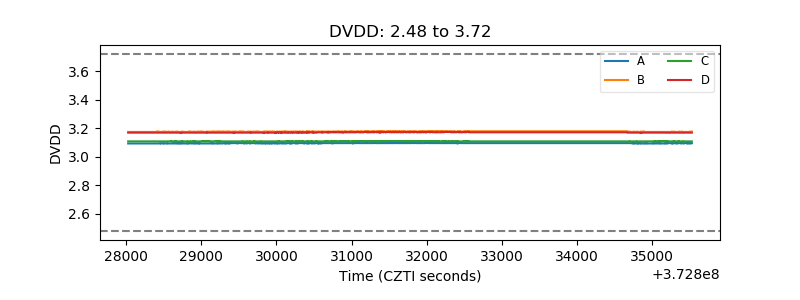 |
| Temperature 1 | 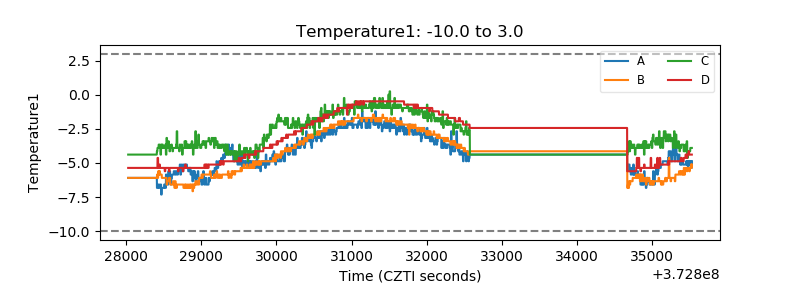 |
| Veto HV Monitor | 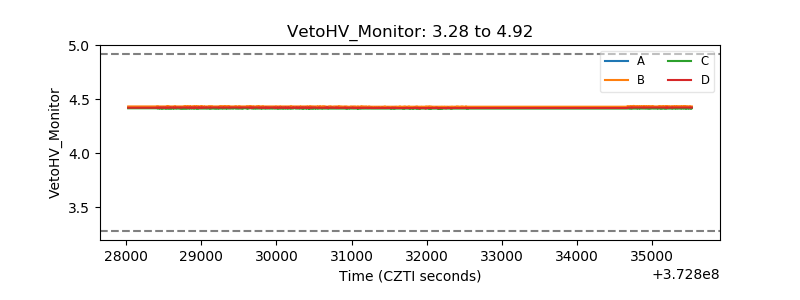 |
| Veto LLD | 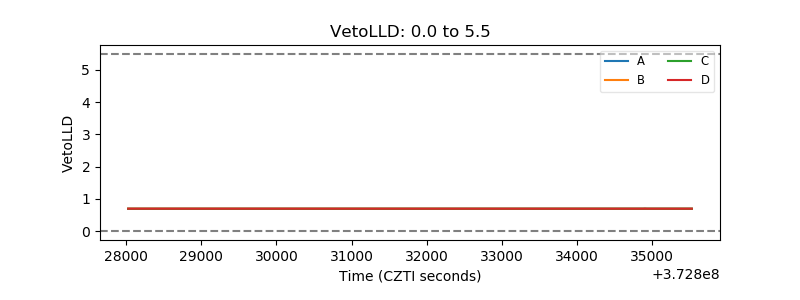 |
| Alpha Counter | 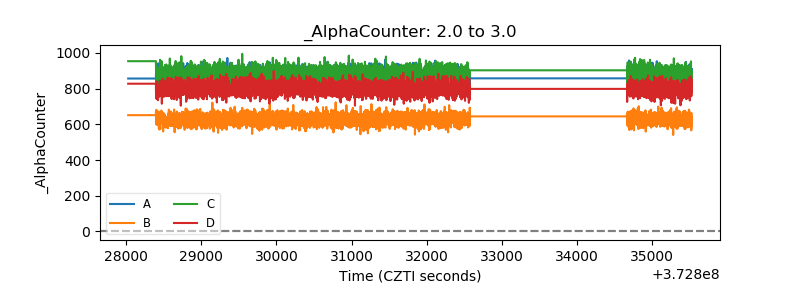 |
| _CPM_Rate | 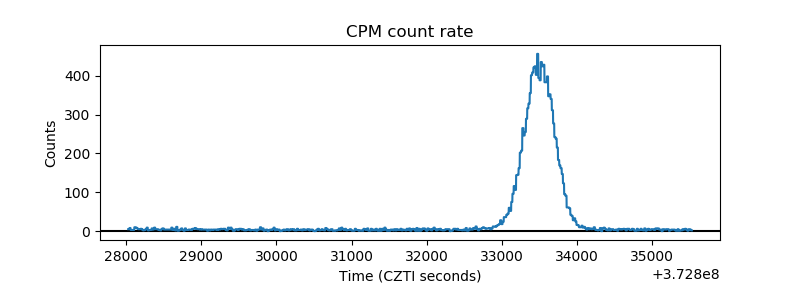 |
| CZT Counter | 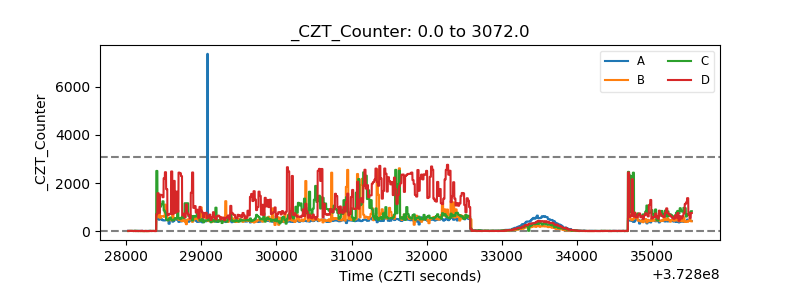 |
| +2.5 Volts monitor |  |
| +5 Volts monitor | 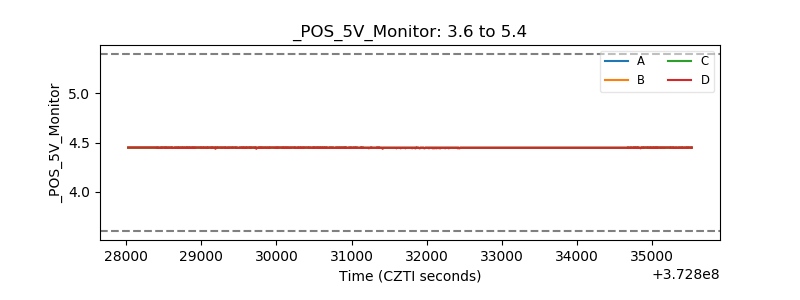 |
| _ROLL_ROT | 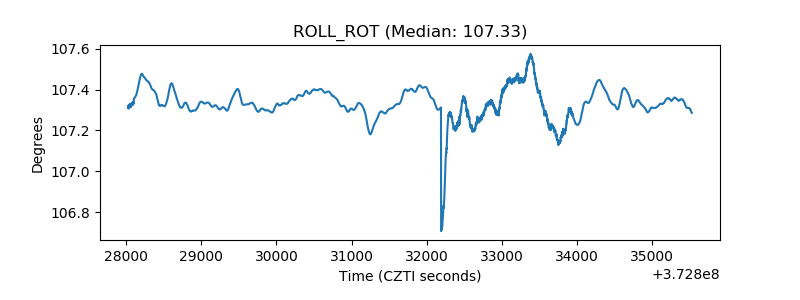 |
| _Roll_DEC | 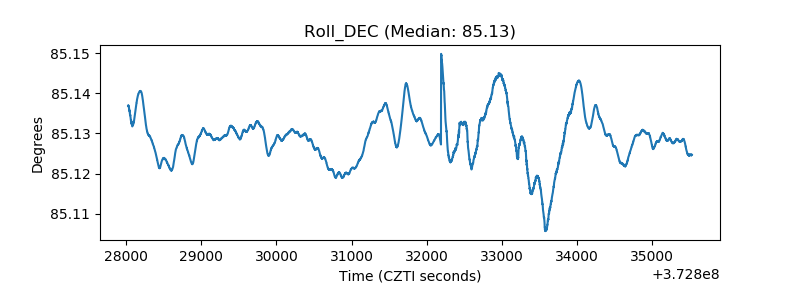 |
| _Roll_RA | 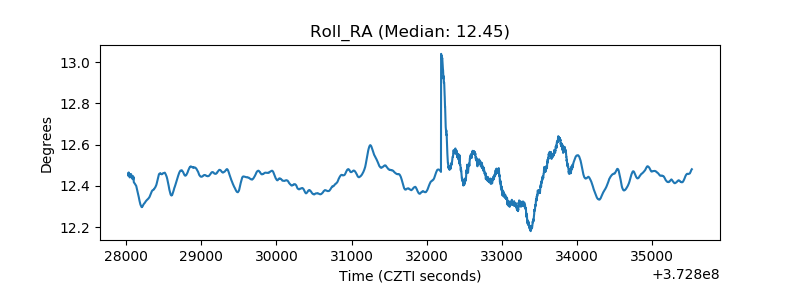 |
| Veto Counter | 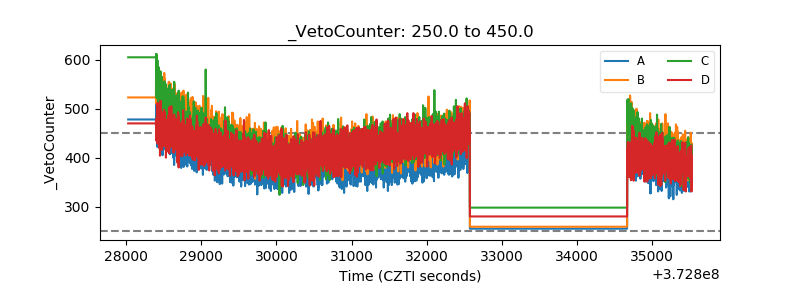 |