| Param | Original file | Final file |
|---|---|---|
| Filename | modeM0/AS1C06_010T05_9000004736_32848cztM0_level2.evt | modeM0/AS1C06_010T05_9000004736_32848cztM0_level2_quad_clean.evt |
| Size (bytes) | 608,843,520 | 101,203,200 |
| Size | 580.6 MB | 96.5 MB |
| Events in quadrant A | 2,568,026 | 703,030 |
| Events in quadrant B | 4,002,795 | 700,489 |
| Events in quadrant C | 2,905,402 | 699,769 |
| Events in quadrant D | 8,581,310 | 566,821 |
| Mode M9 | |||
|---|---|---|---|
| Quadrant | BADHDUFLAG | Total packets | Discarded packets |
| A | 0 | 22 | 0 |
| B | 0 | 22 | 0 |
| C | 0 | 22 | 0 |
| D | 0 | 23 | 0 |
| Mode M0 | |||
|---|---|---|---|
| Quadrant | BADHDUFLAG | Total packets | Discarded packets |
| A | 0 | 11469 | 3 |
| B | 0 | 15460 | 2 |
| C | 0 | 12234 | 2 |
| D | 0 | 29457 | 2 |
| Mode SS | |||
|---|---|---|---|
| Quadrant | BADHDUFLAG | Total packets | Discarded packets |
| A | 0 | 116 | 0 |
| B | 0 | 116 | 0 |
| C | 0 | 116 | 0 |
| D | 0 | 116 | 0 |
| Quadrant | Total seconds | Saturated seconds | Saturation percentage |
|---|---|---|---|
| A | 5629 | 26 | 0.461894% |
| B | 5629 | 444 | 7.887724% |
| C | 5629 | 61 | 1.083674% |
| D | 5629 | 1663 | 29.543436% |
Noise dominated data is calculated using 1-second bins in cleaned event files. If a bin has >2000 counts, and if more than 50% of those come from <1% of pixels, then it is considered to be noise-dominated and hence unusable.
| Quadrant | # 1 sec bins | Bins with >0 counts | Bins with >2000 counts | High rate bins dominated by noise | Noise dominated (total time) | Noise dominated (detector-on time) | Marked lightcurve |
|---|---|---|---|---|---|---|---|
| A | 7151 | 5630 | 21 | 21 | 0.29% | 0.37% | 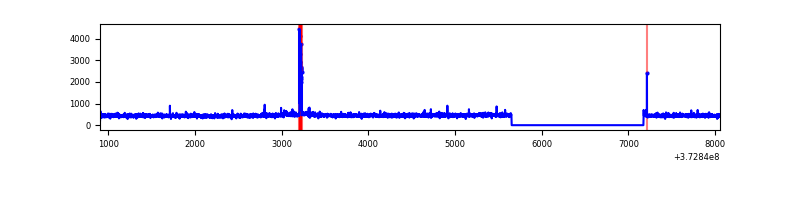 |
| B | 7151 | 5630 | 327 | 327 | 4.57% | 5.81% | 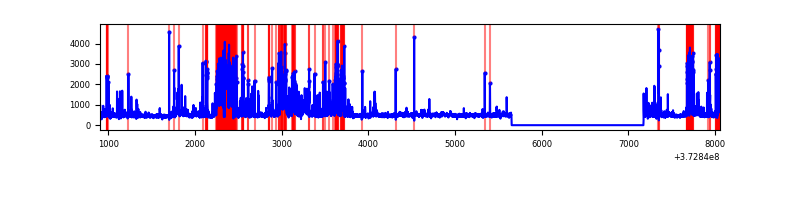 |
| C | 7151 | 5630 | 44 | 44 | 0.62% | 0.78% | 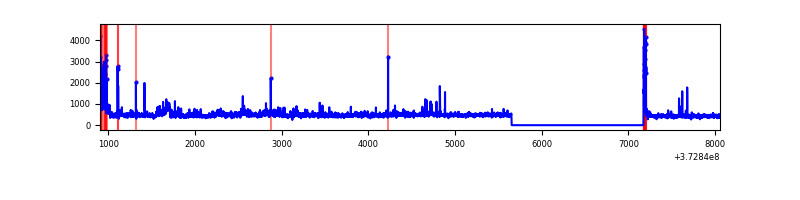 |
| D | 7151 | 5630 | 1554 | 1554 | 21.73% | 27.60% | 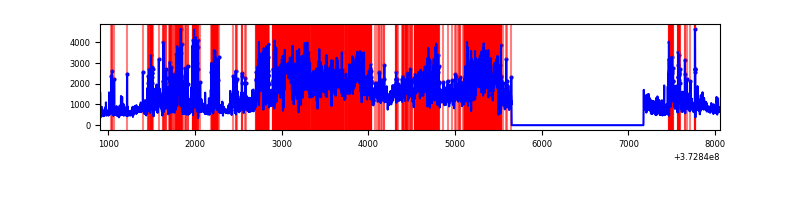 |
Top three noisy pixels from each quadrant. If the there are fewer than three noisy pixels in the level2.evt file, extra rows are filled as -1
| Pixel properties | Quadrant properties | ||||||
|---|---|---|---|---|---|---|---|
| Quadrant | DetID | PixID | Counts | Sigma | Mean | Median | Sigma |
| A | 9 | 143 | 69662 | 542.13 | 636 | 624 | 127.3 |
| A | 14 | 238 | 20787 | 158.33 | 636 | 624 | 127.3 |
| A | 13 | 254 | 11038 | 81.78 | 636 | 624 | 127.3 |
| B | 5 | 172 | 1112073 | 9389.14 | 622 | 607 | 118.4 |
| B | 0 | 197 | 158588 | 1334.55 | 622 | 607 | 118.4 |
| B | 8 | 128 | 133886 | 1125.88 | 622 | 607 | 118.4 |
| C | 3 | 233 | 239410 | 1681.86 | 617 | 622 | 142.0 |
| C | 0 | 10 | 173616 | 1218.45 | 617 | 622 | 142.0 |
| C | 1 | 241 | 25491 | 175.16 | 617 | 622 | 142.0 |
| D | 12 | 227 | 2411808 | 17089.81 | 544 | 533 | 141.1 |
| D | 7 | 80 | 1360296 | 9637.26 | 544 | 533 | 141.1 |
| D | 8 | 195 | 1034127 | 7325.55 | 544 | 533 | 141.1 |
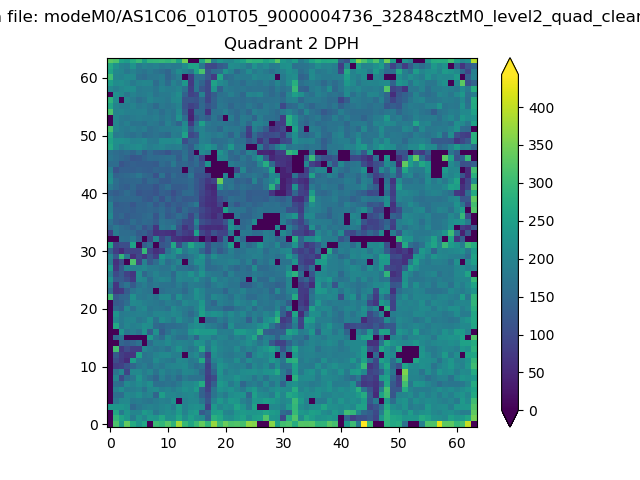
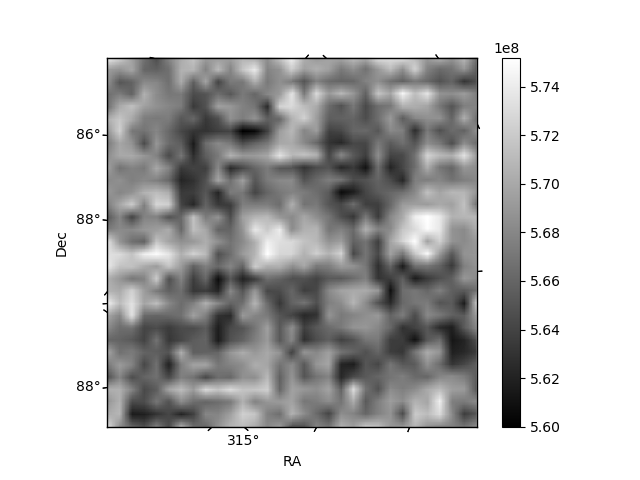
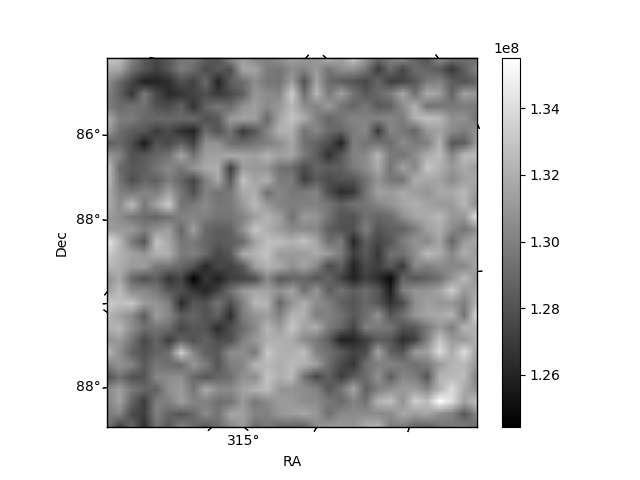
Histogram calculated using DETX and DETY for each event in the final _common_clean file
| Quadrant A | 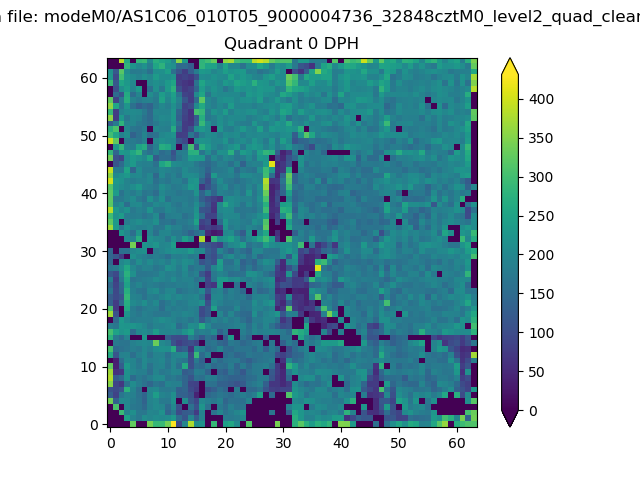 |
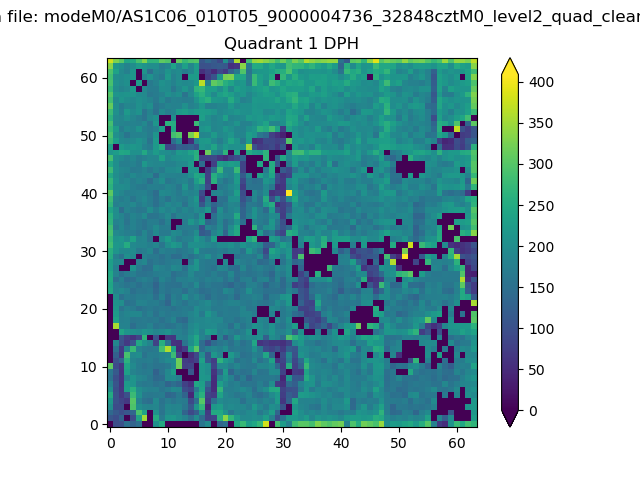 |
Quadrant B |
|---|---|---|---|
| Quadrant D | 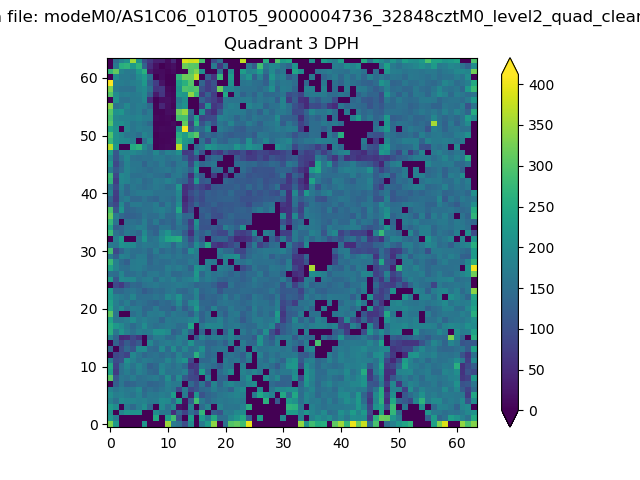 |
 |
Quadrant C |
| Plot type | Count rate plots | Images |
|---|---|---|
| Comparison with Poisson distribution Blue bars denote a histogram of data divided into 1 sec bins. Red curve is a Poisson curve with rate = median count rate of data. |
 |
 |
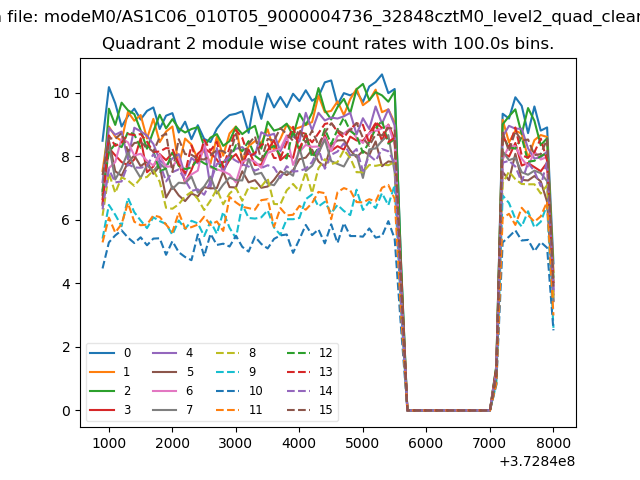
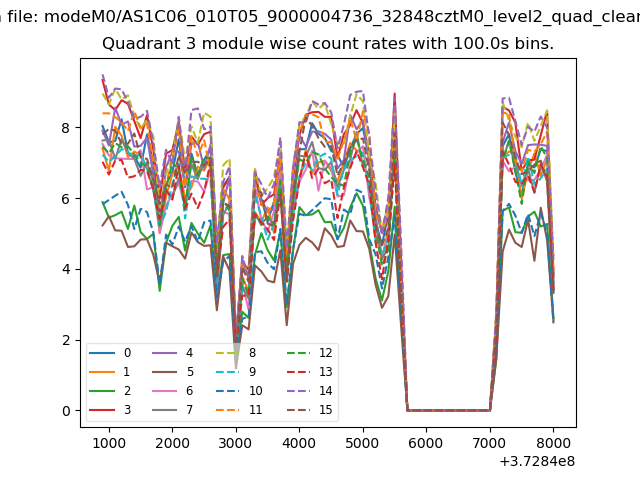
| Quadrant-wise count rates Data is divided into 100 sec bins |
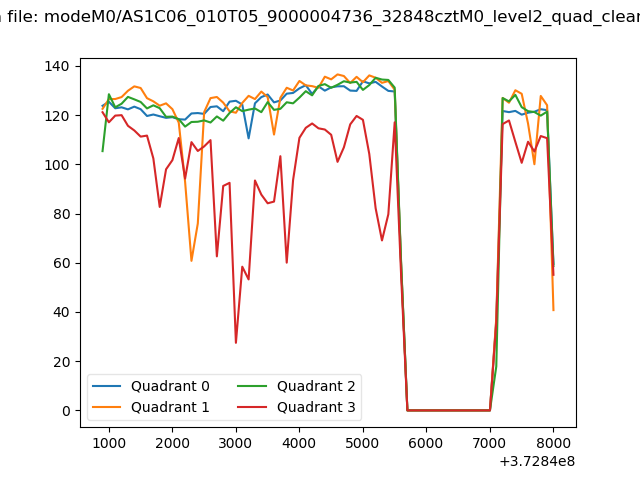 |
|
| Module-wise count rates for Quadrant A Data is divided into 100 sec bins |
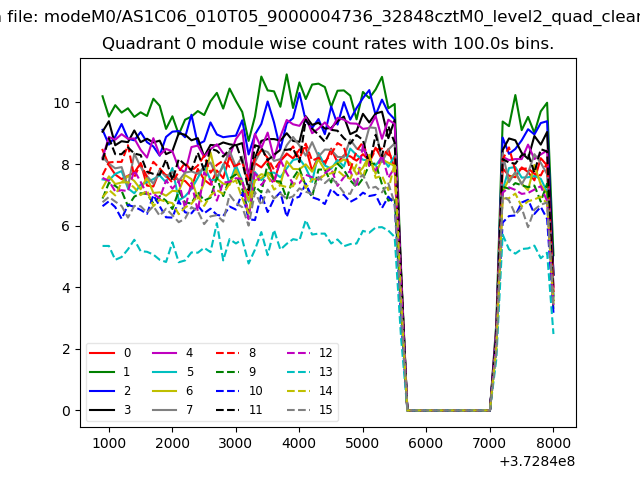 |
 |
| Module-wise count rates for Quadrant B Data is divided into 100 sec bins |
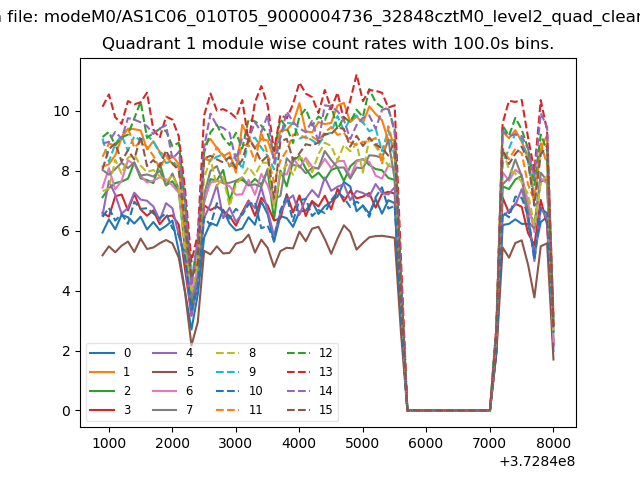 |
 |
| Module-wise count rates for Quadrant C Data is divided into 100 sec bins |
 |
 |
| Module-wise count rates for Quadrant D Data is divided into 100 sec bins |
 |
 |
| Parameter | Plot |
|---|---|
| CZT HV Monitor | 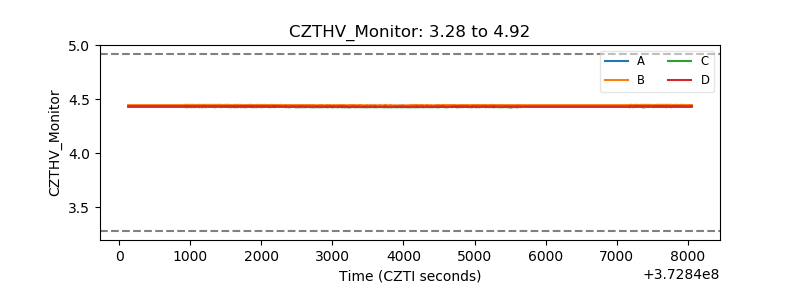 |
| D_VDD | 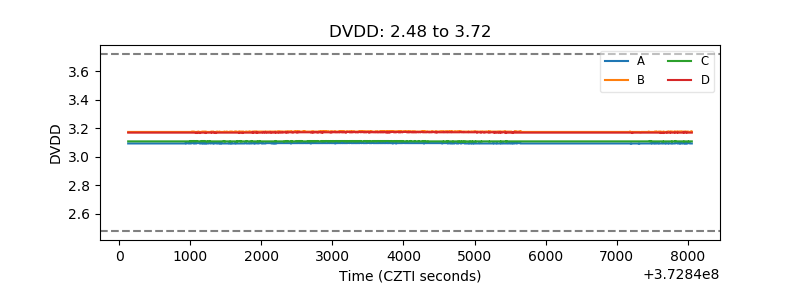 |
| Temperature 1 | 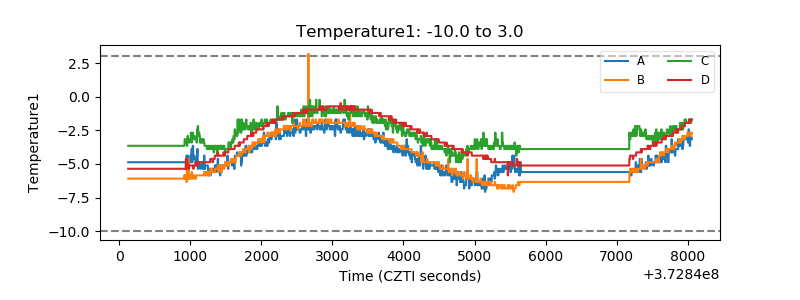 |
| Veto HV Monitor | 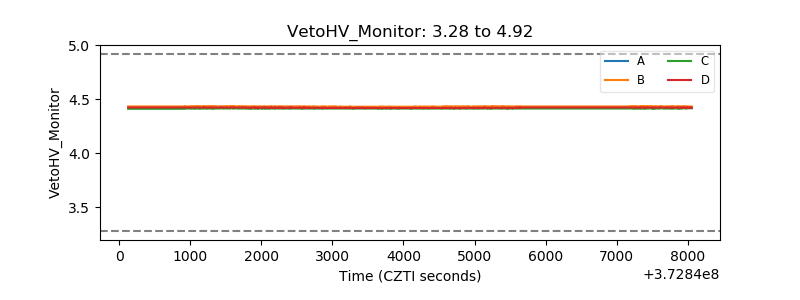 |
| Veto LLD | 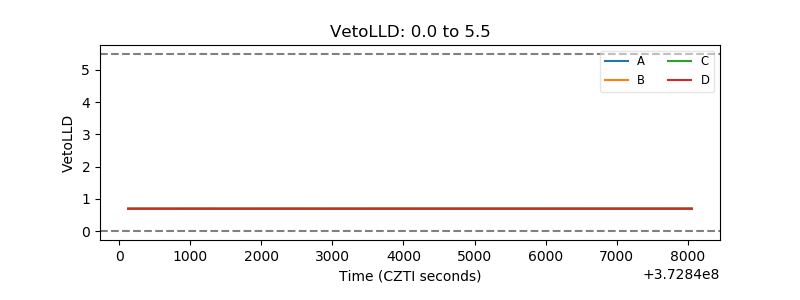 |
| Alpha Counter | 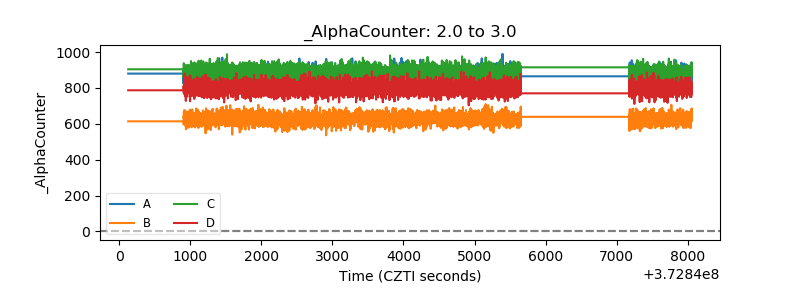 |
| _CPM_Rate | 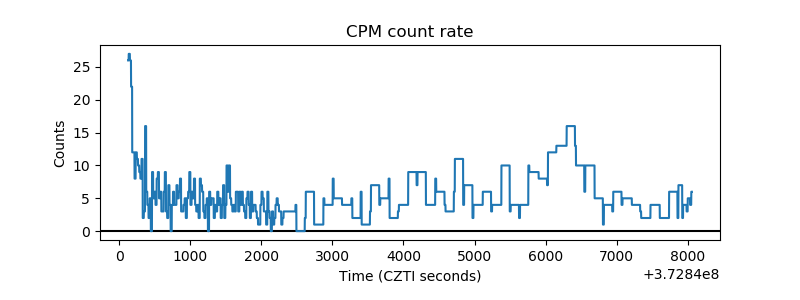 |
| CZT Counter | 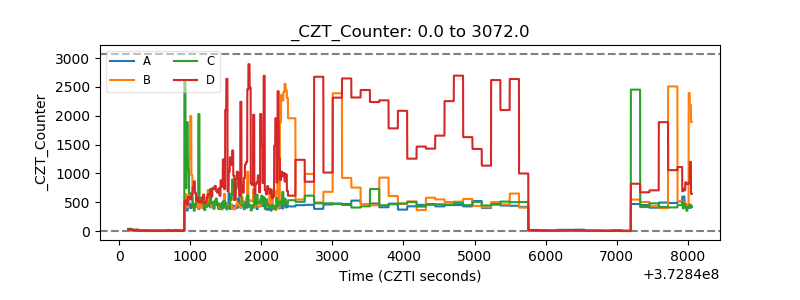 |
| +2.5 Volts monitor | 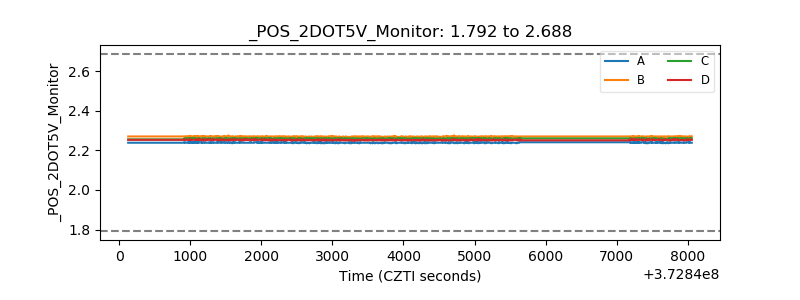 |
| +5 Volts monitor |  |
| _ROLL_ROT | 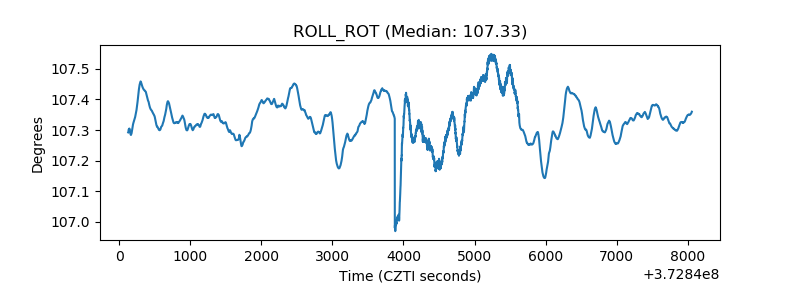 |
| _Roll_DEC | 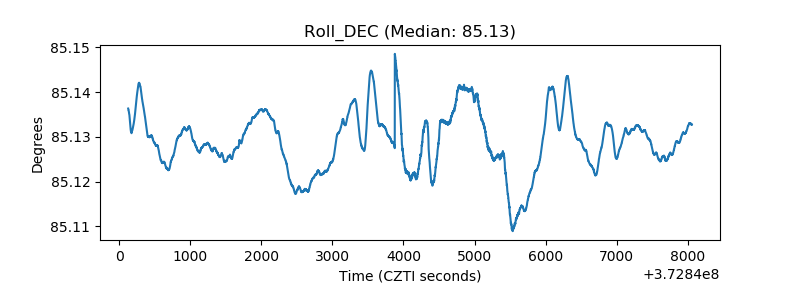 |
| _Roll_RA | 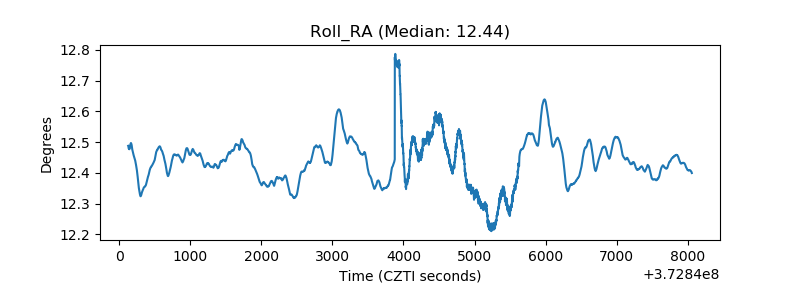 |
| Veto Counter | 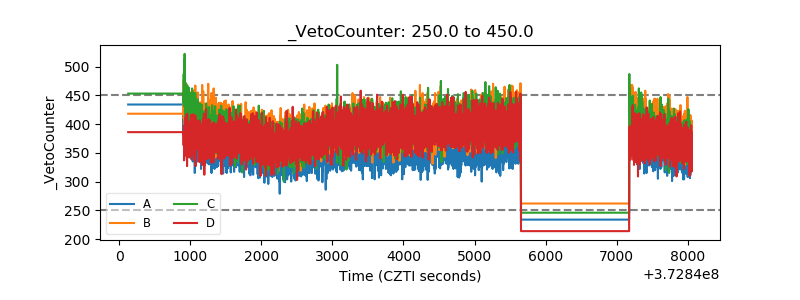 |