| Param | Original file | Final file |
|---|---|---|
| Filename | modeM0/AS1C06_010T05_9000004736_32849cztM0_level2.evt | modeM0/AS1C06_010T05_9000004736_32849cztM0_level2_quad_clean.evt |
| Size (bytes) | 319,230,720 | 52,600,320 |
| Size | 304.4 MB | 50.2 MB |
| Events in quadrant A | 1,335,060 | 364,003 |
| Events in quadrant B | 1,936,910 | 365,669 |
| Events in quadrant C | 1,481,722 | 357,874 |
| Events in quadrant D | 4,710,824 | 292,534 |
| Mode M9 | |||
|---|---|---|---|
| Quadrant | BADHDUFLAG | Total packets | Discarded packets |
| A | 0 | 2 | 0 |
| B | 0 | 2 | 0 |
| C | 0 | 2 | 0 |
| D | 0 | 3 | 0 |
| Mode M0 | |||
|---|---|---|---|
| Quadrant | BADHDUFLAG | Total packets | Discarded packets |
| A | 0 | 6030 | 1 |
| B | 0 | 7682 | 1 |
| C | 0 | 6443 | 1 |
| D | 0 | 16072 | 1 |
| Mode SS | |||
|---|---|---|---|
| Quadrant | BADHDUFLAG | Total packets | Discarded packets |
| A | 0 | 60 | 0 |
| B | 0 | 60 | 0 |
| C | 0 | 60 | 0 |
| D | 0 | 60 | 0 |
| Quadrant | Total seconds | Saturated seconds | Saturation percentage |
|---|---|---|---|
| A | 2975 | 4 | 0.134454% |
| B | 2975 | 183 | 6.151261% |
| C | 2975 | 36 | 1.210084% |
| D | 2975 | 978 | 32.873950% |
Noise dominated data is calculated using 1-second bins in cleaned event files. If a bin has >2000 counts, and if more than 50% of those come from <1% of pixels, then it is considered to be noise-dominated and hence unusable.
| Quadrant | # 1 sec bins | Bins with >0 counts | Bins with >2000 counts | High rate bins dominated by noise | Noise dominated (total time) | Noise dominated (detector-on time) | Marked lightcurve |
|---|---|---|---|---|---|---|---|
| A | 2975 | 2975 | 2 | 2 | 0.07% | 0.07% | 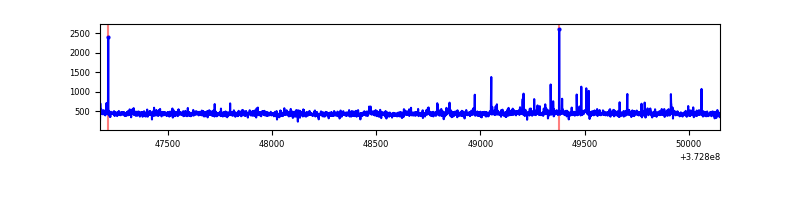 |
| B | 2975 | 2975 | 125 | 125 | 4.20% | 4.20% | 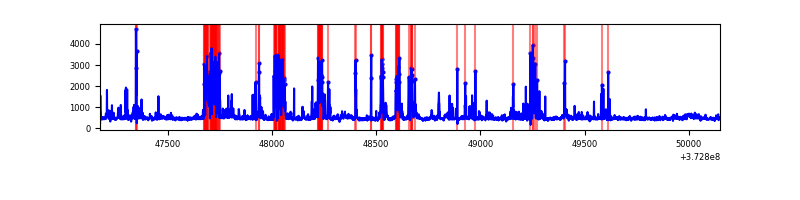 |
| C | 2975 | 2975 | 21 | 21 | 0.71% | 0.71% | 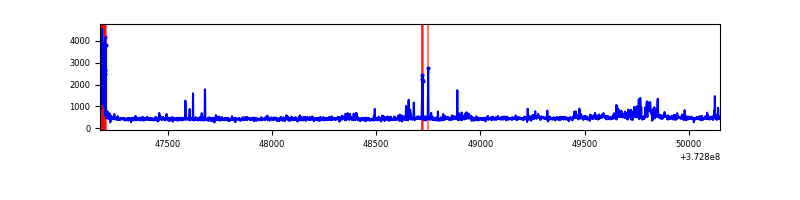 |
| D | 2975 | 2975 | 909 | 909 | 30.55% | 30.55% | 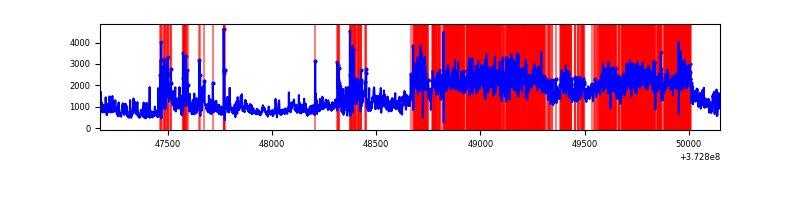 |
Top three noisy pixels from each quadrant. If the there are fewer than three noisy pixels in the level2.evt file, extra rows are filled as -1
| Pixel properties | Quadrant properties | ||||||
|---|---|---|---|---|---|---|---|
| Quadrant | DetID | PixID | Counts | Sigma | Mean | Median | Sigma |
| A | 9 | 143 | 15081 | 216.0 | 334 | 326 | 68.3 |
| A | 7 | 16 | 6342 | 88.07 | 334 | 326 | 68.3 |
| A | 13 | 254 | 5921 | 81.91 | 334 | 326 | 68.3 |
| B | 5 | 172 | 450806 | 7127.02 | 325 | 317 | 63.2 |
| B | 0 | 197 | 83430 | 1314.9 | 325 | 317 | 63.2 |
| B | 8 | 128 | 61256 | 964.09 | 325 | 317 | 63.2 |
| C | 3 | 233 | 121970 | 1635.77 | 318 | 320 | 74.4 |
| C | 0 | 10 | 91481 | 1225.8 | 318 | 320 | 74.4 |
| C | 14 | 67 | 10707 | 139.67 | 318 | 320 | 74.4 |
| D | 12 | 227 | 1474434 | 19563.48 | 290 | 284 | 75.4 |
| D | 8 | 195 | 1161419 | 15409.45 | 290 | 284 | 75.4 |
| D | 10 | 203 | 284915 | 3777.35 | 290 | 284 | 75.4 |
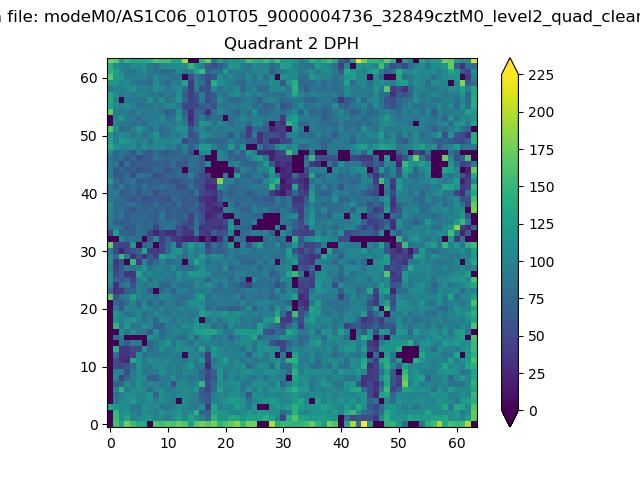
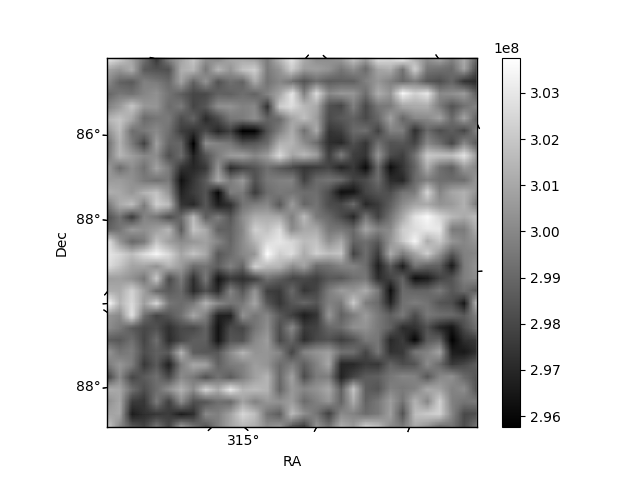
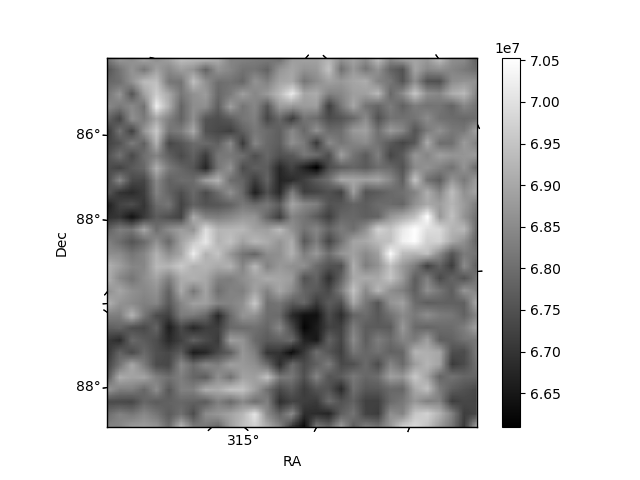
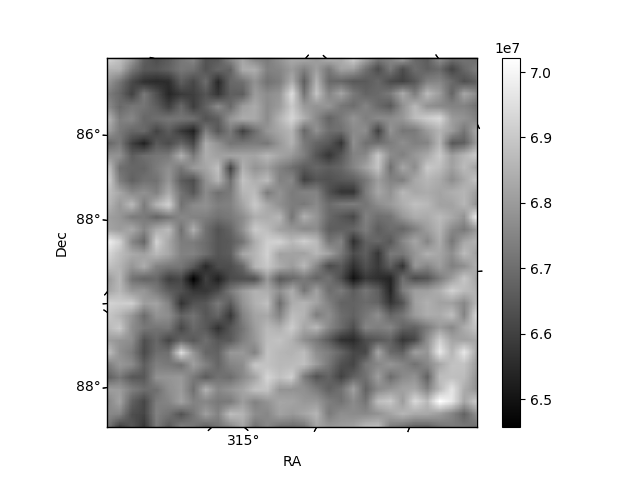
Histogram calculated using DETX and DETY for each event in the final _common_clean file
| Quadrant A | 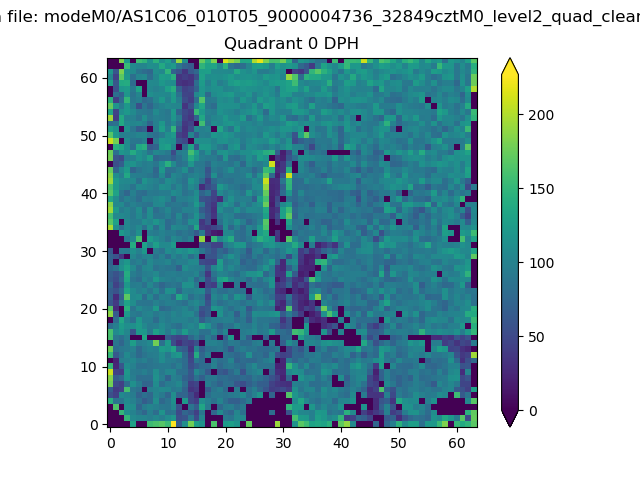 |
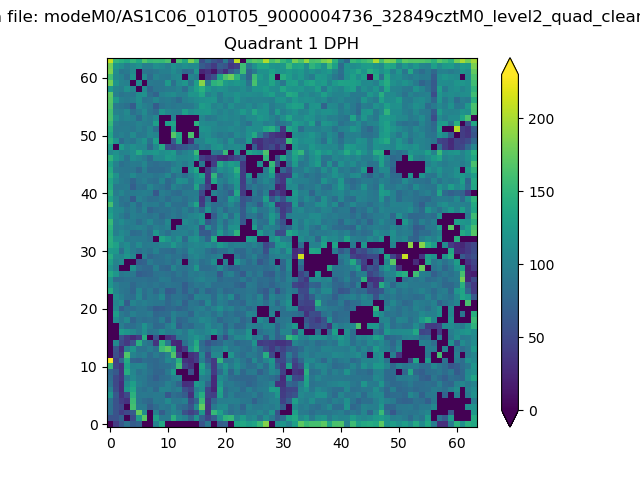 |
Quadrant B |
|---|---|---|---|
| Quadrant D | 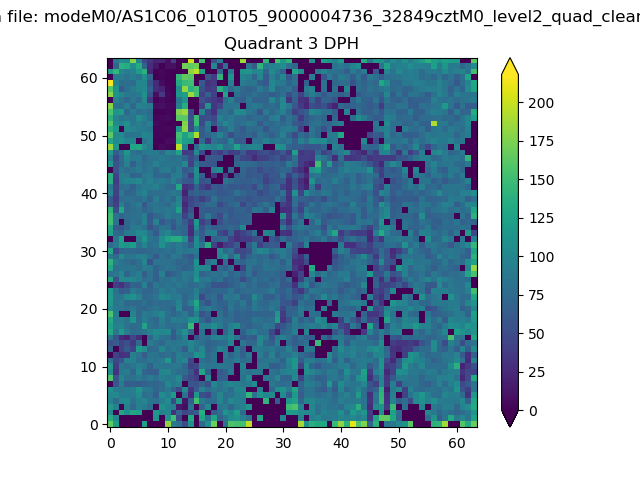 |
 |
Quadrant C |
| Plot type | Count rate plots | Images |
|---|---|---|
| Comparison with Poisson distribution Blue bars denote a histogram of data divided into 1 sec bins. Red curve is a Poisson curve with rate = median count rate of data. |
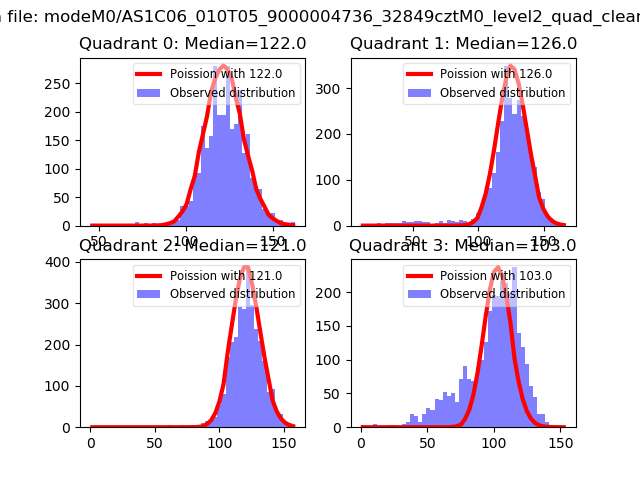 |
 |
| Quadrant-wise count rates Data is divided into 100 sec bins |
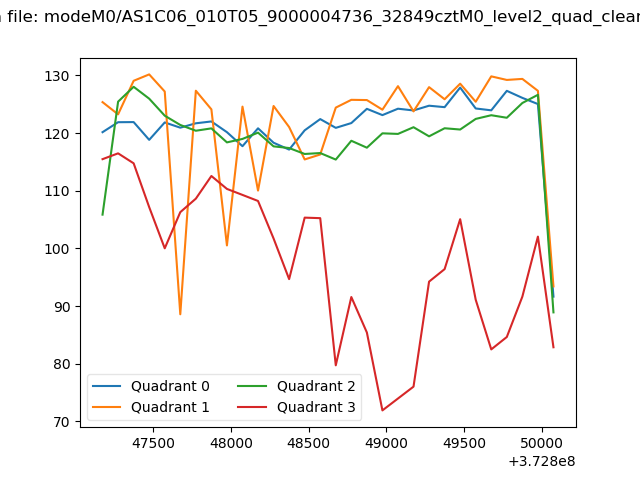 |
|
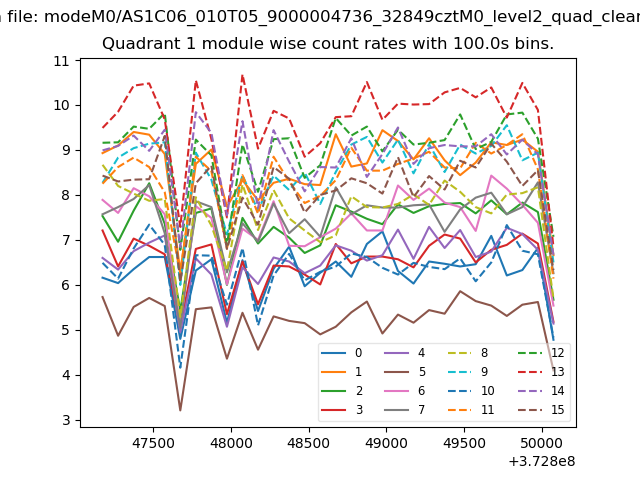
| Module-wise count rates for Quadrant A Data is divided into 100 sec bins |
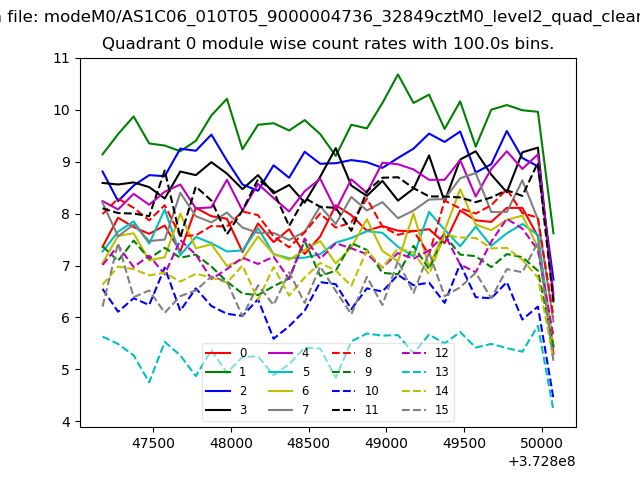 |
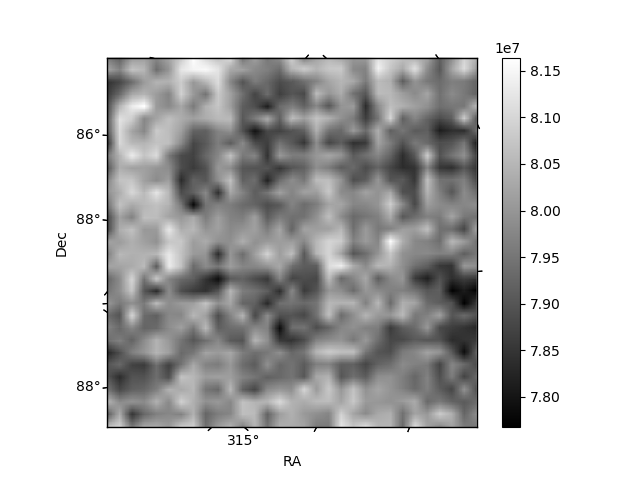 |
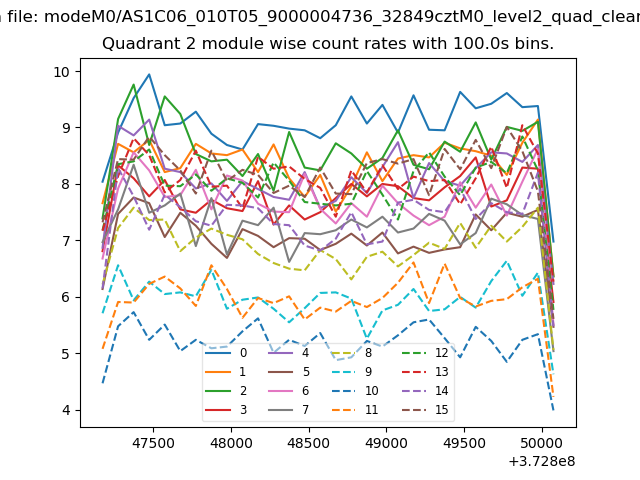
| Module-wise count rates for Quadrant B Data is divided into 100 sec bins |
 |
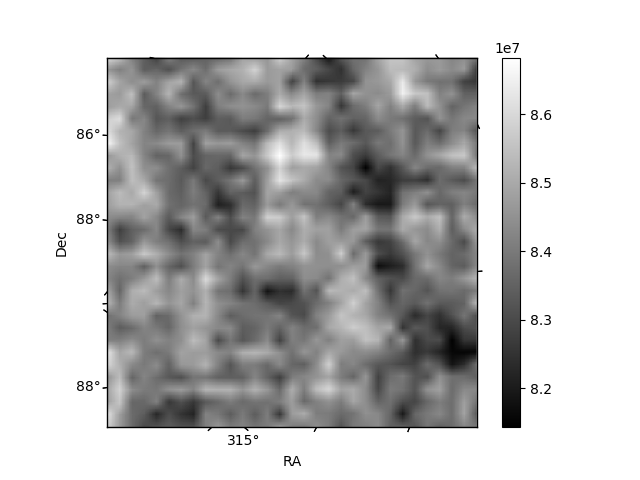 |
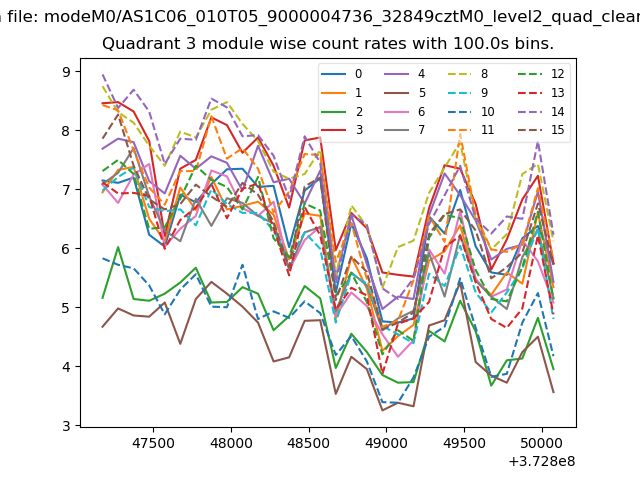
| Module-wise count rates for Quadrant C Data is divided into 100 sec bins |
 |
 |
| Module-wise count rates for Quadrant D Data is divided into 100 sec bins |
 |
 |
| Parameter | Plot |
|---|---|
| CZT HV Monitor | 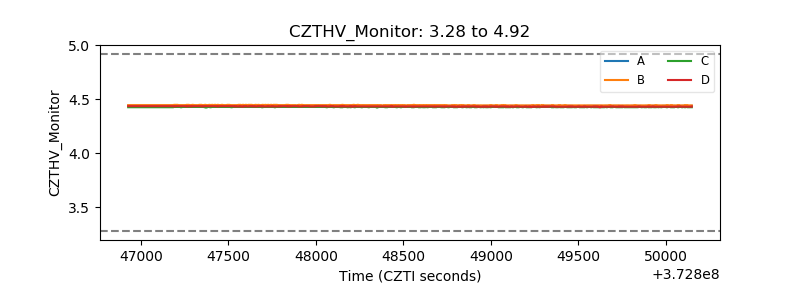 |
| D_VDD | 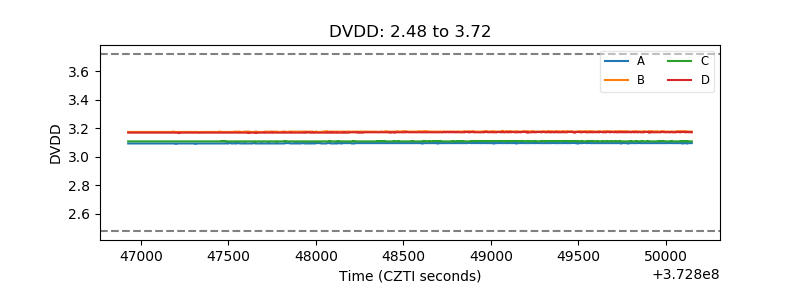 |
| Temperature 1 | 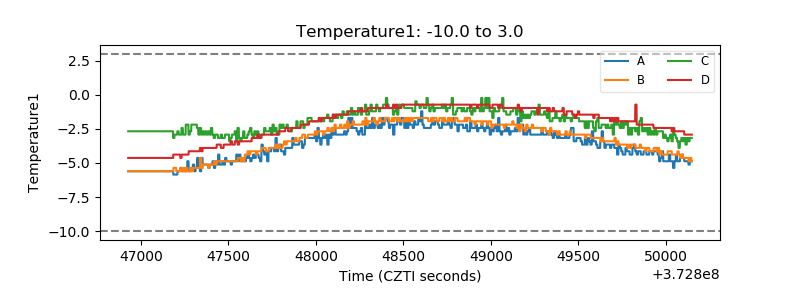 |
| Veto HV Monitor | 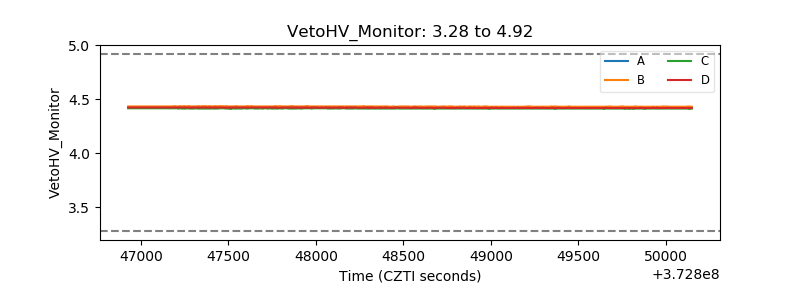 |
| Veto LLD | 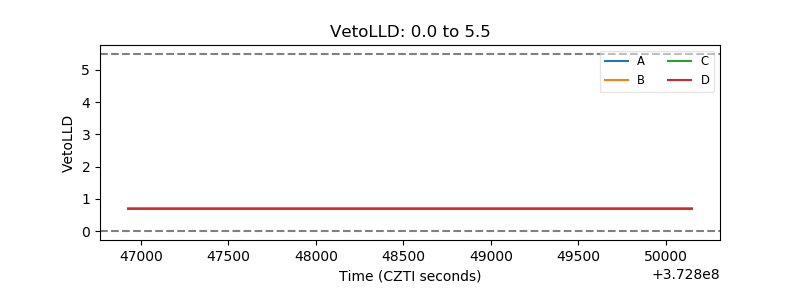 |
| Alpha Counter | 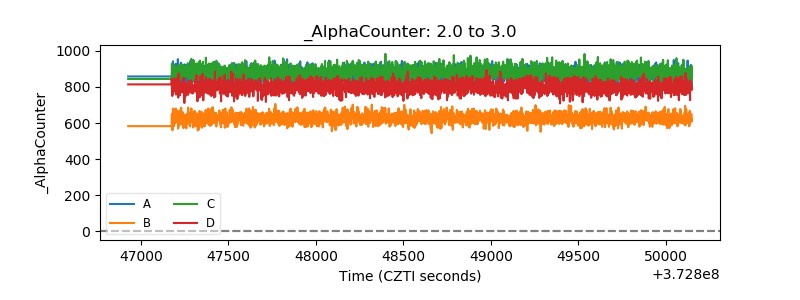 |
| _CPM_Rate | 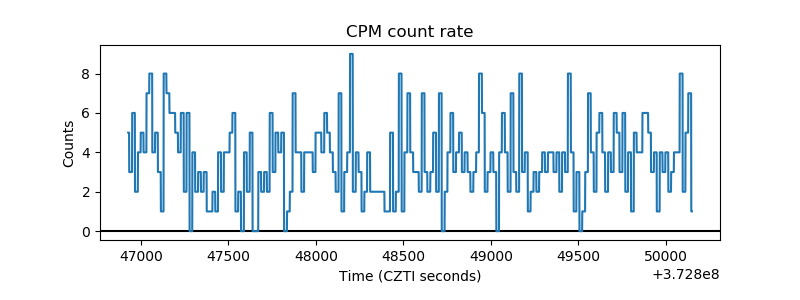 |
| CZT Counter | 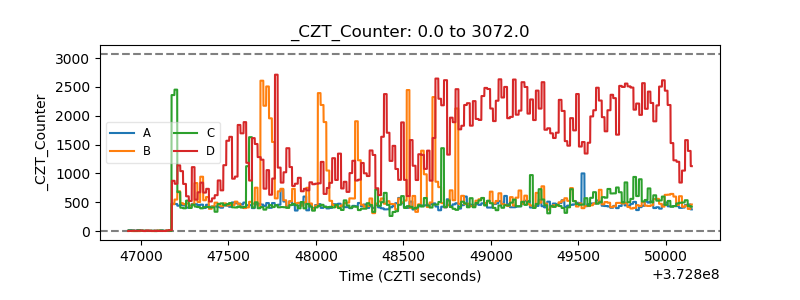 |
| +2.5 Volts monitor |  |
| +5 Volts monitor |  |
| _ROLL_ROT | 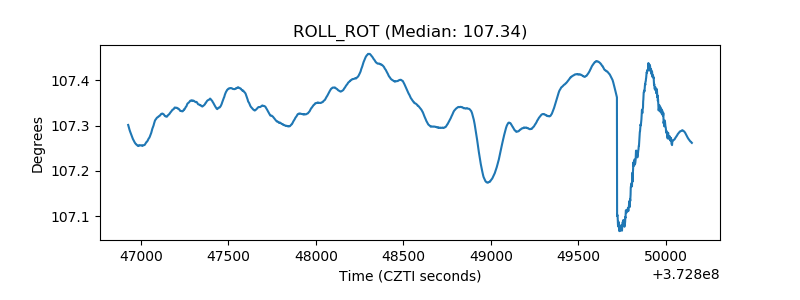 |
| _Roll_DEC | 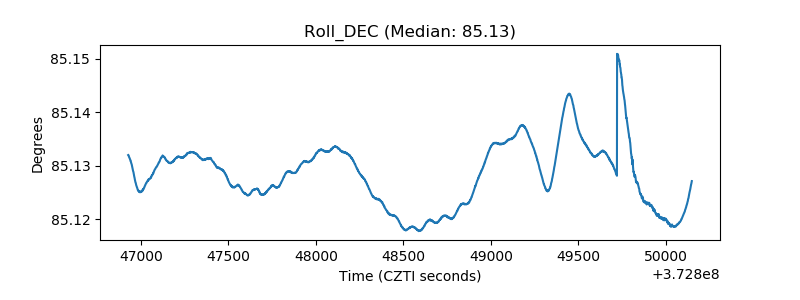 |
| _Roll_RA | 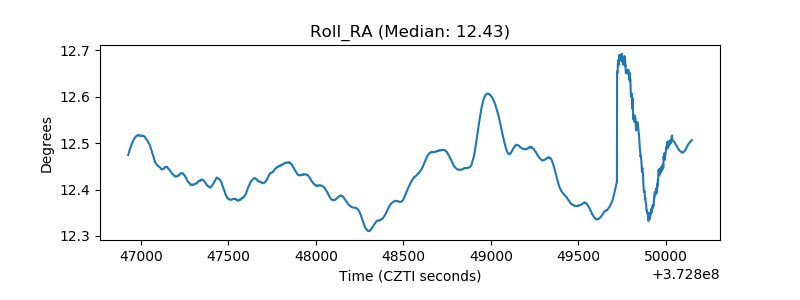 |
| Veto Counter | 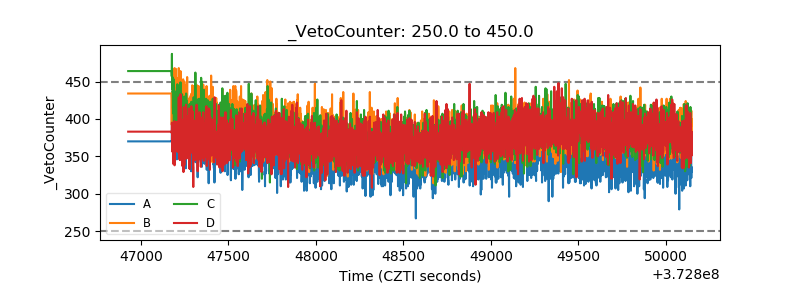 |