| Param | Original file | Final file |
|---|---|---|
| Filename | modeM0/AS1A11_005T05_9000004744_32882cztM0_level2.evt | modeM0/AS1A11_005T05_9000004744_32882cztM0_level2_quad_clean.evt |
| Size (bytes) | 1,498,723,200 | 239,973,120 |
| Size | 1.4 GB | 228.9 MB |
| Events in quadrant A | 7,395,438 | 1,611,300 |
| Events in quadrant B | 11,813,886 | 1,513,267 |
| Events in quadrant C | 7,960,404 | 1,614,147 |
| Events in quadrant D | 17,135,548 | 1,419,164 |
| Mode SS | |||
|---|---|---|---|
| Quadrant | BADHDUFLAG | Total packets | Discarded packets |
| A | 0 | 328 | 0 |
| B | 0 | 328 | 0 |
| C | 0 | 328 | 0 |
| D | 0 | 328 | 0 |
| Mode M9 | |||
|---|---|---|---|
| Quadrant | BADHDUFLAG | Total packets | Discarded packets |
| A | 0 | 55 | 0 |
| B | 0 | 55 | 0 |
| C | 0 | 55 | 0 |
| D | 0 | 55 | 0 |
| Mode M0 | |||
|---|---|---|---|
| Quadrant | BADHDUFLAG | Total packets | Discarded packets |
| A | 0 | 32565 | 5 |
| B | 0 | 45488 | 4 |
| C | 0 | 34034 | 4 |
| D | 0 | 62044 | 4 |
| Quadrant | Total seconds | Saturated seconds | Saturation percentage |
|---|---|---|---|
| A | 16088 | 21 | 0.130532% |
| B | 16088 | 1746 | 10.852810% |
| C | 16088 | 133 | 0.826703% |
| D | 16088 | 2036 | 12.655395% |
Noise dominated data is calculated using 1-second bins in cleaned event files. If a bin has >2000 counts, and if more than 50% of those come from <1% of pixels, then it is considered to be noise-dominated and hence unusable.
| Quadrant | # 1 sec bins | Bins with >0 counts | Bins with >2000 counts | High rate bins dominated by noise | Noise dominated (total time) | Noise dominated (detector-on time) | Marked lightcurve |
|---|---|---|---|---|---|---|---|
| A | 21554 | 16092 | 5 | 5 | 0.02% | 0.03% | 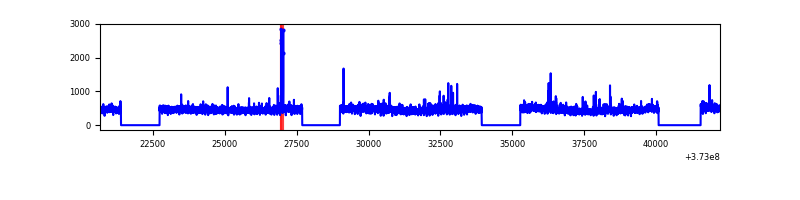 |
| B | 21553 | 16091 | 1318 | 1318 | 6.12% | 8.19% | 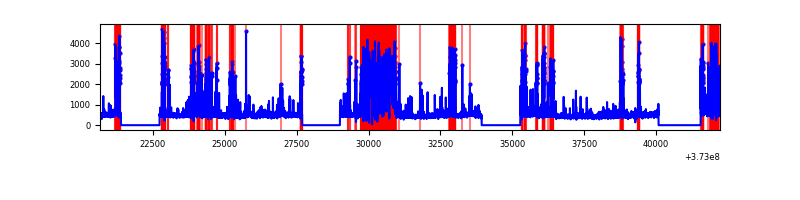 |
| C | 21554 | 16092 | 101 | 101 | 0.47% | 0.63% |  |
| D | 21554 | 16092 | 1866 | 1866 | 8.66% | 11.60% | 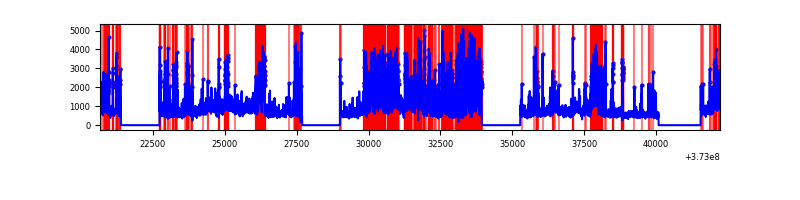 |
Top three noisy pixels from each quadrant. If the there are fewer than three noisy pixels in the level2.evt file, extra rows are filled as -1
| Pixel properties | Quadrant properties | ||||||
|---|---|---|---|---|---|---|---|
| Quadrant | DetID | PixID | Counts | Sigma | Mean | Median | Sigma |
| A | 14 | 239 | 97300 | 255.44 | 1866 | 1829 | 373.8 |
| A | 9 | 143 | 39669 | 101.24 | 1866 | 1829 | 373.8 |
| A | 14 | 63 | 31183 | 78.54 | 1866 | 1829 | 373.8 |
| B | 5 | 172 | 4411076 | 13066.18 | 1761 | 1716 | 337.5 |
| B | 0 | 197 | 184817 | 542.58 | 1761 | 1716 | 337.5 |
| B | 0 | 199 | 61608 | 177.48 | 1761 | 1716 | 337.5 |
| C | 0 | 10 | 305353 | 725.02 | 1823 | 1842 | 418.6 |
| C | 9 | 54 | 146618 | 345.84 | 1823 | 1842 | 418.6 |
| C | 3 | 233 | 119481 | 281.01 | 1823 | 1842 | 418.6 |
| D | 14 | 52 | 2802711 | 6523.46 | 1713 | 1679 | 429.4 |
| D | 7 | 80 | 1607117 | 3738.98 | 1713 | 1679 | 429.4 |
| D | 8 | 195 | 1396963 | 3249.55 | 1713 | 1679 | 429.4 |
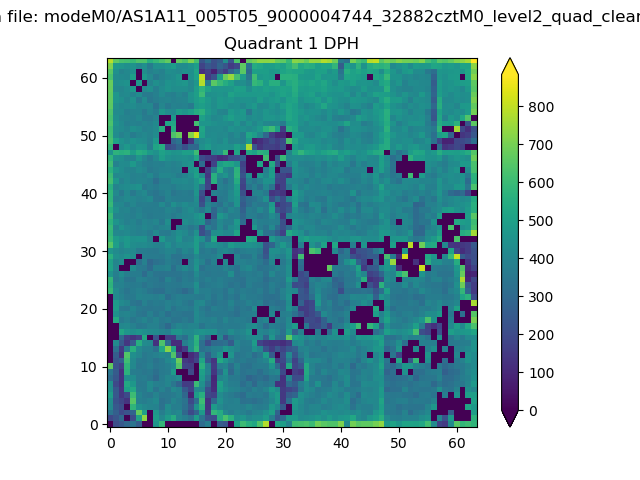
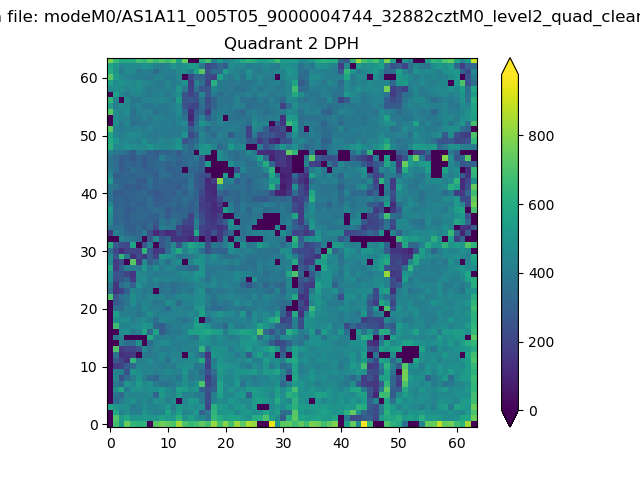
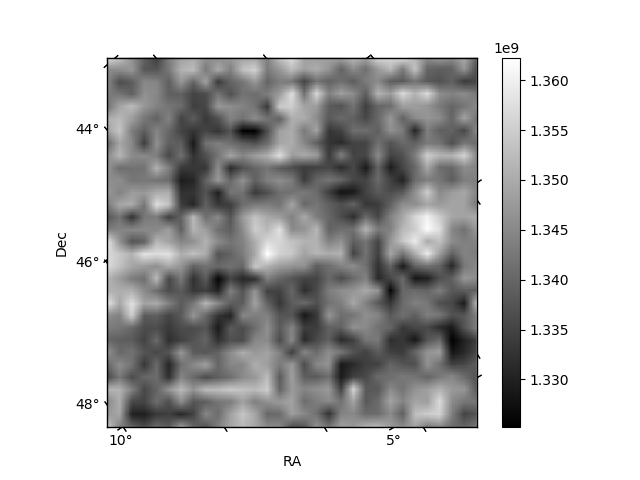
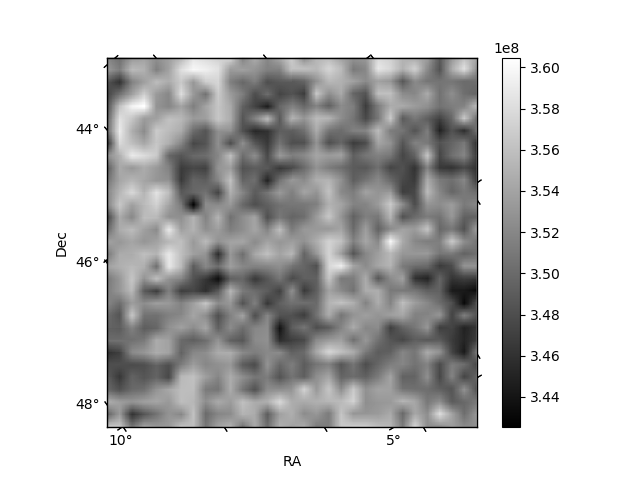
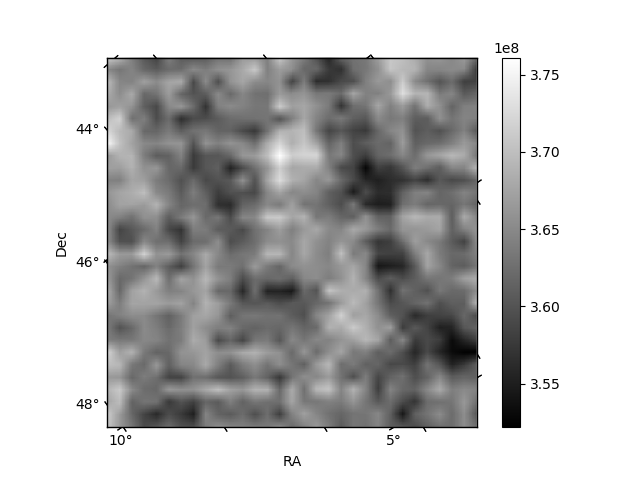
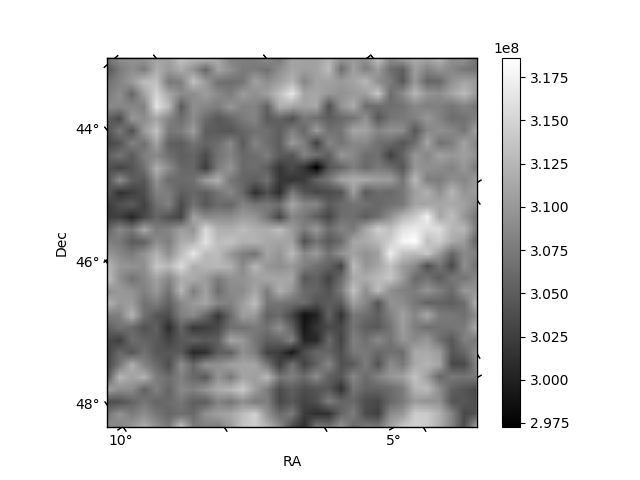
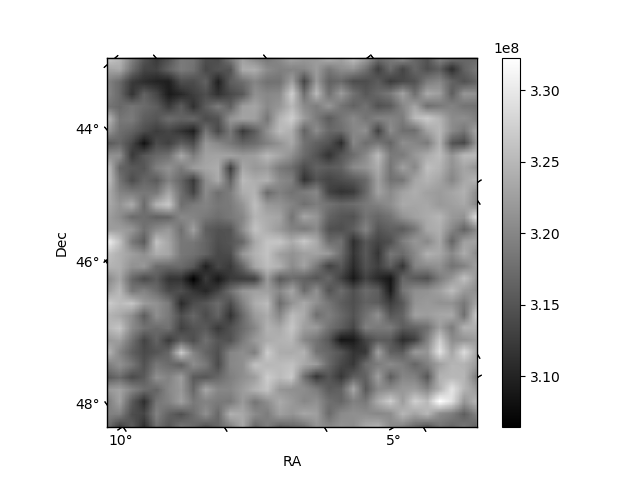
Histogram calculated using DETX and DETY for each event in the final _common_clean file
| Quadrant A | 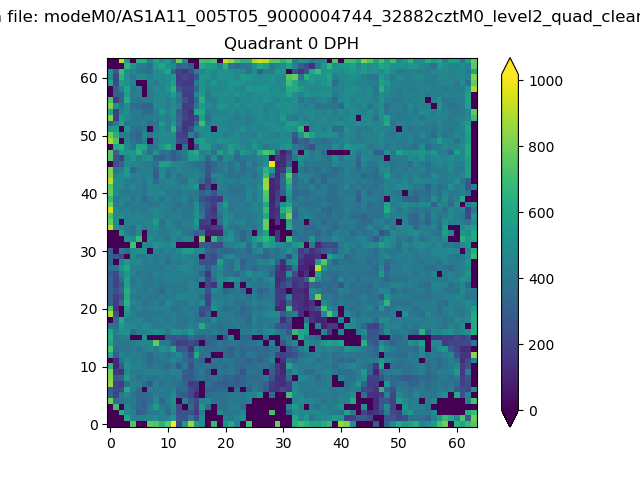 |
 |
Quadrant B |
|---|---|---|---|
| Quadrant D | 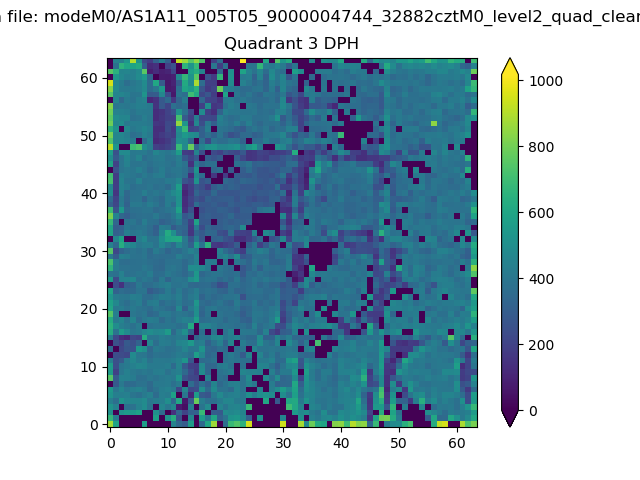 |
 |
Quadrant C |
| Plot type | Count rate plots | Images |
|---|---|---|
| Comparison with Poisson distribution Blue bars denote a histogram of data divided into 1 sec bins. Red curve is a Poisson curve with rate = median count rate of data. |
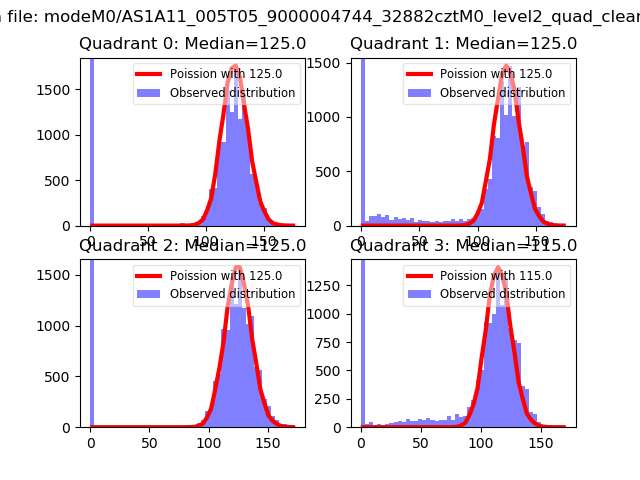 |
 |
| Quadrant-wise count rates Data is divided into 100 sec bins |
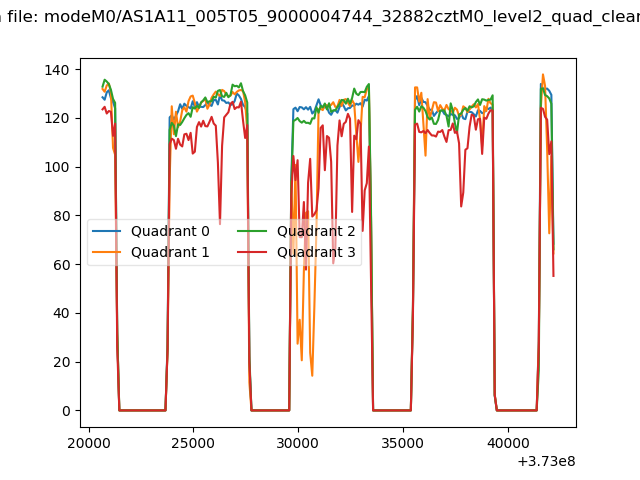 |
|
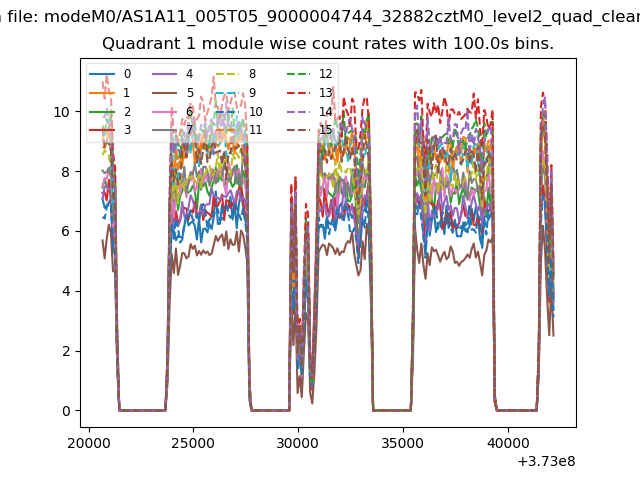
| Module-wise count rates for Quadrant A Data is divided into 100 sec bins |
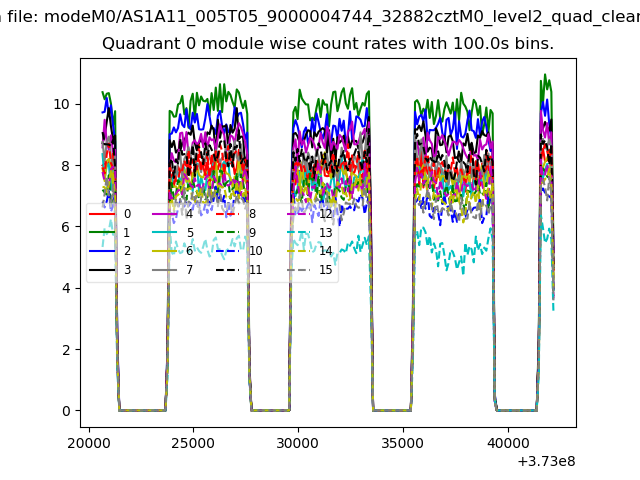 |
 |
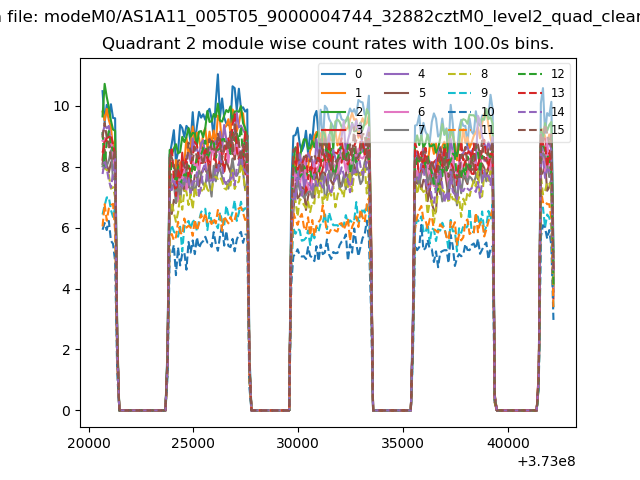
| Module-wise count rates for Quadrant B Data is divided into 100 sec bins |
 |
 |
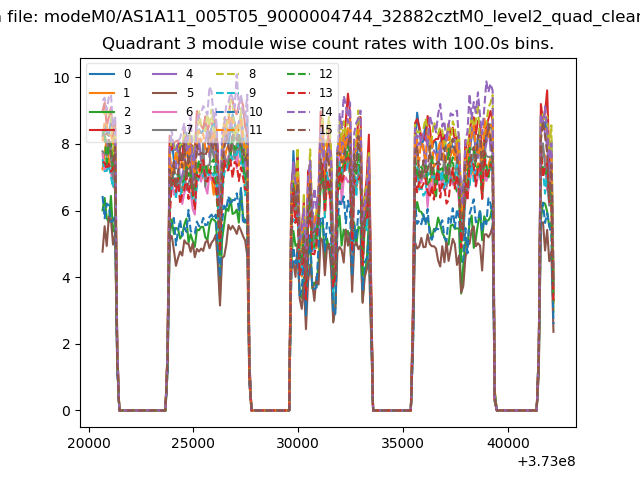
| Module-wise count rates for Quadrant C Data is divided into 100 sec bins |
 |
 |
| Module-wise count rates for Quadrant D Data is divided into 100 sec bins |
 |
 |
| Parameter | Plot |
|---|---|
| CZT HV Monitor |  |
| D_VDD | 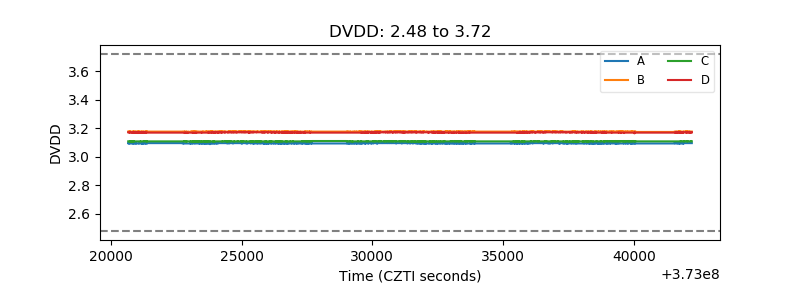 |
| Temperature 1 | 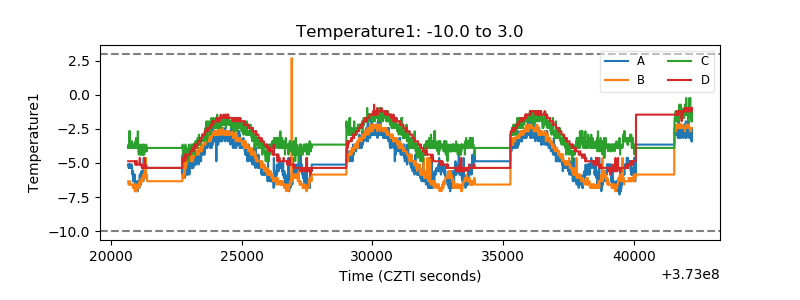 |
| Veto HV Monitor | 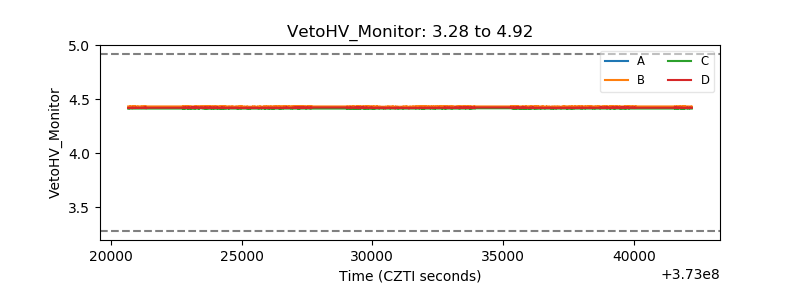 |
| Veto LLD |  |
| Alpha Counter | 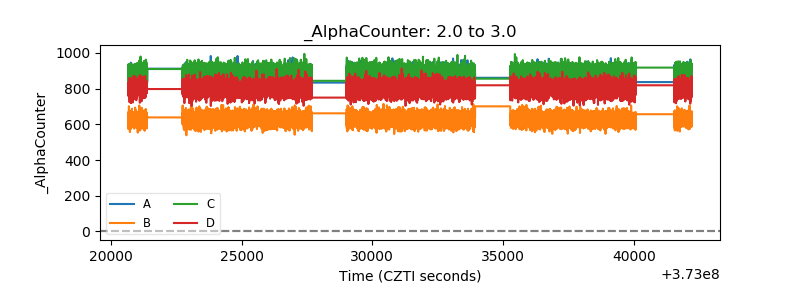 |
| _CPM_Rate | 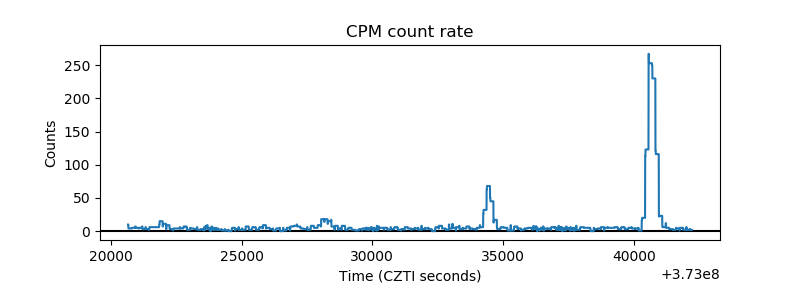 |
| CZT Counter | 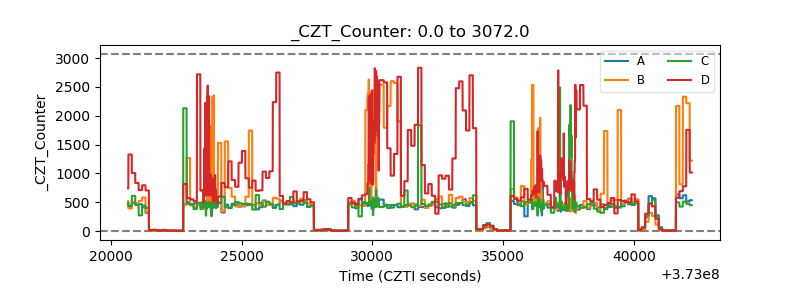 |
| +2.5 Volts monitor |  |
| +5 Volts monitor |  |
| _ROLL_ROT | 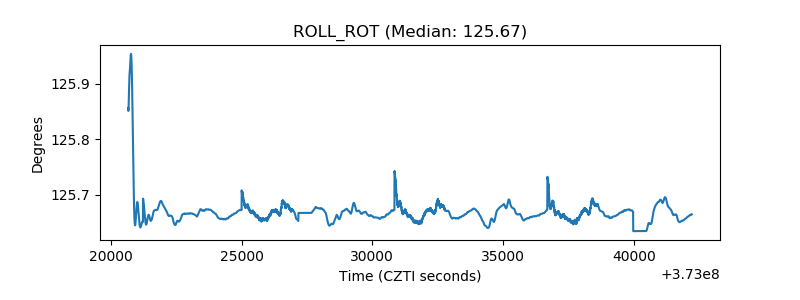 |
| _Roll_DEC | 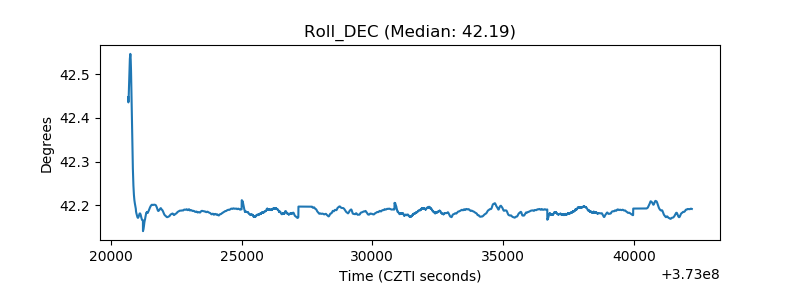 |
| _Roll_RA | 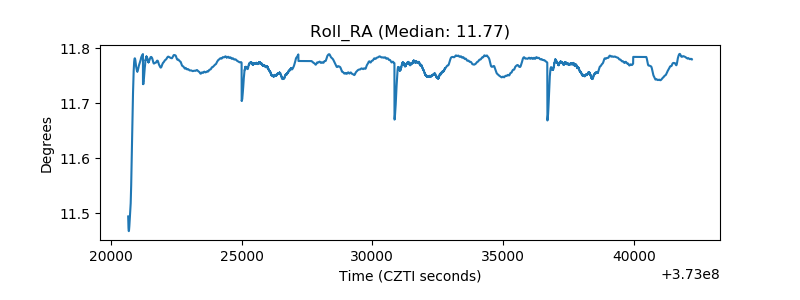 |
| Veto Counter | 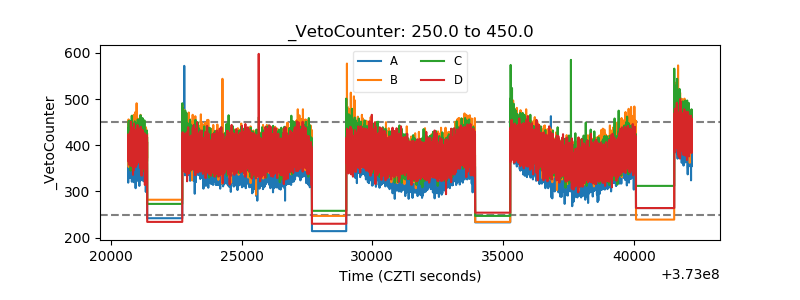 |