| Param | Original file | Final file |
|---|---|---|
| Filename | modeM0/AS1A11_005T05_9000004744_32883cztM0_level2.evt | modeM0/AS1A11_005T05_9000004744_32883cztM0_level2_quad_clean.evt |
| Size (bytes) | 1,045,140,480 | 135,895,680 |
| Size | 996.7 MB | 129.6 MB |
| Events in quadrant A | 4,339,075 | 942,360 |
| Events in quadrant B | 6,700,820 | 884,350 |
| Events in quadrant C | 5,366,396 | 934,226 |
| Events in quadrant D | 14,591,886 | 680,898 |
| Mode SS | |||
|---|---|---|---|
| Quadrant | BADHDUFLAG | Total packets | Discarded packets |
| A | 0 | 198 | 0 |
| B | 0 | 198 | 0 |
| C | 0 | 198 | 0 |
| D | 0 | 198 | 0 |
| Mode M9 | |||
|---|---|---|---|
| Quadrant | BADHDUFLAG | Total packets | Discarded packets |
| A | 0 | 32 | 0 |
| B | 0 | 32 | 0 |
| C | 0 | 32 | 0 |
| D | 0 | 32 | 0 |
| Mode M0 | |||
|---|---|---|---|
| Quadrant | BADHDUFLAG | Total packets | Discarded packets |
| A | 0 | 19581 | 3 |
| B | 0 | 26219 | 2 |
| C | 0 | 22349 | 2 |
| D | 0 | 50109 | 2 |
| Quadrant | Total seconds | Saturated seconds | Saturation percentage |
|---|---|---|---|
| A | 9696 | 8 | 0.082508% |
| B | 9696 | 810 | 8.353960% |
| C | 9696 | 317 | 3.269389% |
| D | 9696 | 3113 | 32.106023% |
Noise dominated data is calculated using 1-second bins in cleaned event files. If a bin has >2000 counts, and if more than 50% of those come from <1% of pixels, then it is considered to be noise-dominated and hence unusable.
| Quadrant | # 1 sec bins | Bins with >0 counts | Bins with >2000 counts | High rate bins dominated by noise | Noise dominated (total time) | Noise dominated (detector-on time) | Marked lightcurve |
|---|---|---|---|---|---|---|---|
| A | 12982 | 9698 | 1 | 1 | 0.01% | 0.01% | 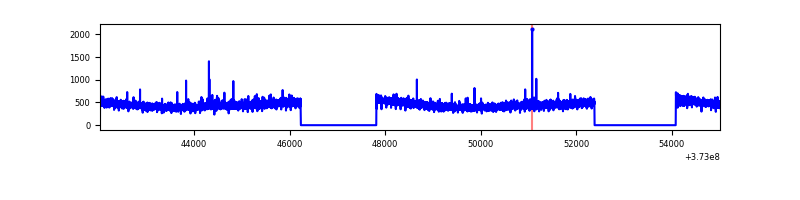 |
| B | 12982 | 9698 | 594 | 594 | 4.58% | 6.12% | 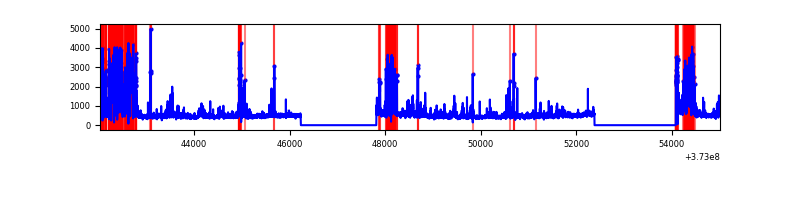 |
| C | 12982 | 9698 | 241 | 241 | 1.86% | 2.49% | 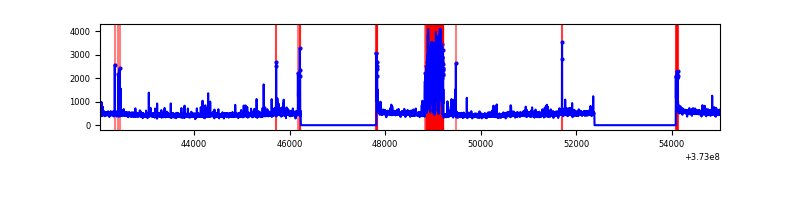 |
| D | 12982 | 9698 | 2684 | 2684 | 20.67% | 27.68% |  |
Top three noisy pixels from each quadrant. If the there are fewer than three noisy pixels in the level2.evt file, extra rows are filled as -1
| Pixel properties | Quadrant properties | ||||||
|---|---|---|---|---|---|---|---|
| Quadrant | DetID | PixID | Counts | Sigma | Mean | Median | Sigma |
| A | 14 | 239 | 21664 | 92.24 | 1113 | 1092 | 223.0 |
| A | 13 | 254 | 18358 | 77.41 | 1113 | 1092 | 223.0 |
| A | 3 | 137 | 10262 | 41.12 | 1113 | 1092 | 223.0 |
| B | 5 | 172 | 1996645 | 10007.44 | 1065 | 1040 | 199.4 |
| B | 0 | 219 | 113518 | 564.05 | 1065 | 1040 | 199.4 |
| B | 15 | 85 | 105473 | 523.7 | 1065 | 1040 | 199.4 |
| C | 0 | 207 | 705850 | 2819.08 | 1087 | 1096 | 250.0 |
| C | 0 | 10 | 148026 | 587.73 | 1087 | 1096 | 250.0 |
| C | 3 | 233 | 113571 | 449.91 | 1087 | 1096 | 250.0 |
| D | 7 | 80 | 5974302 | 25774.63 | 918 | 901 | 231.8 |
| D | 8 | 195 | 2811997 | 12129.6 | 918 | 901 | 231.8 |
| D | 10 | 203 | 852402 | 3674.14 | 918 | 901 | 231.8 |
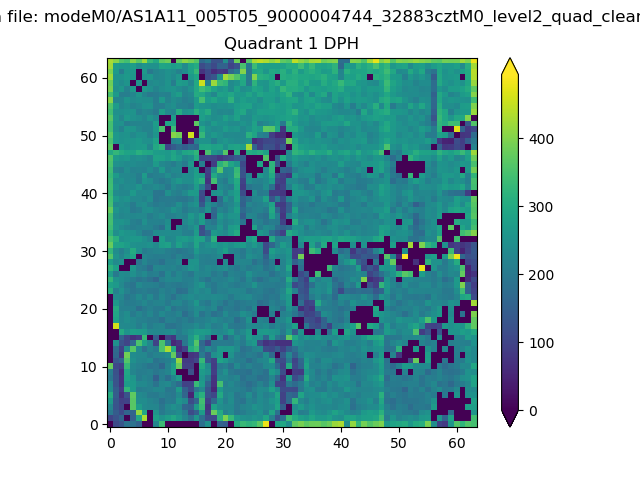
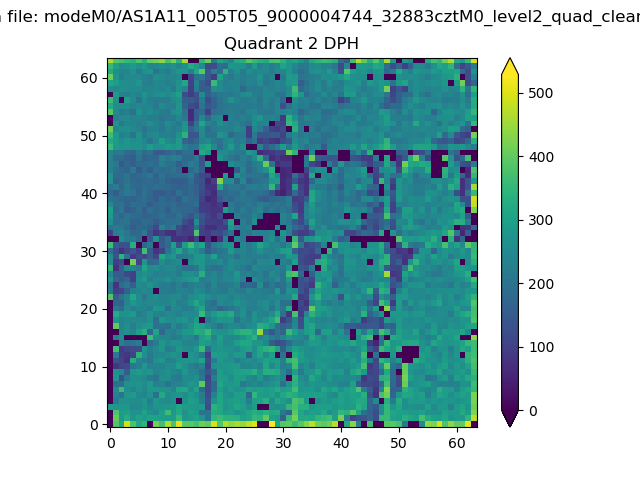
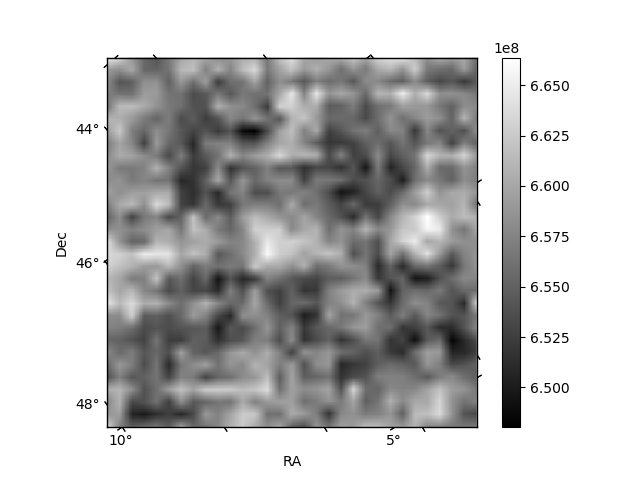
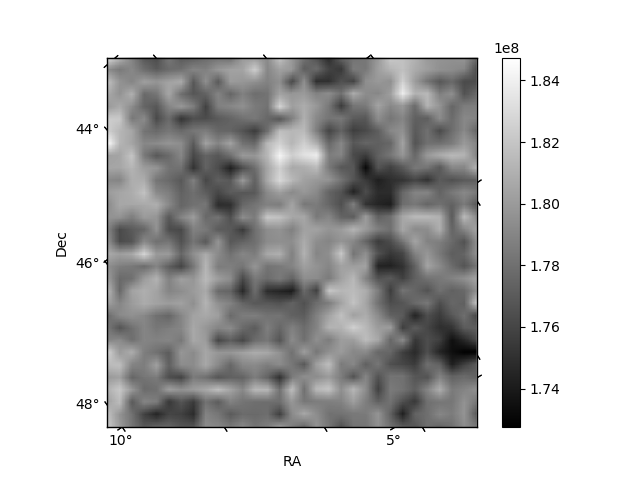
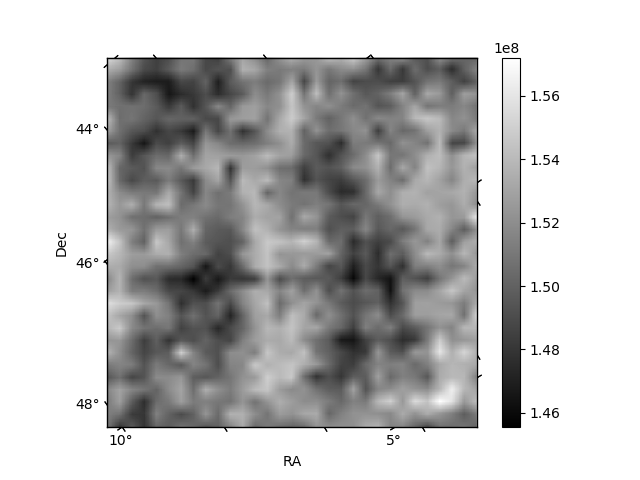
Histogram calculated using DETX and DETY for each event in the final _common_clean file
| Quadrant A | 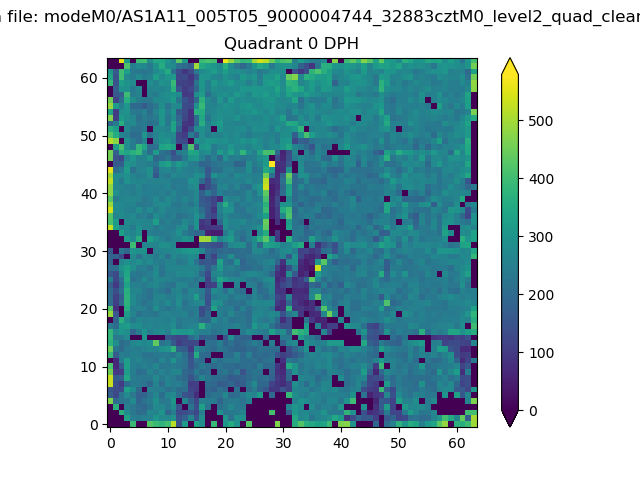 |
 |
Quadrant B |
|---|---|---|---|
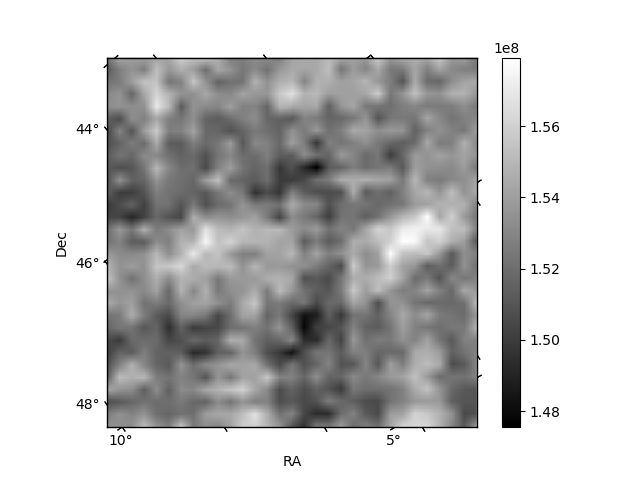
| Quadrant D | 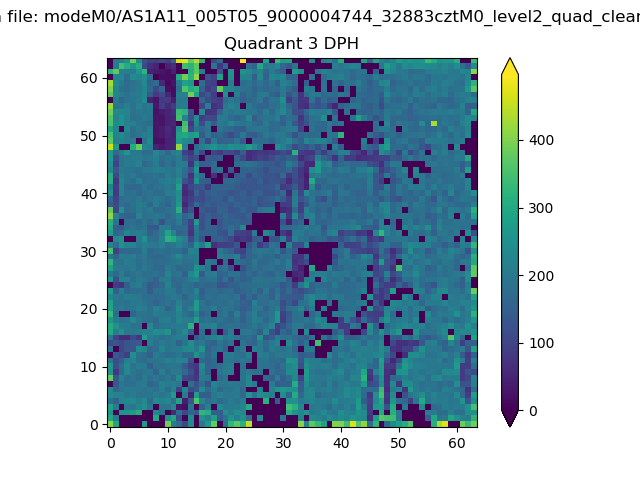 |
 |
Quadrant C |
| Plot type | Count rate plots | Images |
|---|---|---|
| Comparison with Poisson distribution Blue bars denote a histogram of data divided into 1 sec bins. Red curve is a Poisson curve with rate = median count rate of data. |
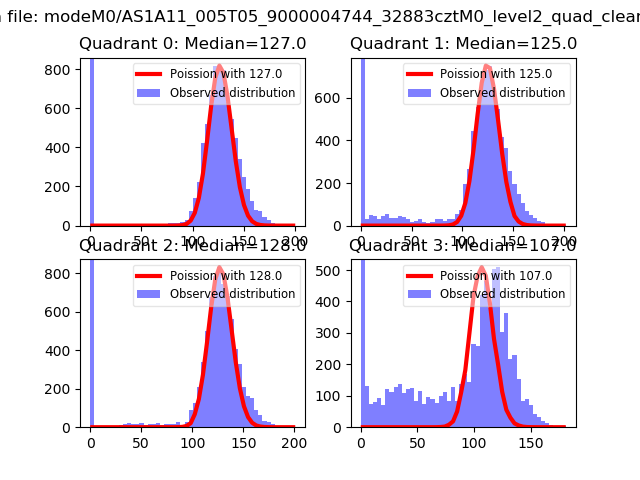 |
 |
| Quadrant-wise count rates Data is divided into 100 sec bins |
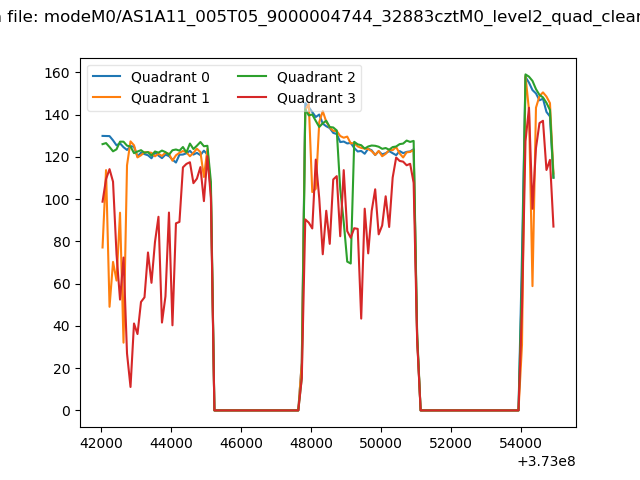 |
|
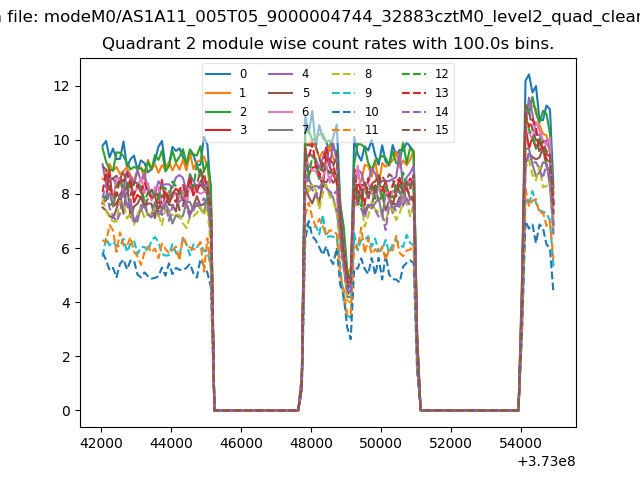
| Module-wise count rates for Quadrant A Data is divided into 100 sec bins |
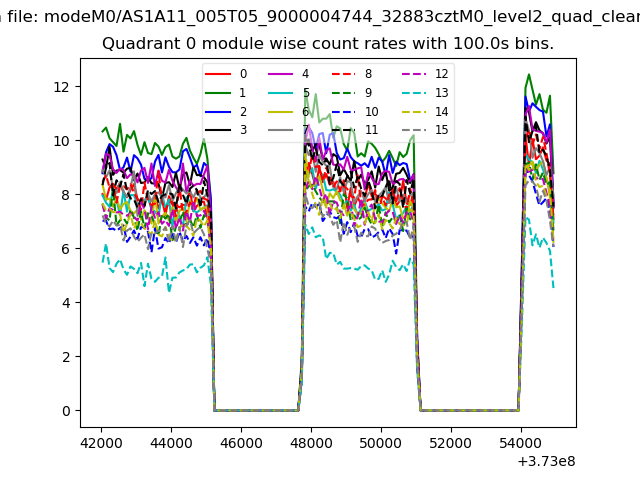 |
 |
| Module-wise count rates for Quadrant B Data is divided into 100 sec bins |
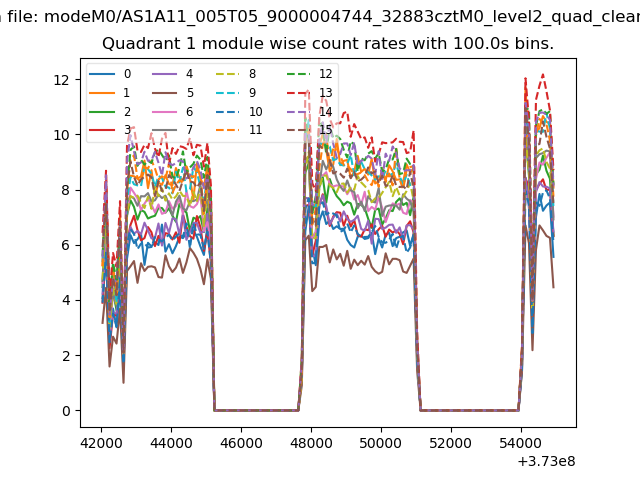 |
 |
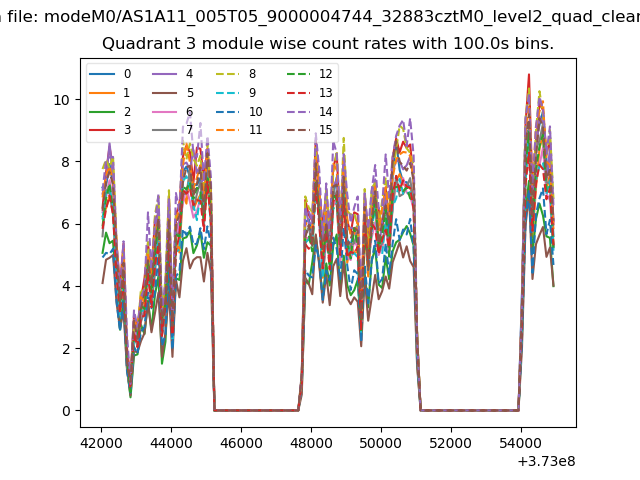
| Module-wise count rates for Quadrant C Data is divided into 100 sec bins |
 |
 |
| Module-wise count rates for Quadrant D Data is divided into 100 sec bins |
 |
 |
| Parameter | Plot |
|---|---|
| CZT HV Monitor | 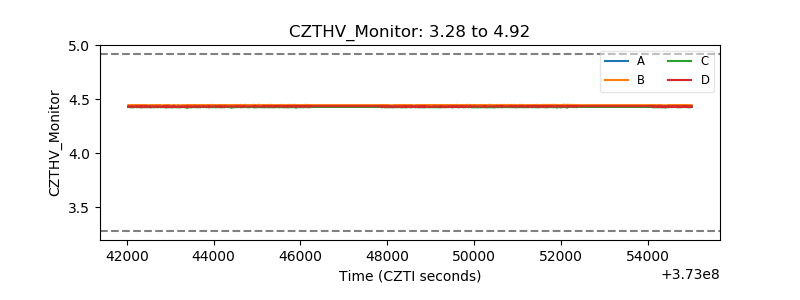 |
| D_VDD | 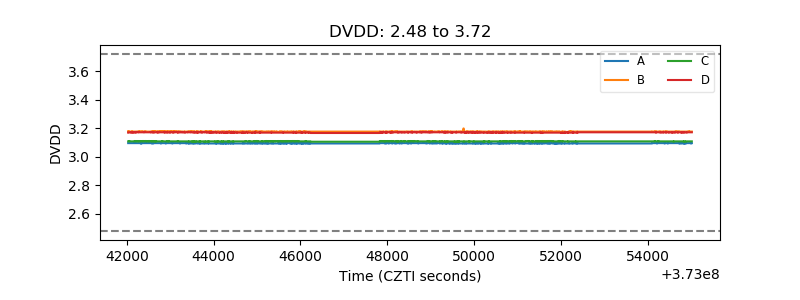 |
| Temperature 1 | 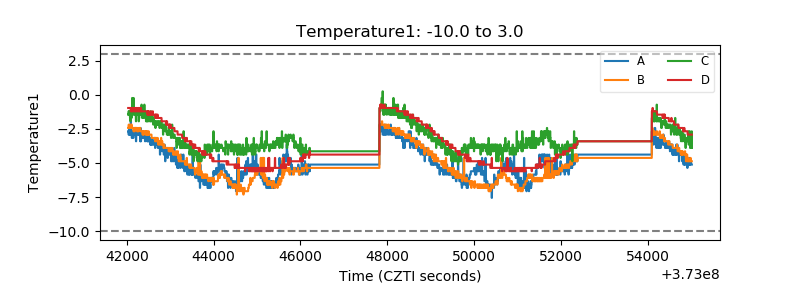 |
| Veto HV Monitor | 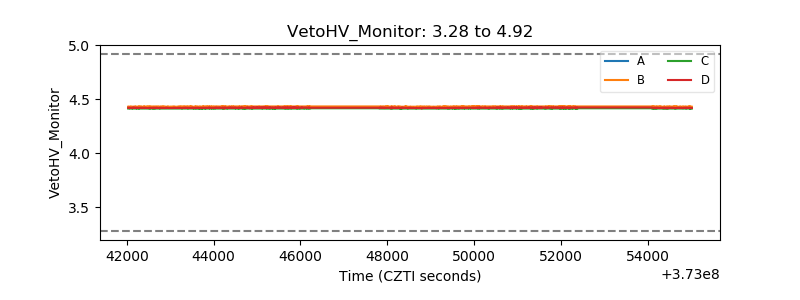 |
| Veto LLD | 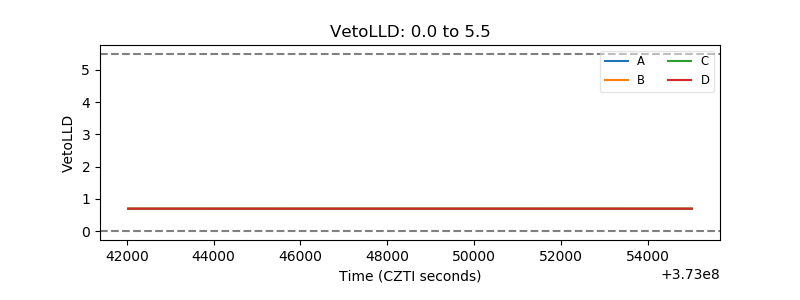 |
| Alpha Counter | 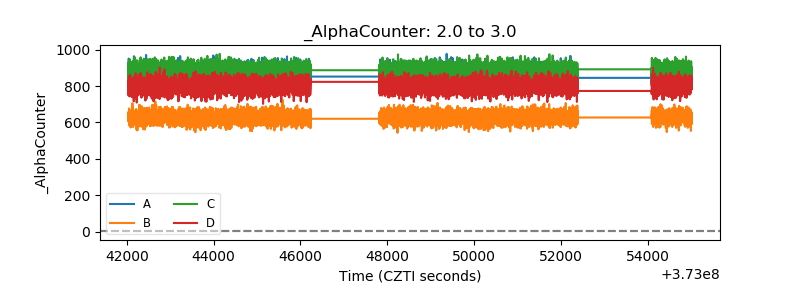 |
| _CPM_Rate | 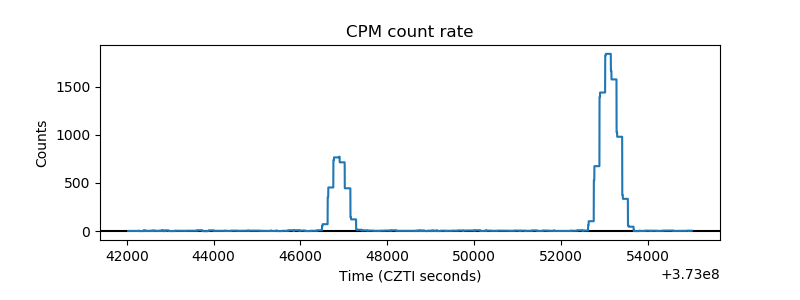 |
| CZT Counter | 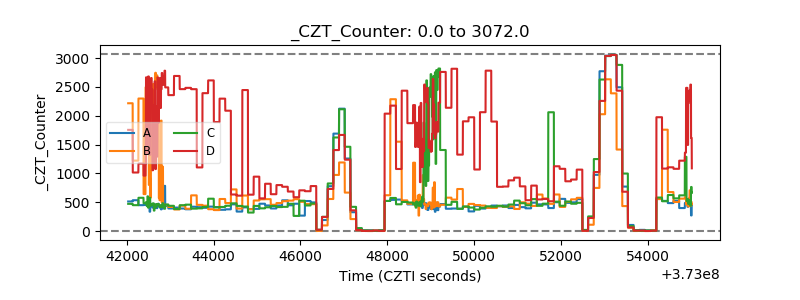 |
| +2.5 Volts monitor |  |
| +5 Volts monitor | 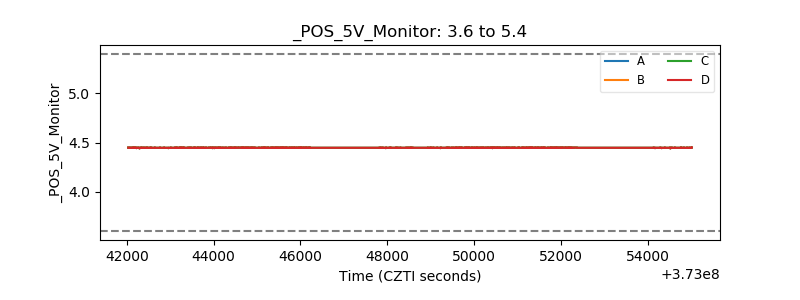 |
| _ROLL_ROT | 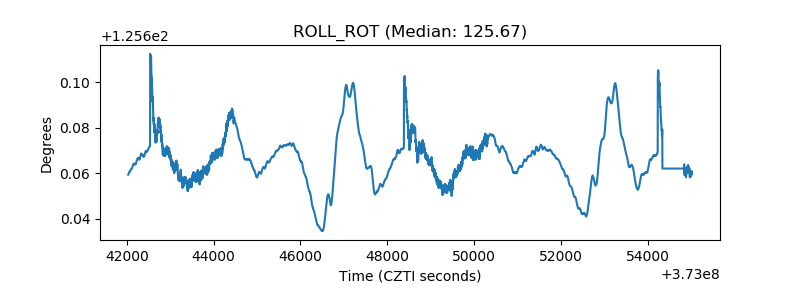 |
| _Roll_DEC |  |
| _Roll_RA | 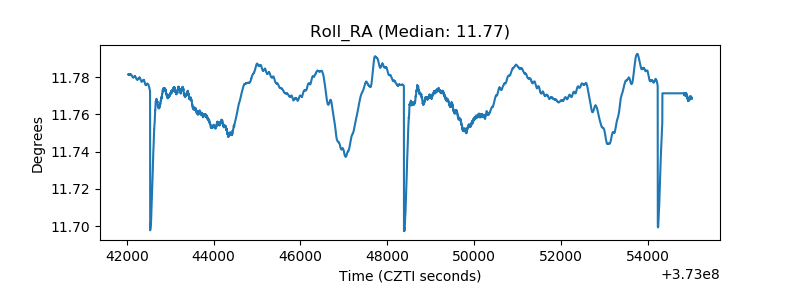 |
| Veto Counter | 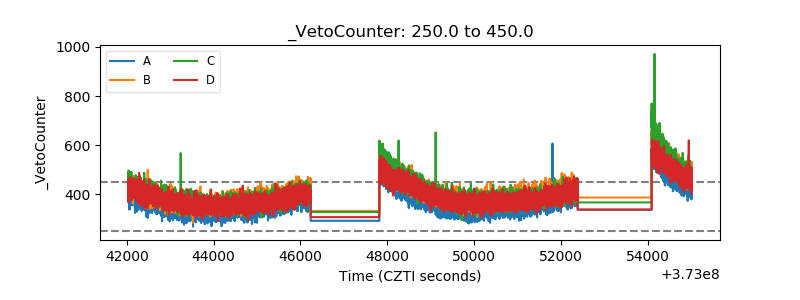 |