| Param | Original file | Final file |
|---|---|---|
| Filename | modeM0/AS1A11_005T05_9000004744_32885cztM0_level2.evt | modeM0/AS1A11_005T05_9000004744_32885cztM0_level2_quad_clean.evt |
| Size (bytes) | 548,821,440 | 78,600,960 |
| Size | 523.4 MB | 75.0 MB |
| Events in quadrant A | 2,550,031 | 522,005 |
| Events in quadrant B | 3,537,425 | 512,184 |
| Events in quadrant C | 3,167,103 | 529,449 |
| Events in quadrant D | 6,996,719 | 433,853 |
| Mode SS | |||
|---|---|---|---|
| Quadrant | BADHDUFLAG | Total packets | Discarded packets |
| A | 0 | 114 | 0 |
| B | 0 | 114 | 0 |
| C | 0 | 114 | 0 |
| D | 0 | 114 | 0 |
| Mode M9 | |||
|---|---|---|---|
| Quadrant | BADHDUFLAG | Total packets | Discarded packets |
| A | 0 | 35 | 0 |
| B | 0 | 35 | 0 |
| C | 0 | 35 | 0 |
| D | 0 | 35 | 0 |
| Mode M0 | |||
|---|---|---|---|
| Quadrant | BADHDUFLAG | Total packets | Discarded packets |
| A | 0 | 11127 | 3 |
| B | 0 | 13953 | 2 |
| C | 0 | 12852 | 2 |
| D | 0 | 24546 | 2 |
| Quadrant | Total seconds | Saturated seconds | Saturation percentage |
|---|---|---|---|
| A | 5459 | 6 | 0.109910% |
| B | 5459 | 329 | 6.026745% |
| C | 5459 | 164 | 3.004213% |
| D | 5459 | 902 | 16.523173% |
Noise dominated data is calculated using 1-second bins in cleaned event files. If a bin has >2000 counts, and if more than 50% of those come from <1% of pixels, then it is considered to be noise-dominated and hence unusable.
| Quadrant | # 1 sec bins | Bins with >0 counts | Bins with >2000 counts | High rate bins dominated by noise | Noise dominated (total time) | Noise dominated (detector-on time) | Marked lightcurve |
|---|---|---|---|---|---|---|---|
| A | 8984 | 5461 | 0 | 0 | 0.00% | 0.00% | 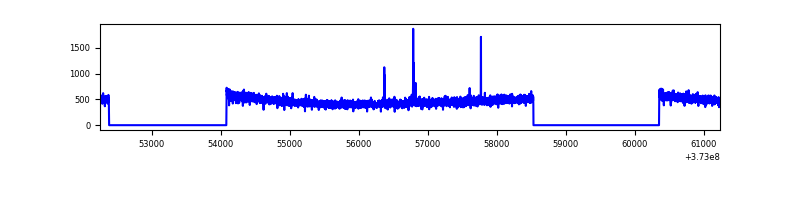 |
| B | 8984 | 5461 | 207 | 207 | 2.30% | 3.79% | 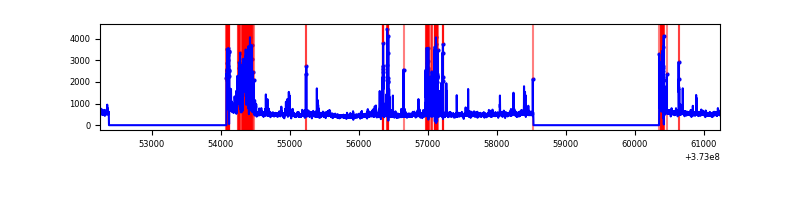 |
| C | 8984 | 5461 | 126 | 126 | 1.40% | 2.31% | 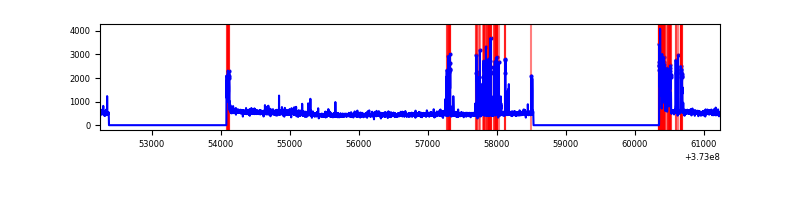 |
| D | 8984 | 5461 | 837 | 837 | 9.32% | 15.33% | 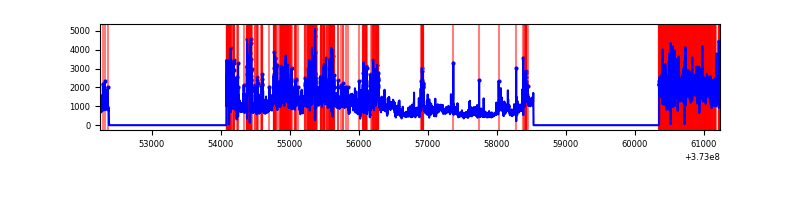 |
Top three noisy pixels from each quadrant. If the there are fewer than three noisy pixels in the level2.evt file, extra rows are filled as -1
| Pixel properties | Quadrant properties | ||||||
|---|---|---|---|---|---|---|---|
| Quadrant | DetID | PixID | Counts | Sigma | Mean | Median | Sigma |
| A | 9 | 143 | 15886 | 117.98 | 653 | 642 | 129.2 |
| A | 13 | 254 | 10811 | 78.7 | 653 | 642 | 129.2 |
| A | 14 | 63 | 6393 | 44.51 | 653 | 642 | 129.2 |
| B | 5 | 172 | 836001 | 6930.67 | 639 | 623 | 120.5 |
| B | 0 | 219 | 45729 | 374.22 | 639 | 623 | 120.5 |
| B | 0 | 190 | 43233 | 353.51 | 639 | 623 | 120.5 |
| C | 0 | 10 | 464884 | 3176.41 | 644 | 651 | 146.2 |
| C | 3 | 233 | 76501 | 518.99 | 644 | 651 | 146.2 |
| C | 0 | 207 | 48104 | 324.69 | 644 | 651 | 146.2 |
| D | 8 | 195 | 2187179 | 14416.5 | 594 | 583 | 151.7 |
| D | 7 | 80 | 1270162 | 8370.49 | 594 | 583 | 151.7 |
| D | 12 | 218 | 346312 | 2279.43 | 594 | 583 | 151.7 |
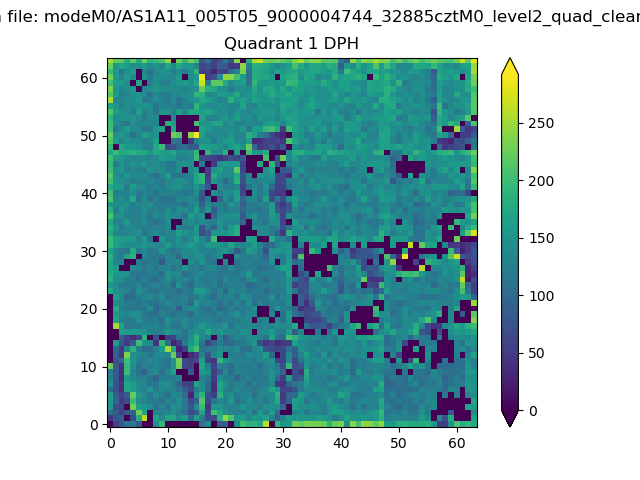
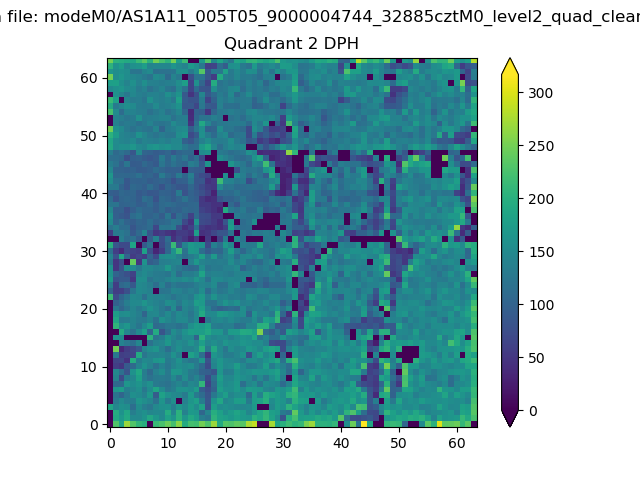
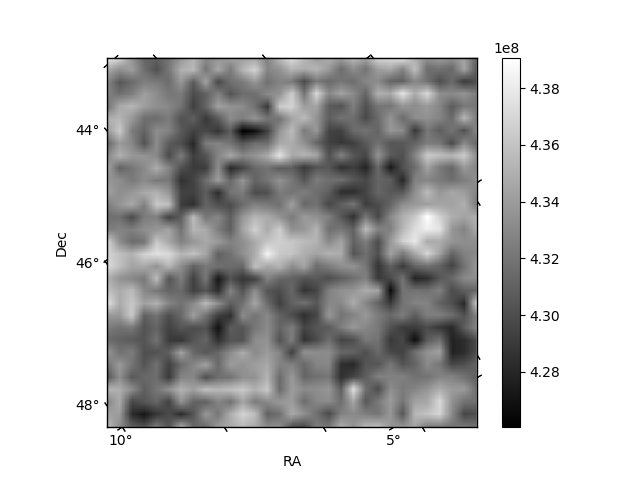
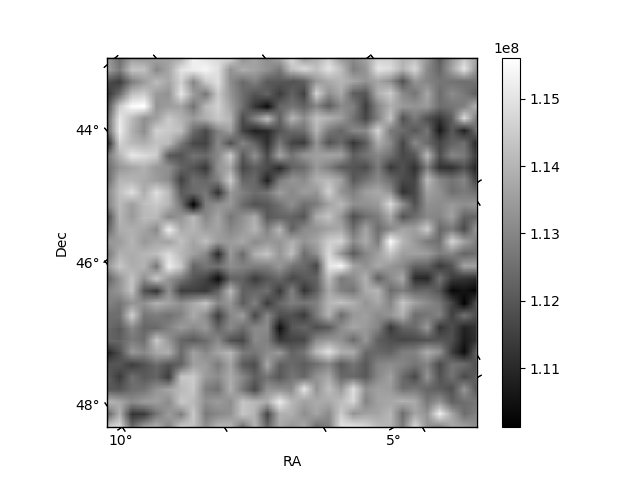
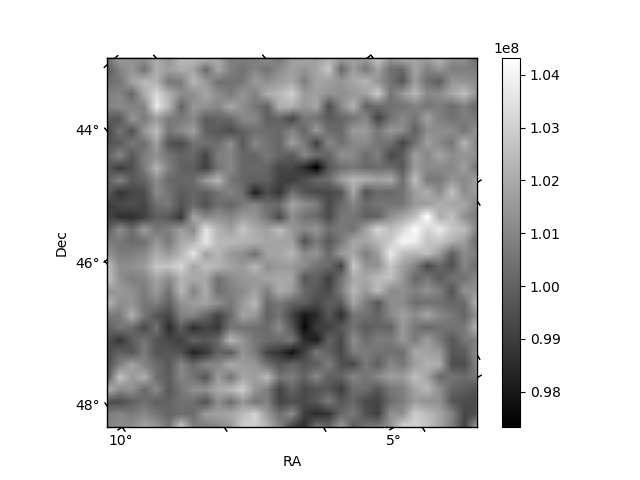
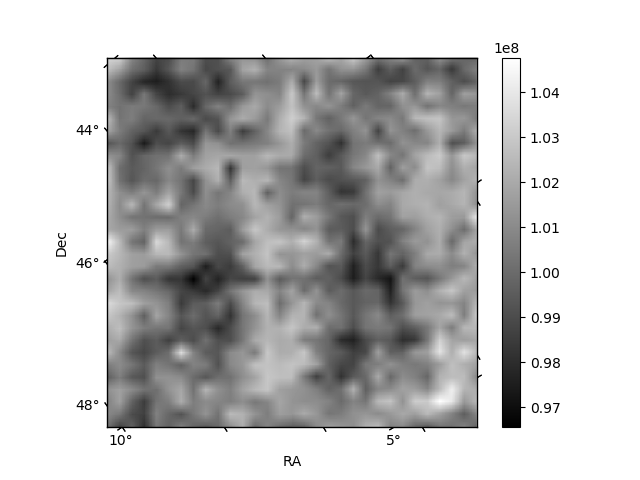
Histogram calculated using DETX and DETY for each event in the final _common_clean file
| Quadrant A |  |
 |
Quadrant B |
|---|---|---|---|
| Quadrant D | 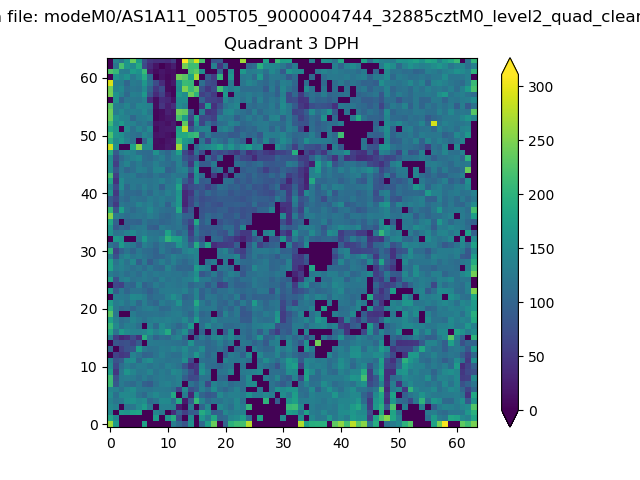 |
 |
Quadrant C |
| Plot type | Count rate plots | Images |
|---|---|---|
| Comparison with Poisson distribution Blue bars denote a histogram of data divided into 1 sec bins. Red curve is a Poisson curve with rate = median count rate of data. |
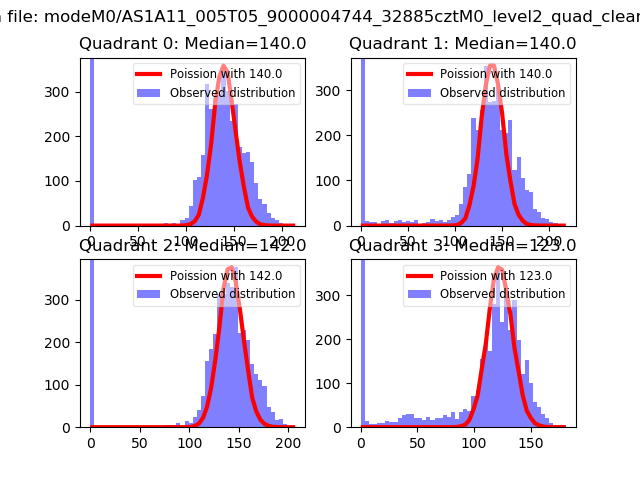 |
 |
| Quadrant-wise count rates Data is divided into 100 sec bins |
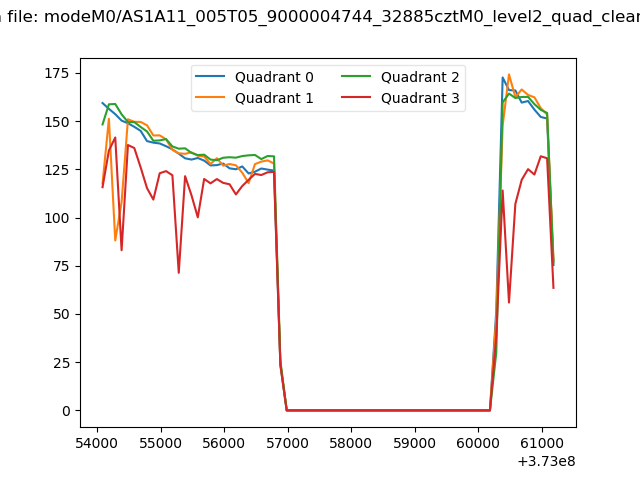 |
|
| Module-wise count rates for Quadrant A Data is divided into 100 sec bins |
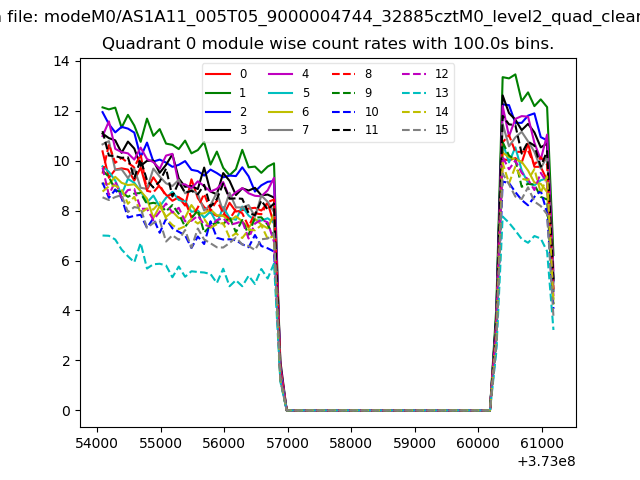 |
 |
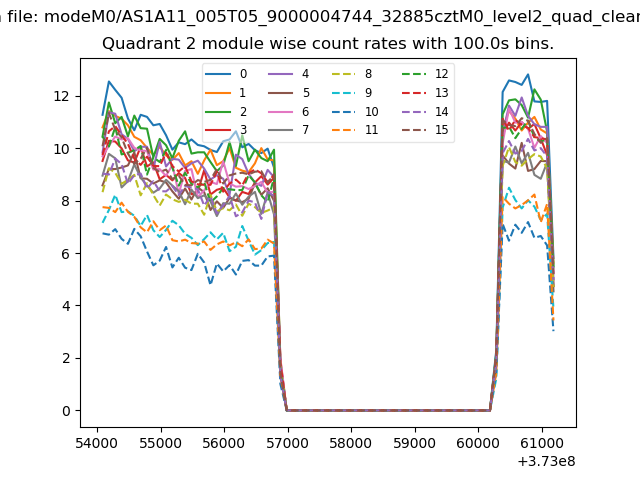
| Module-wise count rates for Quadrant B Data is divided into 100 sec bins |
 |
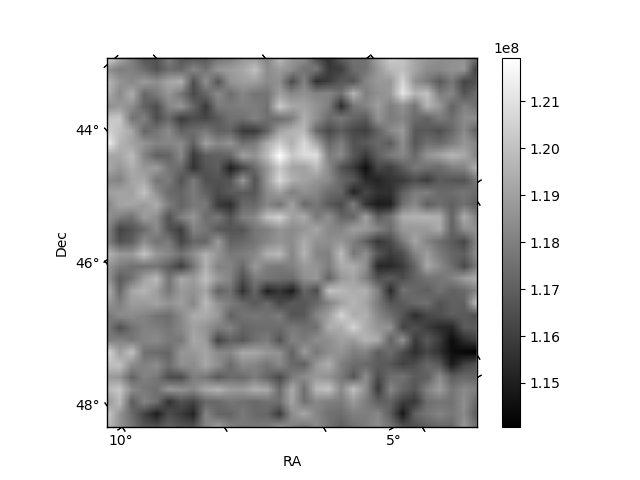 |
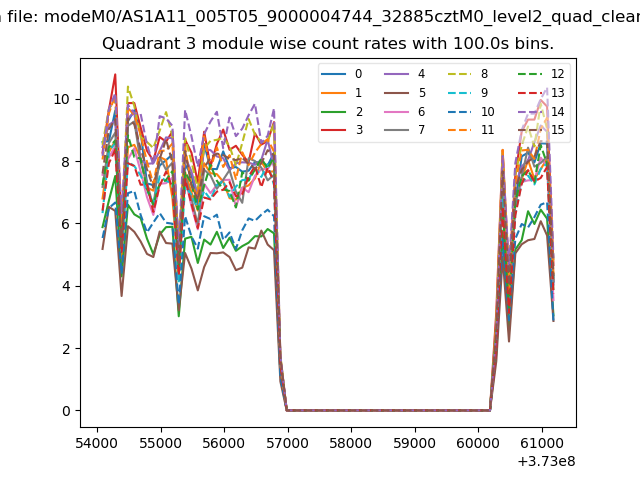
| Module-wise count rates for Quadrant C Data is divided into 100 sec bins |
 |
 |
| Module-wise count rates for Quadrant D Data is divided into 100 sec bins |
 |
 |
| Parameter | Plot |
|---|---|
| CZT HV Monitor | 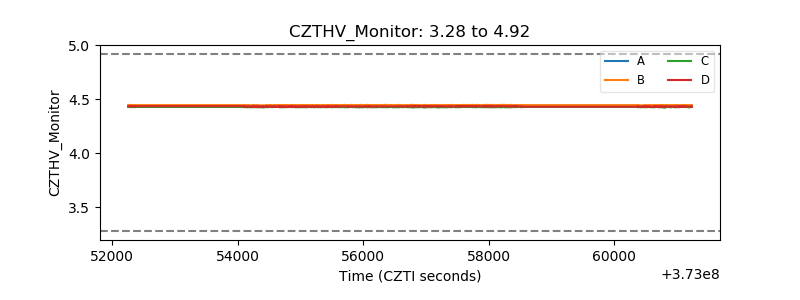 |
| D_VDD | 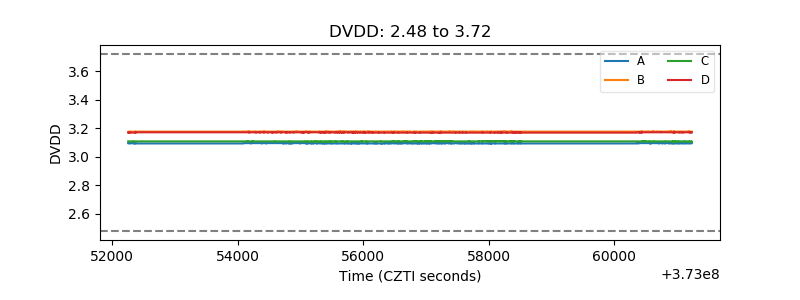 |
| Temperature 1 | 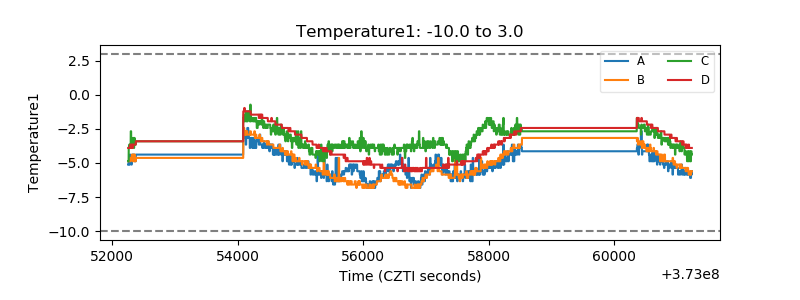 |
| Veto HV Monitor | 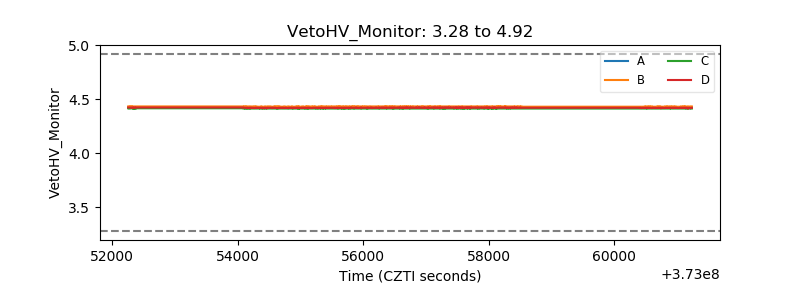 |
| Veto LLD | 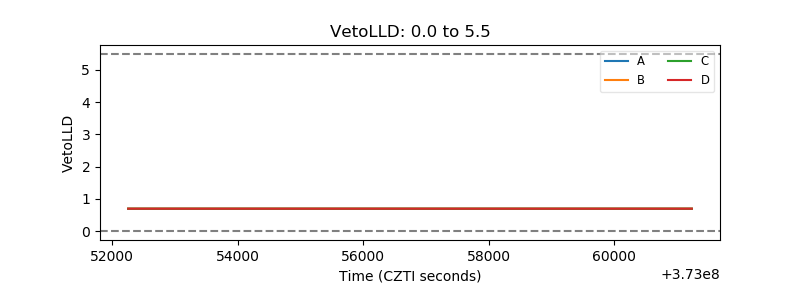 |
| Alpha Counter | 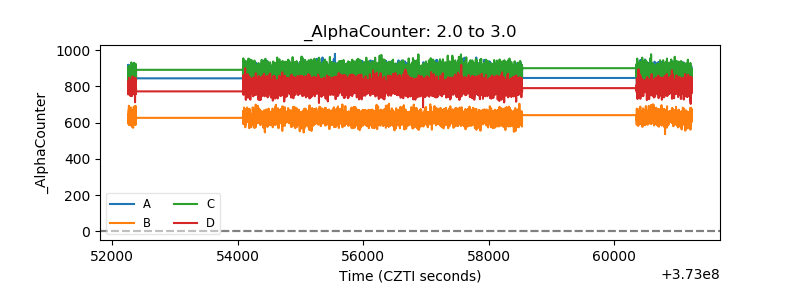 |
| _CPM_Rate | 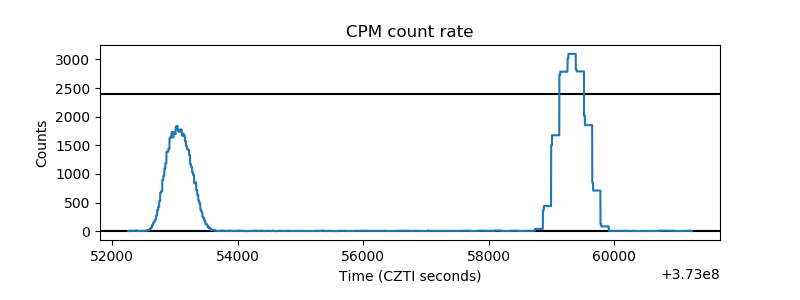 |
| CZT Counter | 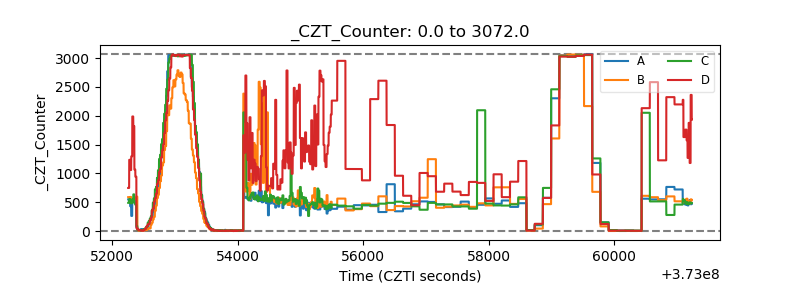 |
| +2.5 Volts monitor |  |
| +5 Volts monitor |  |
| _ROLL_ROT | 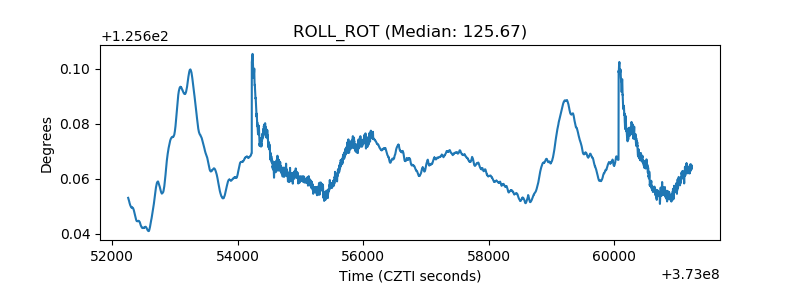 |
| _Roll_DEC | 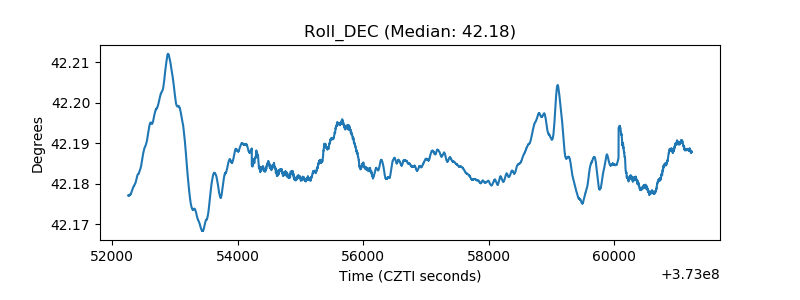 |
| _Roll_RA | 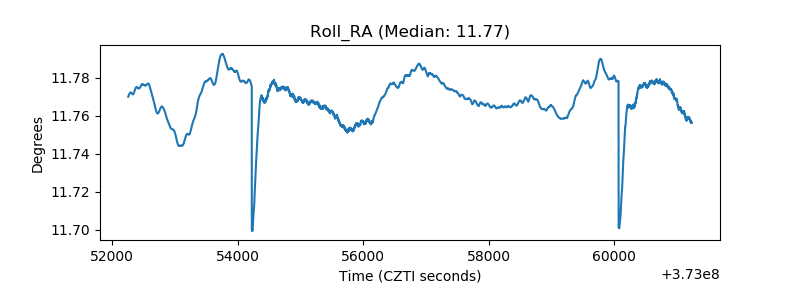 |
| Veto Counter | 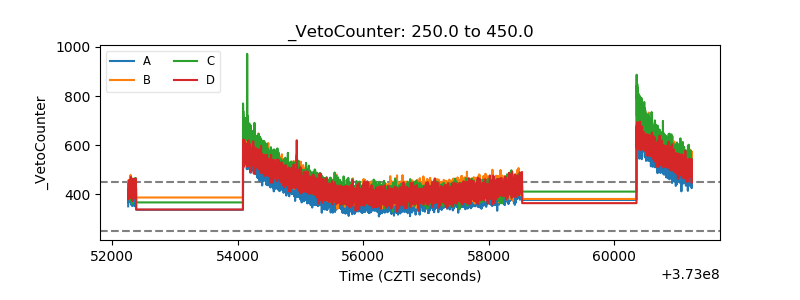 |