| Param | Original file | Final file |
|---|---|---|
| Filename | modeM0/AS1A11_005T05_9000004744_32886cztM0_level2.evt | modeM0/AS1A11_005T05_9000004744_32886cztM0_level2_quad_clean.evt |
| Size (bytes) | 545,523,840 | 74,606,400 |
| Size | 520.3 MB | 71.2 MB |
| Events in quadrant A | 2,483,441 | 494,529 |
| Events in quadrant B | 3,266,733 | 500,523 |
| Events in quadrant C | 2,952,119 | 498,971 |
| Events in quadrant D | 7,466,930 | 400,539 |
| Mode SS | |||
|---|---|---|---|
| Quadrant | BADHDUFLAG | Total packets | Discarded packets |
| A | 0 | 106 | 0 |
| B | 0 | 106 | 0 |
| C | 0 | 106 | 0 |
| D | 0 | 106 | 0 |
| Mode M9 | |||
|---|---|---|---|
| Quadrant | BADHDUFLAG | Total packets | Discarded packets |
| A | 0 | 30 | 0 |
| B | 0 | 30 | 0 |
| C | 0 | 30 | 0 |
| D | 0 | 31 | 0 |
| Mode M0 | |||
|---|---|---|---|
| Quadrant | BADHDUFLAG | Total packets | Discarded packets |
| A | 0 | 10586 | 2 |
| B | 0 | 12936 | 1 |
| C | 0 | 12000 | 1 |
| D | 0 | 25828 | 1 |
| Quadrant | Total seconds | Saturated seconds | Saturation percentage |
|---|---|---|---|
| A | 5197 | 4 | 0.076967% |
| B | 5197 | 282 | 5.426207% |
| C | 5197 | 110 | 2.116606% |
| D | 5197 | 1290 | 24.822013% |
Noise dominated data is calculated using 1-second bins in cleaned event files. If a bin has >2000 counts, and if more than 50% of those come from <1% of pixels, then it is considered to be noise-dominated and hence unusable.
| Quadrant | # 1 sec bins | Bins with >0 counts | Bins with >2000 counts | High rate bins dominated by noise | Noise dominated (total time) | Noise dominated (detector-on time) | Marked lightcurve |
|---|---|---|---|---|---|---|---|
| A | 7170 | 5198 | 0 | 0 | 0.00% | 0.00% | 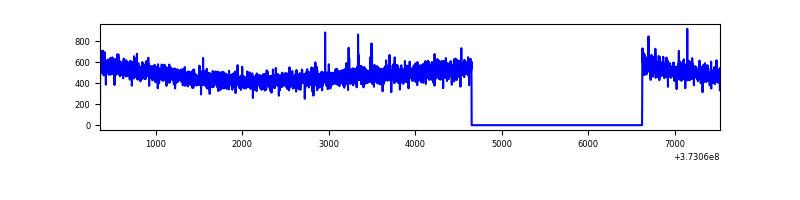 |
| B | 7170 | 5198 | 179 | 179 | 2.50% | 3.44% | 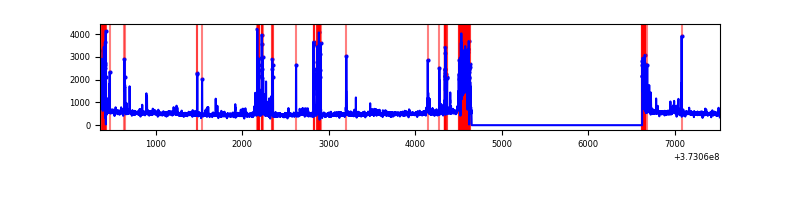 |
| C | 7170 | 5198 | 84 | 84 | 1.17% | 1.62% | 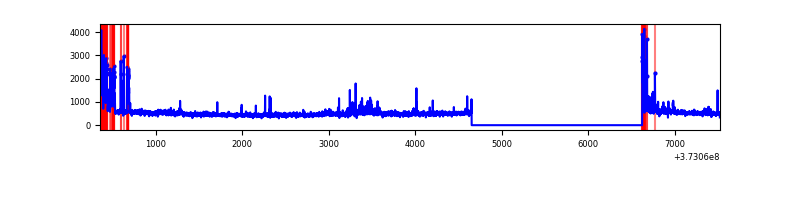 |
| D | 7170 | 5198 | 1169 | 1169 | 16.30% | 22.49% | 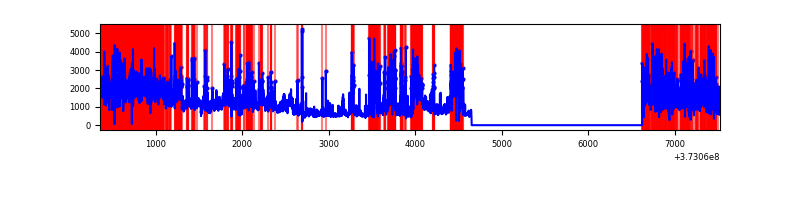 |
Top three noisy pixels from each quadrant. If the there are fewer than three noisy pixels in the level2.evt file, extra rows are filled as -1
| Pixel properties | Quadrant properties | ||||||
|---|---|---|---|---|---|---|---|
| Quadrant | DetID | PixID | Counts | Sigma | Mean | Median | Sigma |
| A | 14 | 239 | 10876 | 81.29 | 637 | 627 | 126.1 |
| A | 13 | 254 | 9837 | 73.05 | 637 | 627 | 126.1 |
| A | 0 | 226 | 5445 | 38.21 | 637 | 627 | 126.1 |
| B | 5 | 172 | 577133 | 4956.54 | 626 | 610 | 116.3 |
| B | 0 | 190 | 41519 | 351.71 | 626 | 610 | 116.3 |
| B | 15 | 85 | 40061 | 339.17 | 626 | 610 | 116.3 |
| C | 0 | 10 | 320635 | 2228.11 | 628 | 635 | 143.6 |
| C | 3 | 233 | 79130 | 546.55 | 628 | 635 | 143.6 |
| C | 0 | 207 | 56676 | 390.21 | 628 | 635 | 143.6 |
| D | 8 | 195 | 1793218 | 12564.46 | 551 | 541 | 142.7 |
| D | 7 | 80 | 1762833 | 12351.5 | 551 | 541 | 142.7 |
| D | 12 | 218 | 879257 | 6158.72 | 551 | 541 | 142.7 |
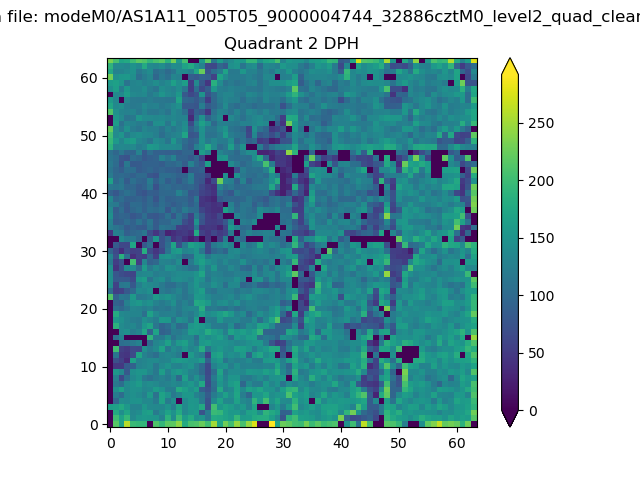
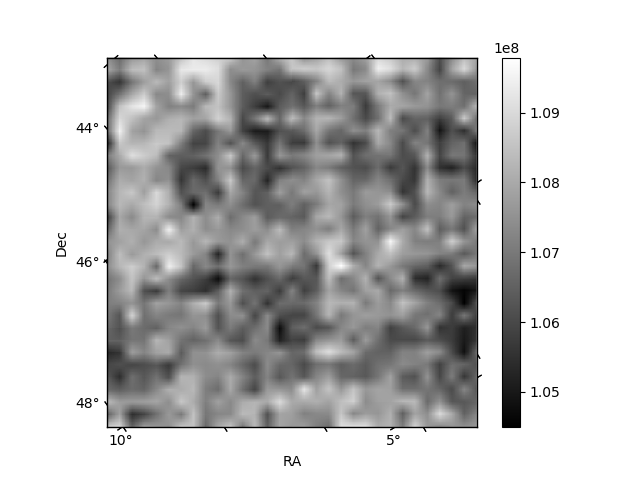
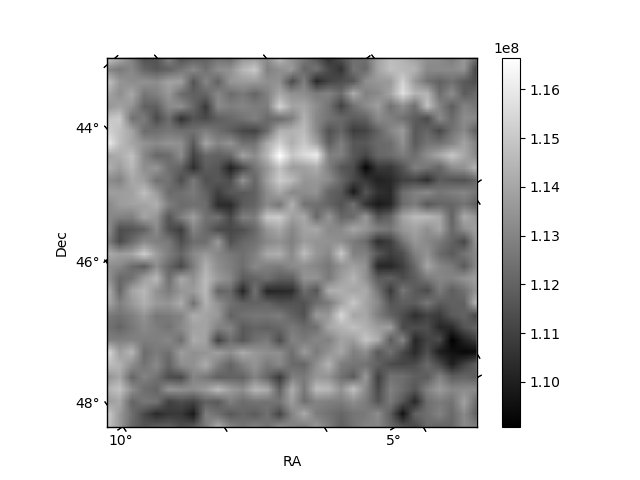
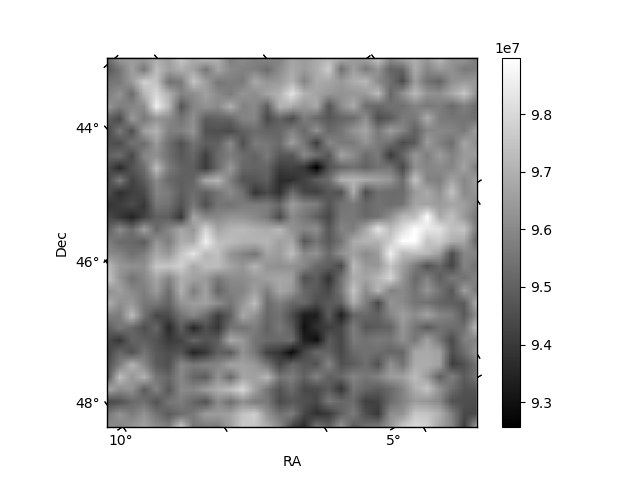
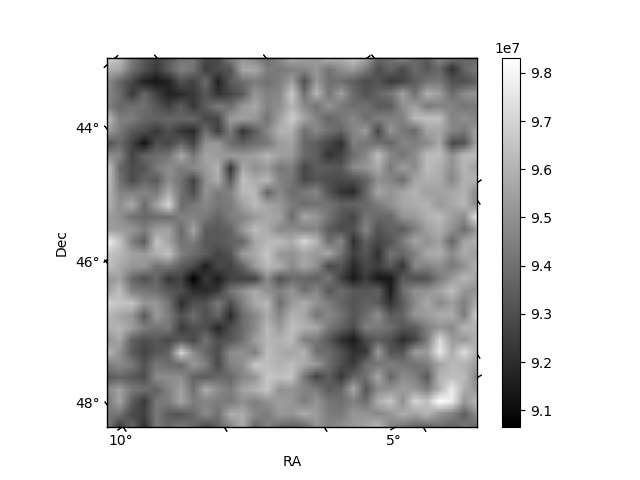
Histogram calculated using DETX and DETY for each event in the final _common_clean file
| Quadrant A | 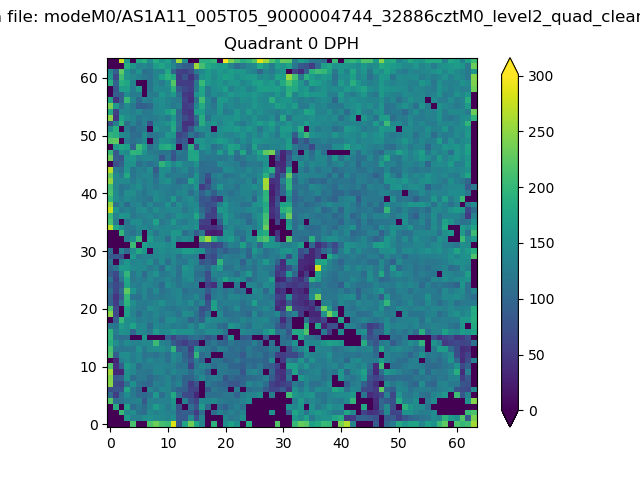 |
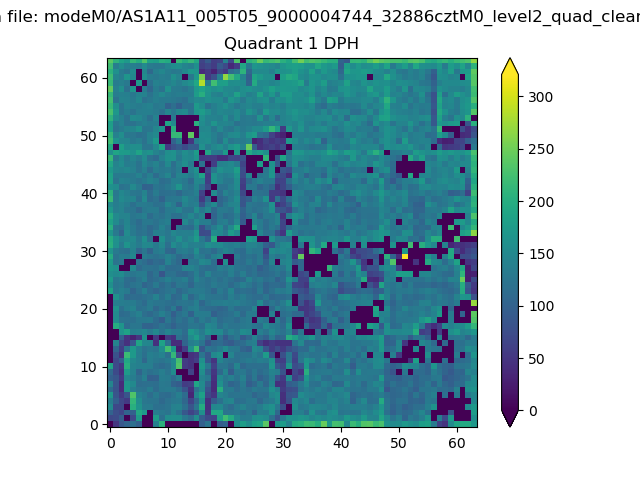 |
Quadrant B |
|---|---|---|---|
| Quadrant D | 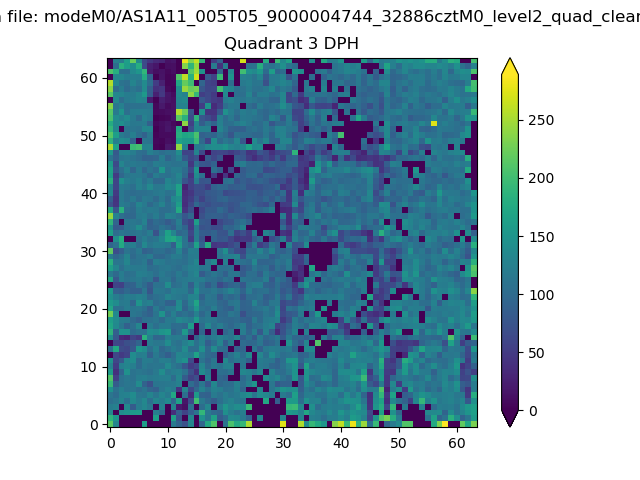 |
 |
Quadrant C |
| Plot type | Count rate plots | Images |
|---|---|---|
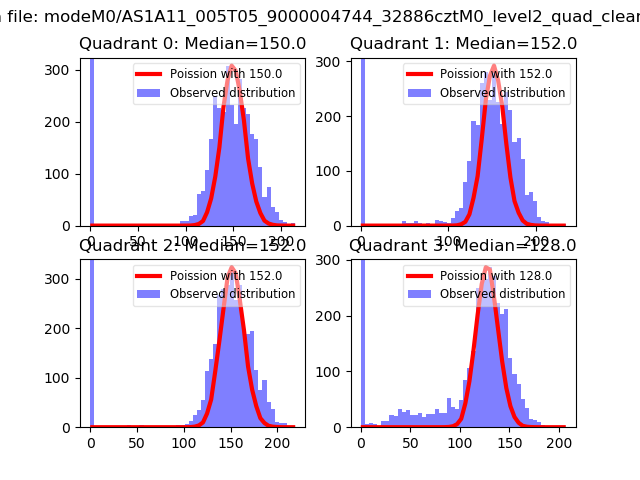
| Comparison with Poisson distribution Blue bars denote a histogram of data divided into 1 sec bins. Red curve is a Poisson curve with rate = median count rate of data. |
 |
 |
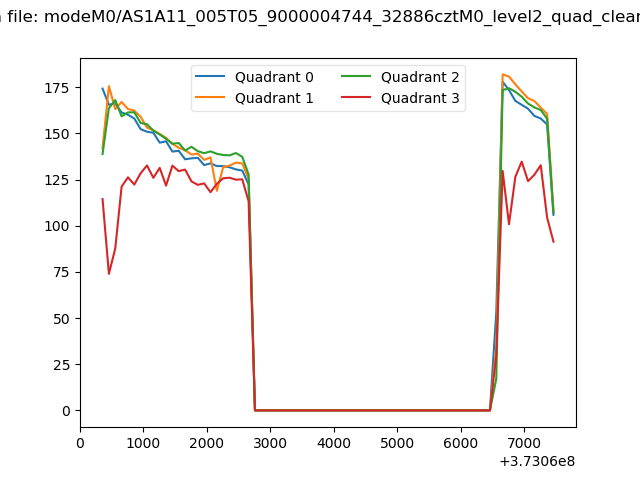
| Quadrant-wise count rates Data is divided into 100 sec bins |
 |
|
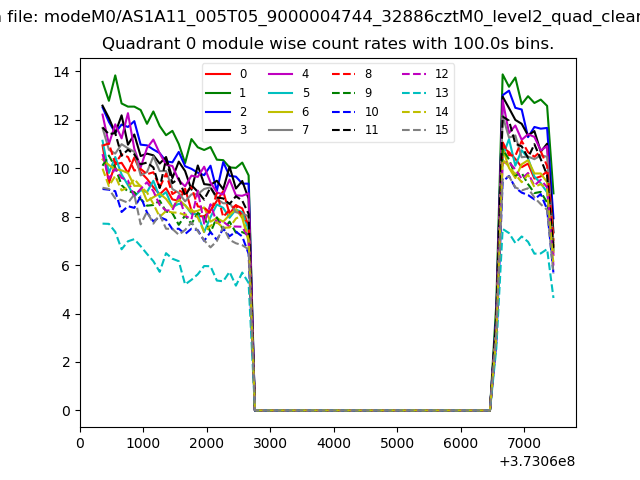
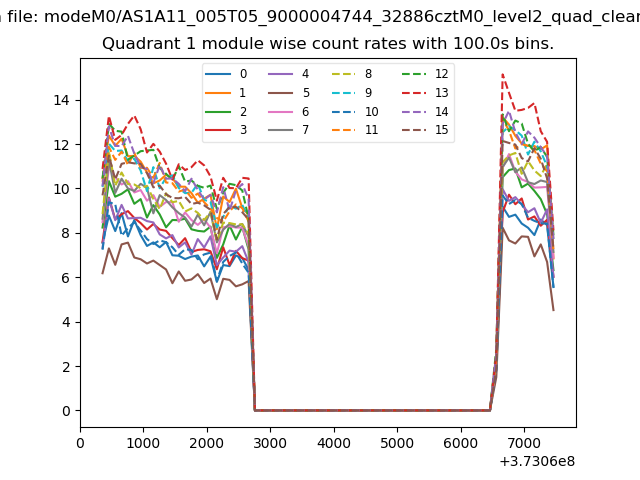
| Module-wise count rates for Quadrant A Data is divided into 100 sec bins |
 |
 |
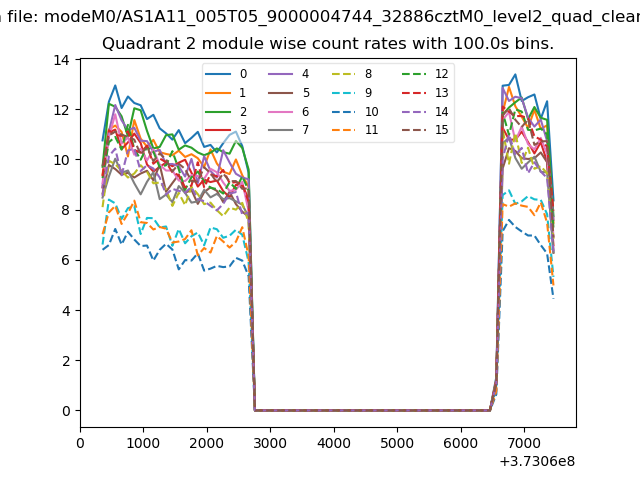
| Module-wise count rates for Quadrant B Data is divided into 100 sec bins |
 |
 |
| Module-wise count rates for Quadrant C Data is divided into 100 sec bins |
 |
 |
| Module-wise count rates for Quadrant D Data is divided into 100 sec bins |
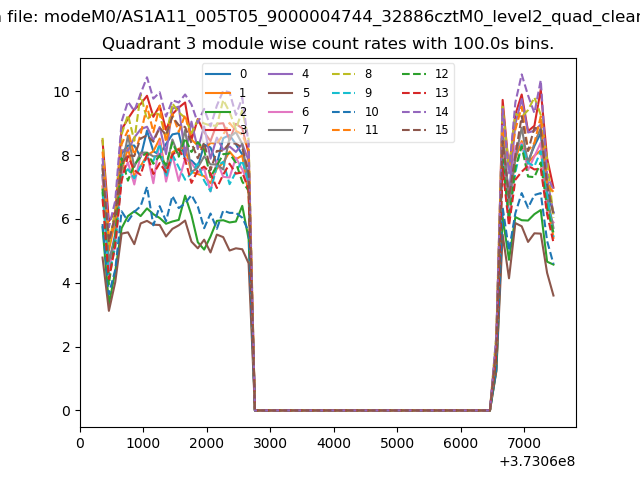 |
 |
| Parameter | Plot |
|---|---|
| CZT HV Monitor | 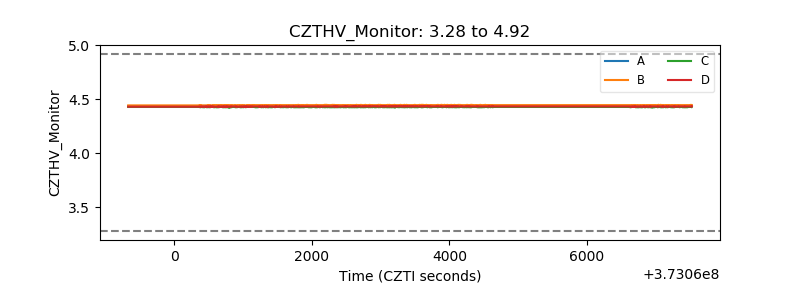 |
| D_VDD | 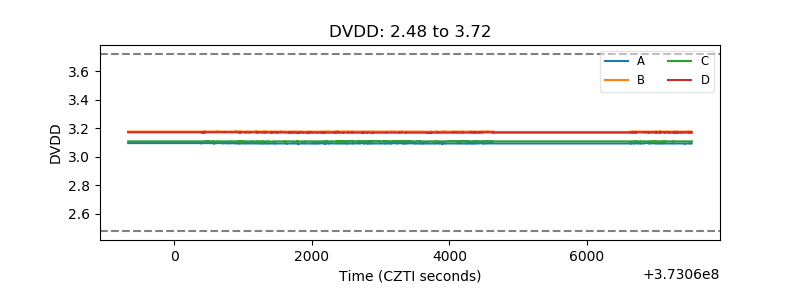 |
| Temperature 1 | 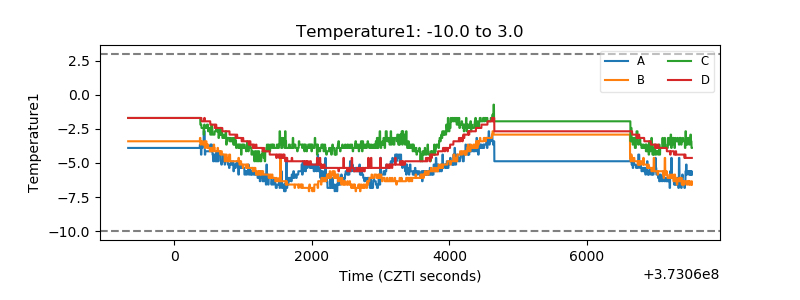 |
| Veto HV Monitor | 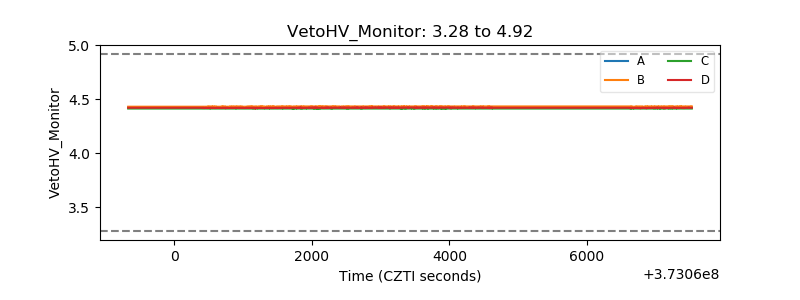 |
| Veto LLD | 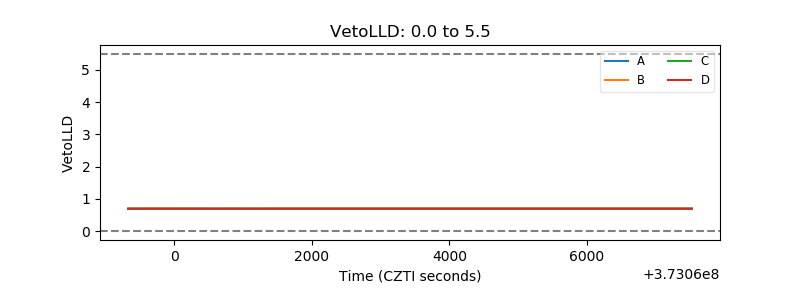 |
| Alpha Counter | 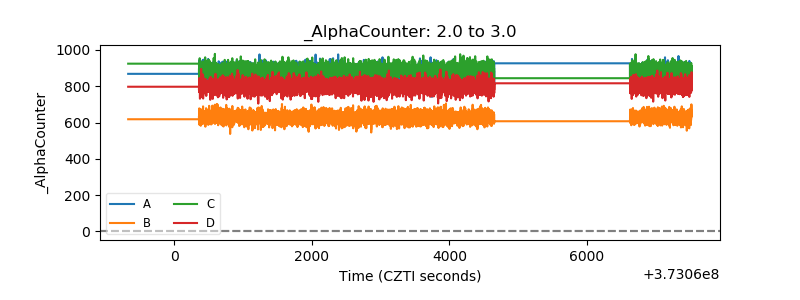 |
| _CPM_Rate | 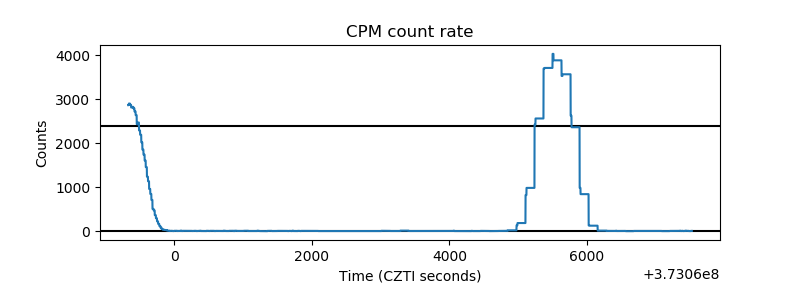 |
| CZT Counter | 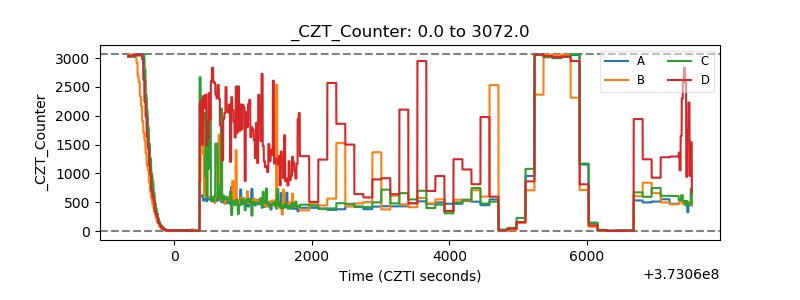 |
| +2.5 Volts monitor |  |
| +5 Volts monitor |  |
| _ROLL_ROT | 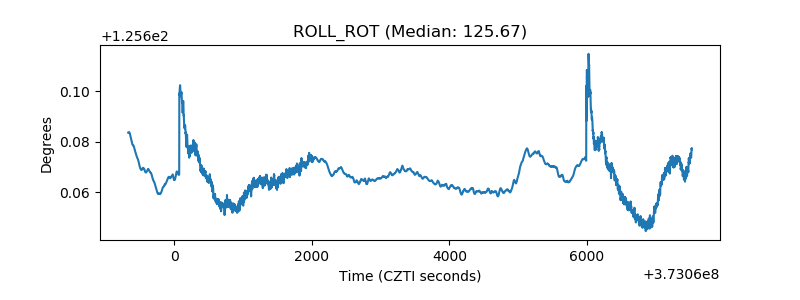 |
| _Roll_DEC | 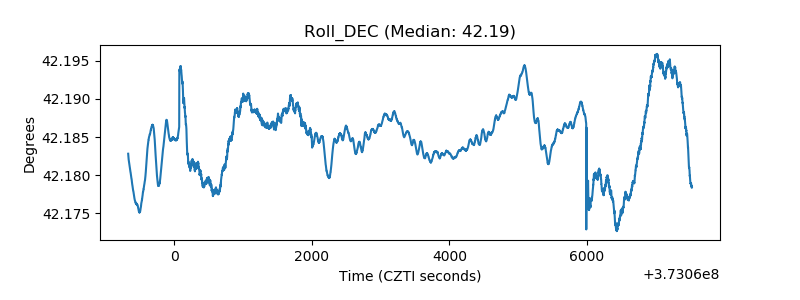 |
| _Roll_RA | 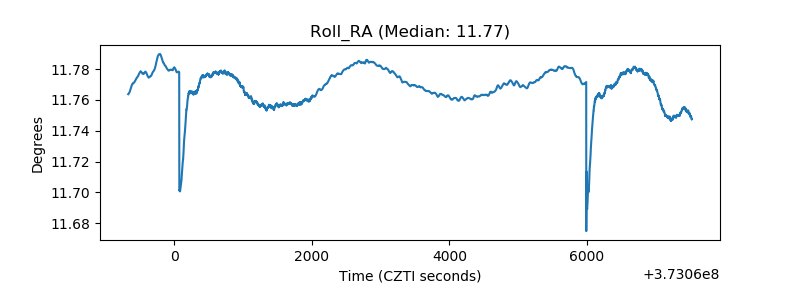 |
| Veto Counter | 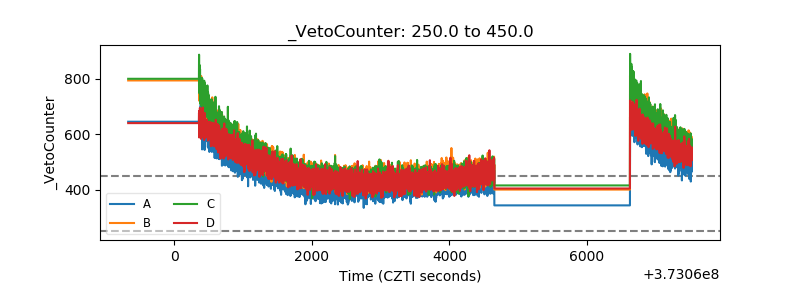 |