| Param | Original file | Final file |
|---|---|---|
| Filename | modeM0/AS1A11_005T05_9000004744_32887cztM0_level2.evt | modeM0/AS1A11_005T05_9000004744_32887cztM0_level2_quad_clean.evt |
| Size (bytes) | 440,118,720 | 68,785,920 |
| Size | 419.7 MB | 65.6 MB |
| Events in quadrant A | 2,376,495 | 448,050 |
| Events in quadrant B | 3,162,521 | 456,806 |
| Events in quadrant C | 2,732,122 | 450,707 |
| Events in quadrant D | 4,724,099 | 382,331 |
| Mode SS | |||
|---|---|---|---|
| Quadrant | BADHDUFLAG | Total packets | Discarded packets |
| A | 0 | 100 | 0 |
| B | 0 | 100 | 0 |
| C | 0 | 100 | 0 |
| D | 0 | 100 | 0 |
| Mode M9 | |||
|---|---|---|---|
| Quadrant | BADHDUFLAG | Total packets | Discarded packets |
| A | 0 | 28 | 1 |
| B | 0 | 28 | 0 |
| C | 0 | 28 | 2 |
| D | 0 | 29 | 0 |
| Mode M0 | |||
|---|---|---|---|
| Quadrant | BADHDUFLAG | Total packets | Discarded packets |
| A | 0 | 10032 | 37 |
| B | 0 | 12364 | 21 |
| C | 0 | 11138 | 40 |
| D | 0 | 17702 | 112 |
| Quadrant | Total seconds | Saturated seconds | Saturation percentage |
|---|---|---|---|
| A | 4913 | 6 | 0.122125% |
| B | 4920 | 234 | 4.756098% |
| C | 4920 | 91 | 1.849593% |
| D | 4910 | 534 | 10.875764% |
Noise dominated data is calculated using 1-second bins in cleaned event files. If a bin has >2000 counts, and if more than 50% of those come from <1% of pixels, then it is considered to be noise-dominated and hence unusable.
| Quadrant | # 1 sec bins | Bins with >0 counts | Bins with >2000 counts | High rate bins dominated by noise | Noise dominated (total time) | Noise dominated (detector-on time) | Marked lightcurve |
|---|---|---|---|---|---|---|---|
| A | 6993 | 4930 | 0 | 0 | 0.00% | 0.00% | 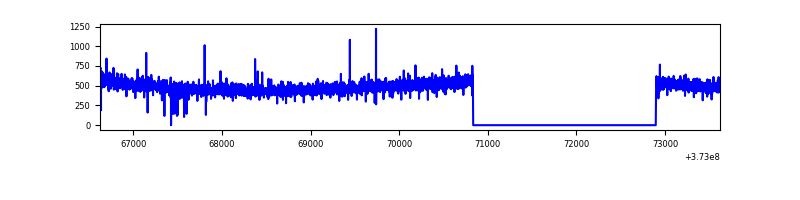 |
| B | 6993 | 4931 | 140 | 140 | 2.00% | 2.84% | 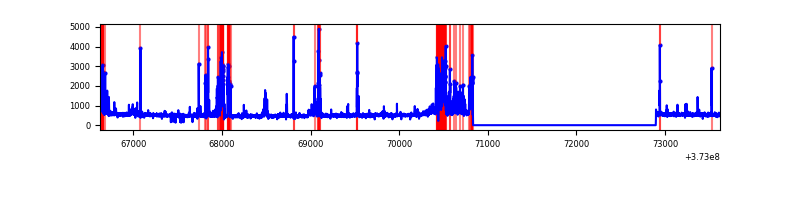 |
| C | 6993 | 4929 | 76 | 76 | 1.09% | 1.54% | 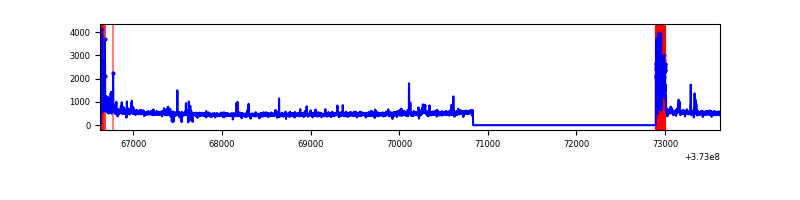 |
| D | 6993 | 4928 | 423 | 423 | 6.05% | 8.58% | 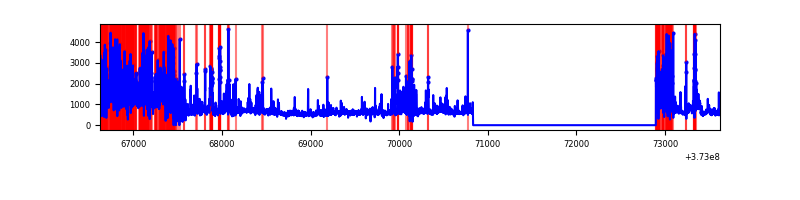 |
Top three noisy pixels from each quadrant. If the there are fewer than three noisy pixels in the level2.evt file, extra rows are filled as -1
| Pixel properties | Quadrant properties | ||||||
|---|---|---|---|---|---|---|---|
| Quadrant | DetID | PixID | Counts | Sigma | Mean | Median | Sigma |
| A | 13 | 254 | 8800 | 67.26 | 613 | 604 | 121.9 |
| A | 3 | 137 | 5420 | 39.52 | 613 | 604 | 121.9 |
| A | 0 | 226 | 5137 | 37.2 | 613 | 604 | 121.9 |
| B | 5 | 172 | 569775 | 5059.64 | 611 | 598 | 112.5 |
| B | 0 | 219 | 41260 | 361.46 | 611 | 598 | 112.5 |
| B | 15 | 85 | 41163 | 360.6 | 611 | 598 | 112.5 |
| C | 0 | 10 | 317276 | 2296.04 | 600 | 606 | 137.9 |
| C | 3 | 233 | 25846 | 183.0 | 600 | 606 | 137.9 |
| C | 15 | 159 | 21032 | 148.1 | 600 | 606 | 137.9 |
| D | 12 | 218 | 986558 | 6863.98 | 559 | 547 | 143.7 |
| D | 8 | 195 | 753768 | 5243.44 | 559 | 547 | 143.7 |
| D | 2 | 250 | 147813 | 1025.17 | 559 | 547 | 143.7 |
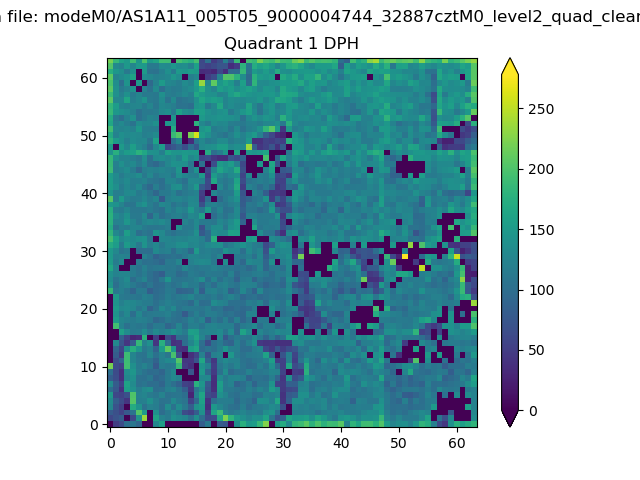
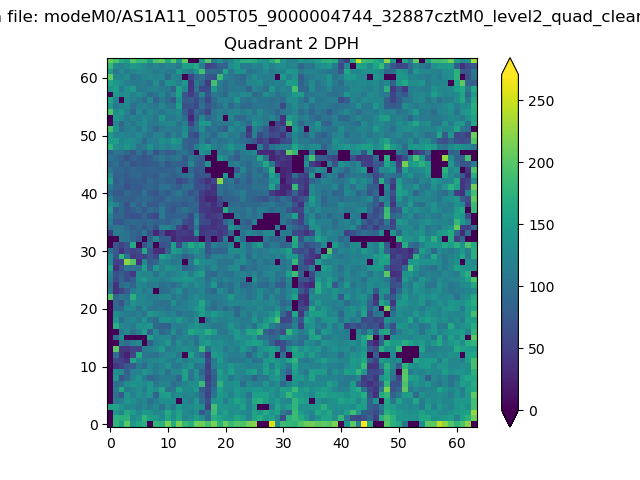
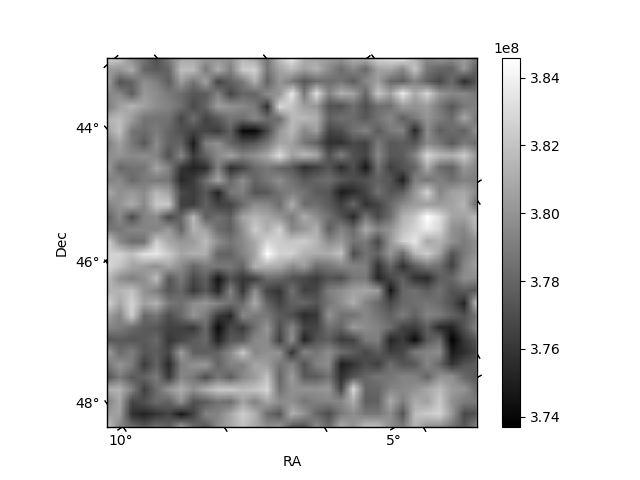
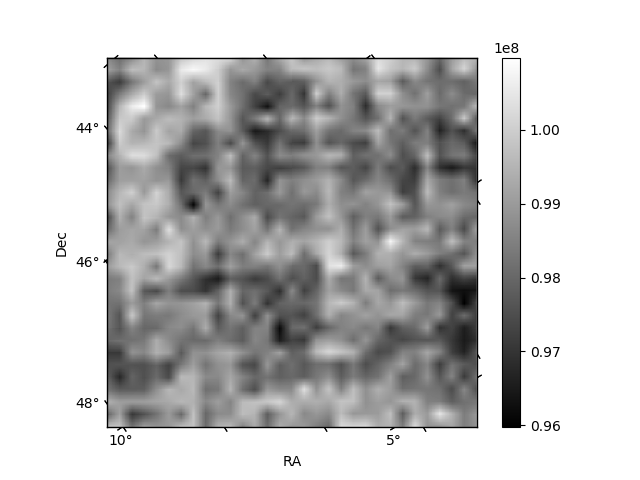
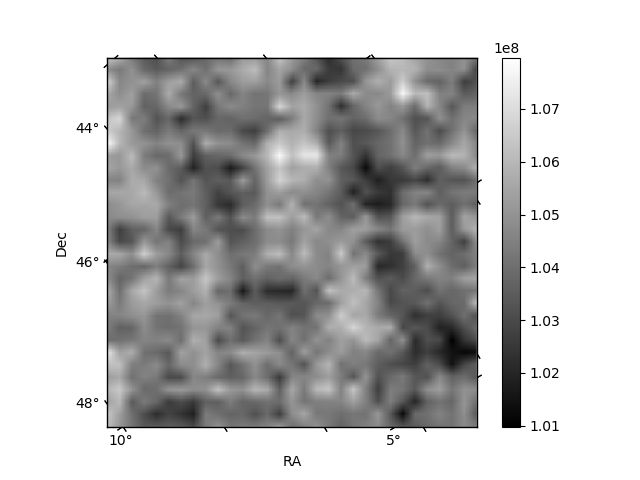
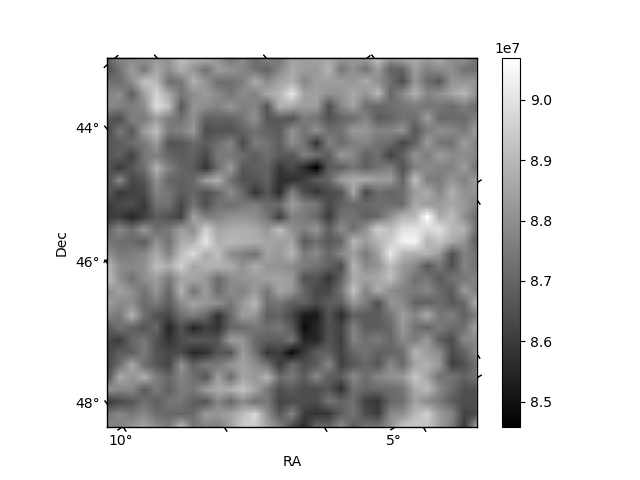
Histogram calculated using DETX and DETY for each event in the final _common_clean file
| Quadrant A |  |
 |
Quadrant B |
|---|---|---|---|
| Quadrant D | 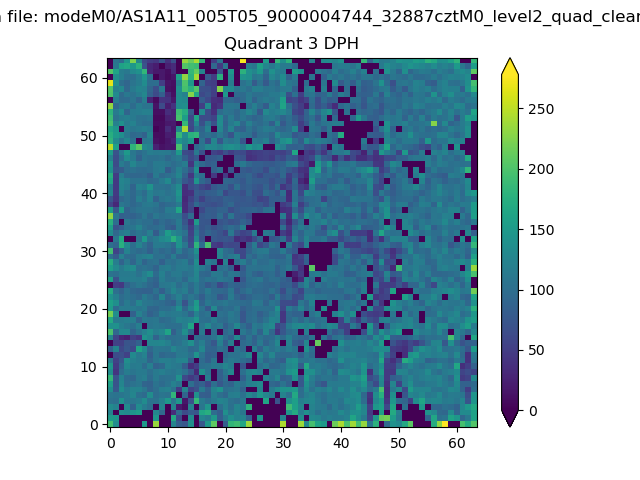 |
 |
Quadrant C |
| Plot type | Count rate plots | Images |
|---|---|---|
| Comparison with Poisson distribution Blue bars denote a histogram of data divided into 1 sec bins. Red curve is a Poisson curve with rate = median count rate of data. |
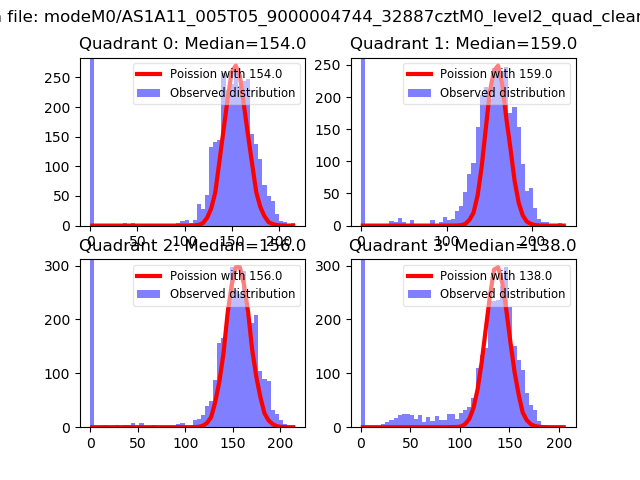 |
 |
| Quadrant-wise count rates Data is divided into 100 sec bins |
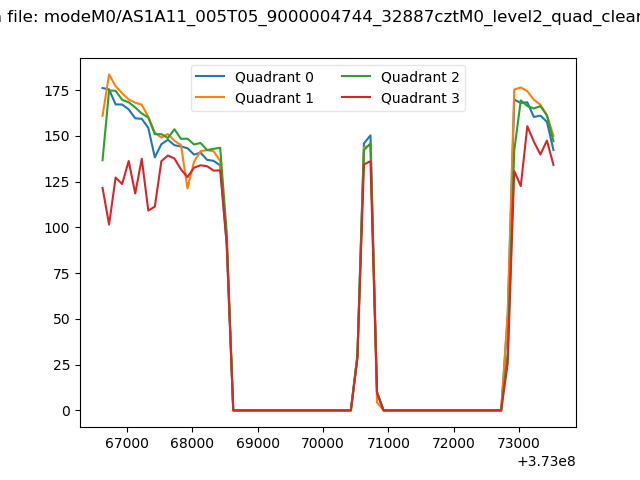 |
|
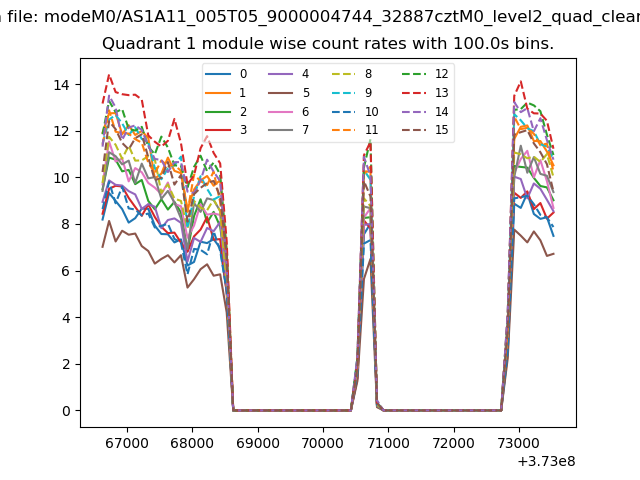
| Module-wise count rates for Quadrant A Data is divided into 100 sec bins |
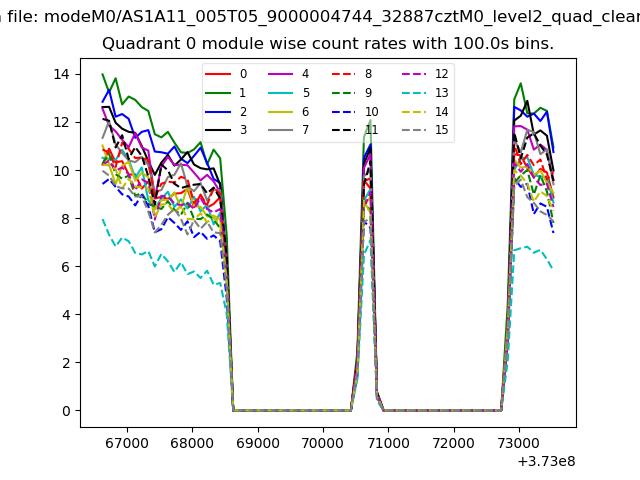 |
 |
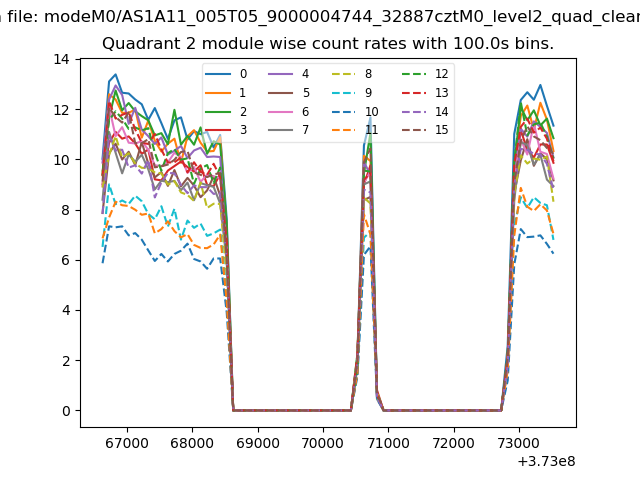
| Module-wise count rates for Quadrant B Data is divided into 100 sec bins |
 |
 |
| Module-wise count rates for Quadrant C Data is divided into 100 sec bins |
 |
 |
| Module-wise count rates for Quadrant D Data is divided into 100 sec bins |
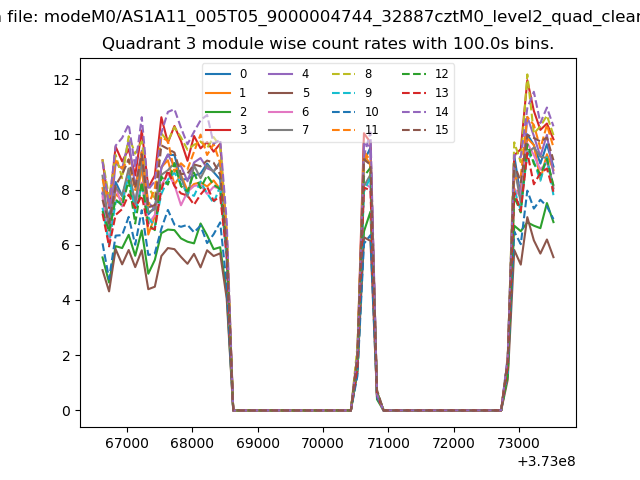 |
 |
| Parameter | Plot |
|---|---|
| CZT HV Monitor | 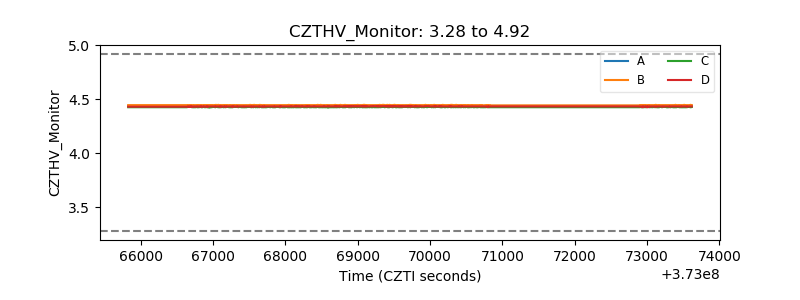 |
| D_VDD | 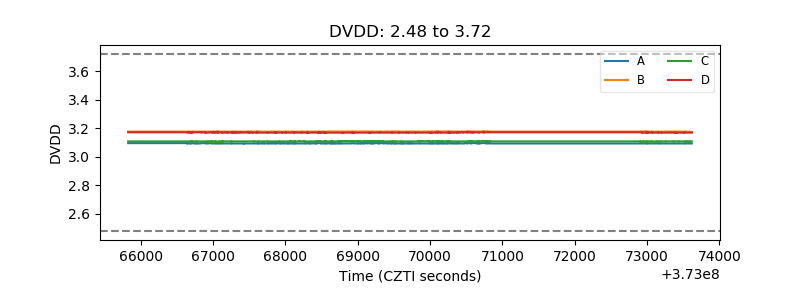 |
| Temperature 1 | 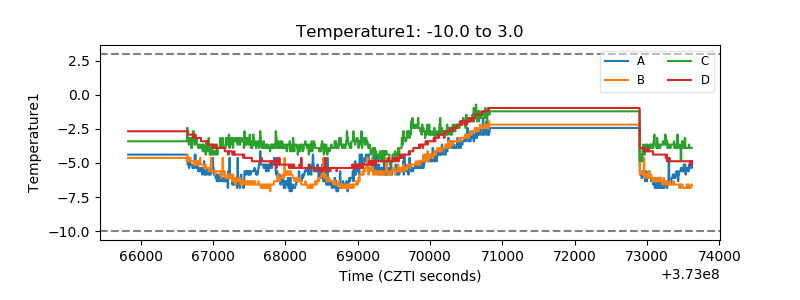 |
| Veto HV Monitor | 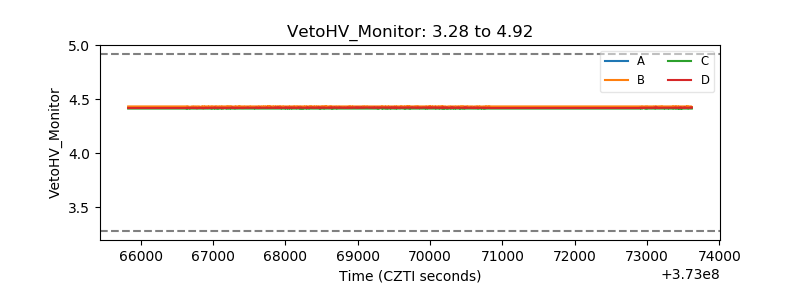 |
| Veto LLD | 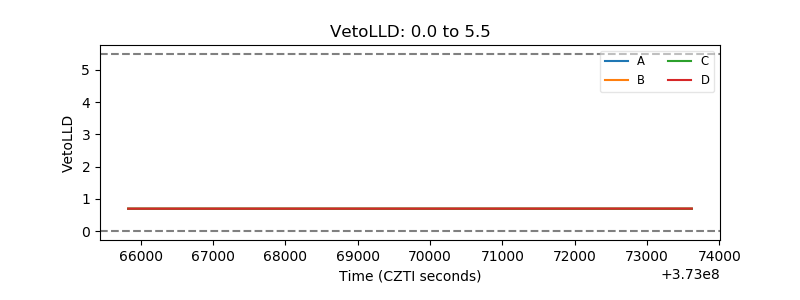 |
| Alpha Counter | 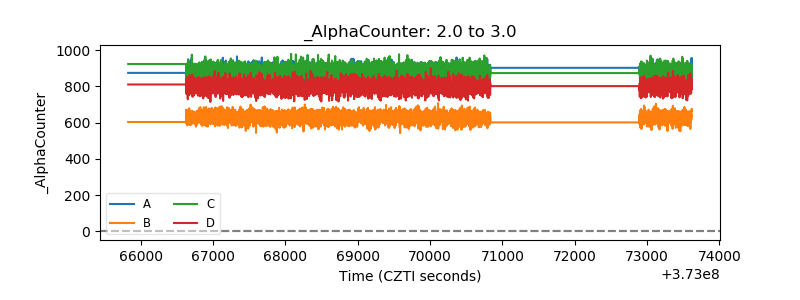 |
| _CPM_Rate | 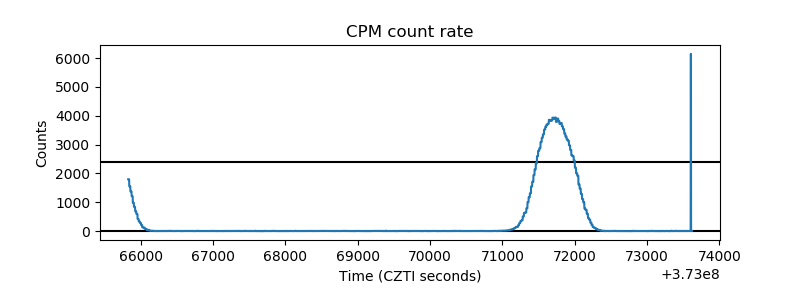 |
| CZT Counter | 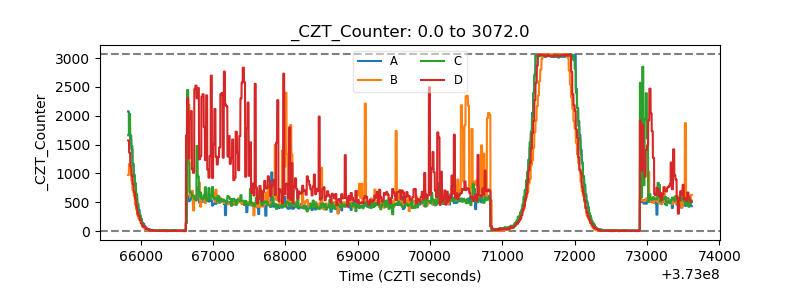 |
| +2.5 Volts monitor |  |
| +5 Volts monitor | 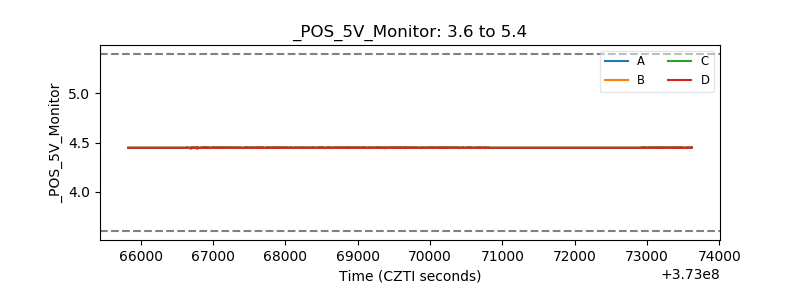 |
| _ROLL_ROT | 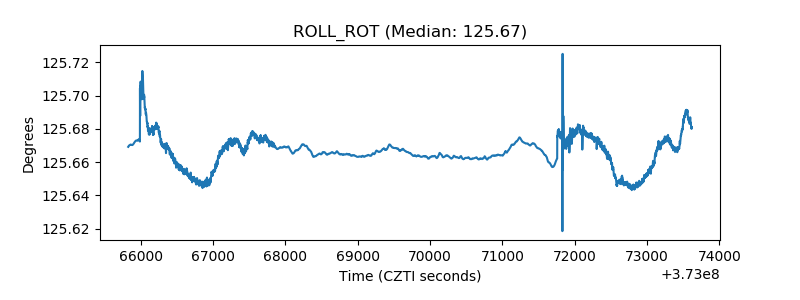 |
| _Roll_DEC | 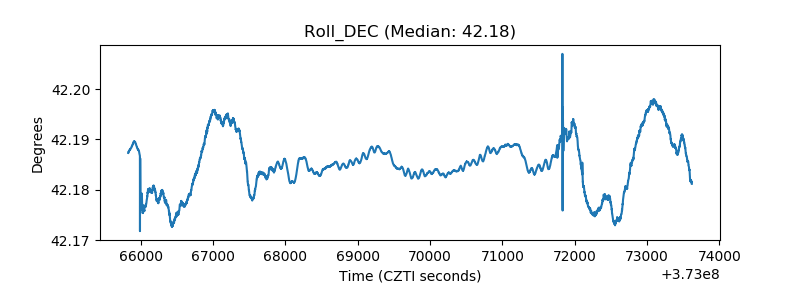 |
| _Roll_RA | 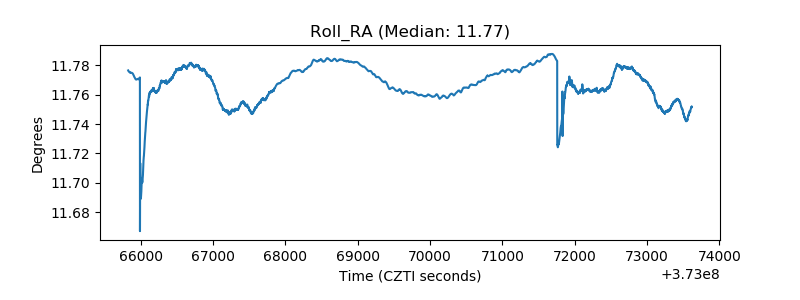 |
| Veto Counter | 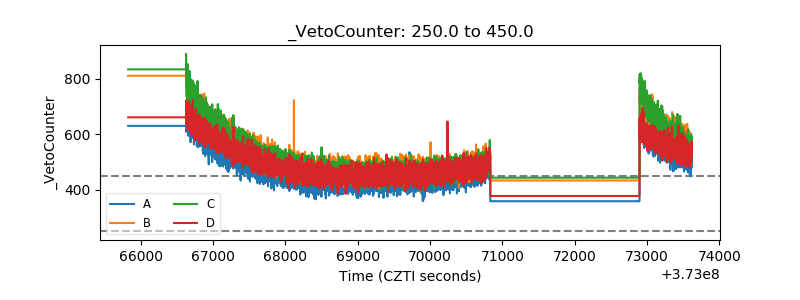 |