| Param | Original file | Final file |
|---|---|---|
| Filename | modeM0/AS1A11_005T05_9000004744_32888cztM0_level2.evt | modeM0/AS1A11_005T05_9000004744_32888cztM0_level2_quad_clean.evt |
| Size (bytes) | 382,515,840 | 53,953,920 |
| Size | 364.8 MB | 51.5 MB |
| Events in quadrant A | 2,088,345 | 352,008 |
| Events in quadrant B | 2,651,374 | 352,188 |
| Events in quadrant C | 2,404,275 | 344,666 |
| Events in quadrant D | 4,148,109 | 281,834 |
| Mode SS | |||
|---|---|---|---|
| Quadrant | BADHDUFLAG | Total packets | Discarded packets |
| A | 0 | 101 | 11 |
| B | 0 | 102 | 16 |
| C | 0 | 102 | 12 |
| D | 0 | 101 | 13 |
| Mode M9 | |||
|---|---|---|---|
| Quadrant | BADHDUFLAG | Total packets | Discarded packets |
| A | 0 | 34 | 7 |
| B | 0 | 34 | 4 |
| C | 0 | 36 | 7 |
| D | 0 | 34 | 3 |
| Mode M0 | |||
|---|---|---|---|
| Quadrant | BADHDUFLAG | Total packets | Discarded packets |
| A | 0 | 10131 | 1314 |
| B | 0 | 12130 | 1626 |
| C | 0 | 11356 | 1643 |
| D | 0 | 18008 | 2796 |
| Quadrant | Total seconds | Saturated seconds | Saturation percentage |
|---|---|---|---|
| A | 4330 | 5 | 0.115473% |
| B | 4306 | 144 | 3.344171% |
| C | 4299 | 88 | 2.046988% |
| D | 4234 | 485 | 11.454889% |
Noise dominated data is calculated using 1-second bins in cleaned event files. If a bin has >2000 counts, and if more than 50% of those come from <1% of pixels, then it is considered to be noise-dominated and hence unusable.
| Quadrant | # 1 sec bins | Bins with >0 counts | Bins with >2000 counts | High rate bins dominated by noise | Noise dominated (total time) | Noise dominated (detector-on time) | Marked lightcurve |
|---|---|---|---|---|---|---|---|
| A | 7115 | 4501 | 0 | 0 | 0.00% | 0.00% | 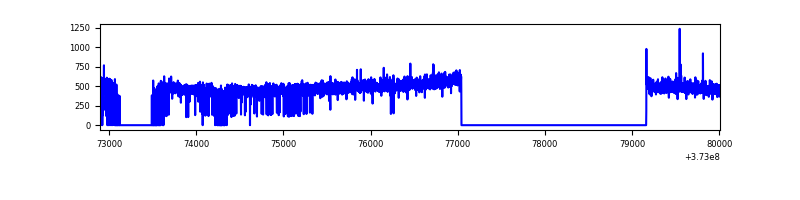 |
| B | 7115 | 4485 | 85 | 85 | 1.19% | 1.90% | 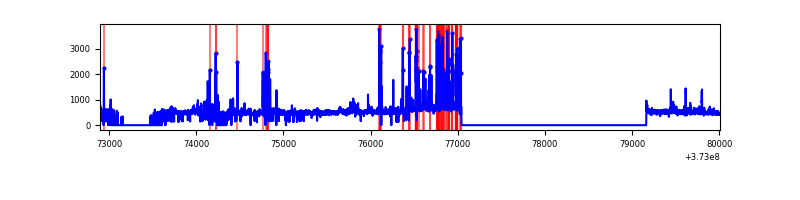 |
| C | 7115 | 4466 | 63 | 63 | 0.89% | 1.41% | 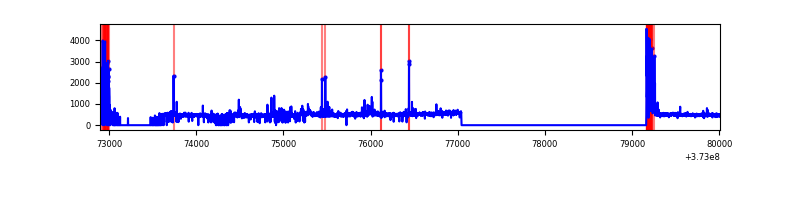 |
| D | 7115 | 4424 | 379 | 379 | 5.33% | 8.57% | 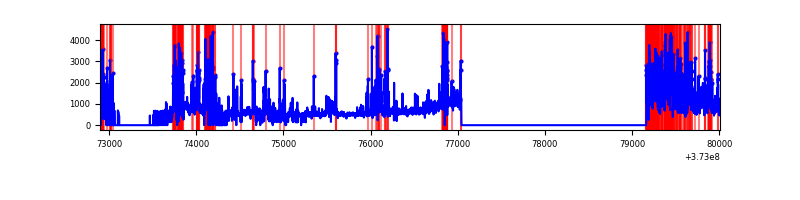 |
Top three noisy pixels from each quadrant. If the there are fewer than three noisy pixels in the level2.evt file, extra rows are filled as -1
| Pixel properties | Quadrant properties | ||||||
|---|---|---|---|---|---|---|---|
| Quadrant | DetID | PixID | Counts | Sigma | Mean | Median | Sigma |
| A | 13 | 254 | 7775 | 67.91 | 536 | 526 | 106.7 |
| A | 13 | 6 | 5236 | 44.12 | 536 | 526 | 106.7 |
| A | 3 | 137 | 4606 | 38.22 | 536 | 526 | 106.7 |
| B | 5 | 172 | 390137 | 3918.55 | 531 | 521 | 99.4 |
| B | 0 | 183 | 45651 | 453.89 | 531 | 521 | 99.4 |
| B | 0 | 230 | 31051 | 307.05 | 531 | 521 | 99.4 |
| C | 0 | 10 | 274746 | 2320.08 | 514 | 519 | 118.2 |
| C | 1 | 241 | 54081 | 453.16 | 514 | 519 | 118.2 |
| C | 14 | 67 | 43594 | 364.43 | 514 | 519 | 118.2 |
| D | 12 | 218 | 834711 | 6960.17 | 470 | 460 | 119.9 |
| D | 2 | 250 | 595611 | 4965.35 | 470 | 460 | 119.9 |
| D | 8 | 195 | 530279 | 4420.29 | 470 | 460 | 119.9 |
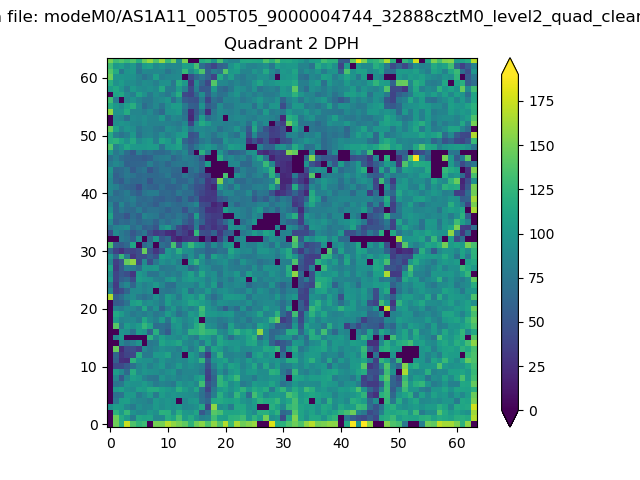
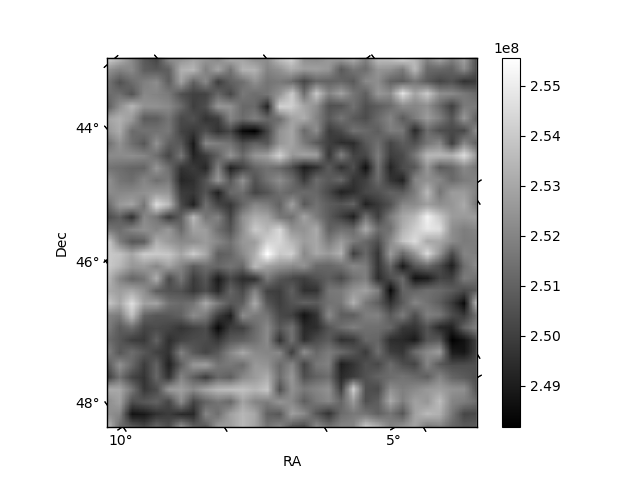
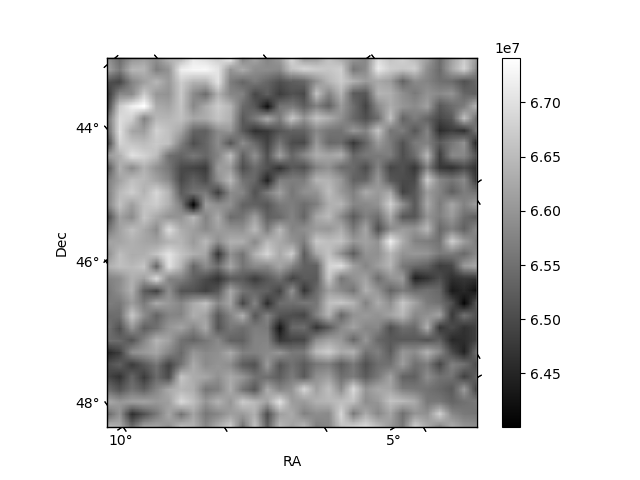
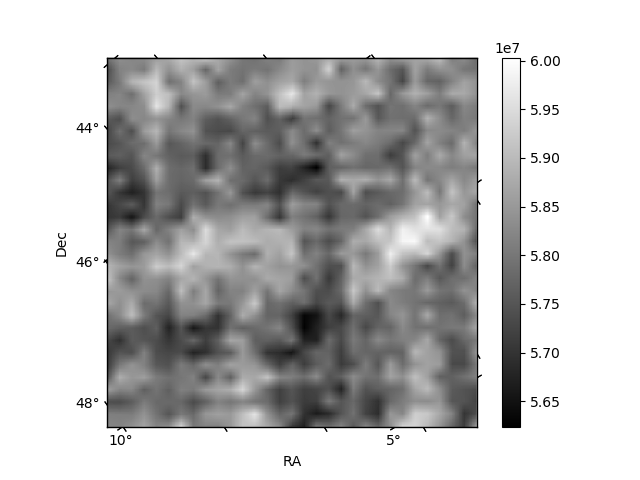
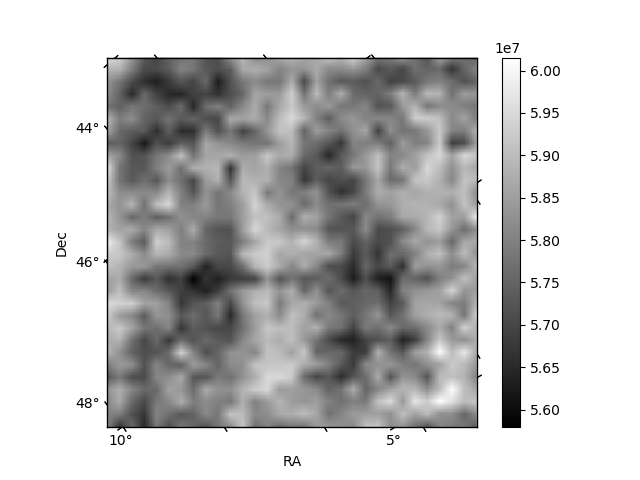
Histogram calculated using DETX and DETY for each event in the final _common_clean file
| Quadrant A | 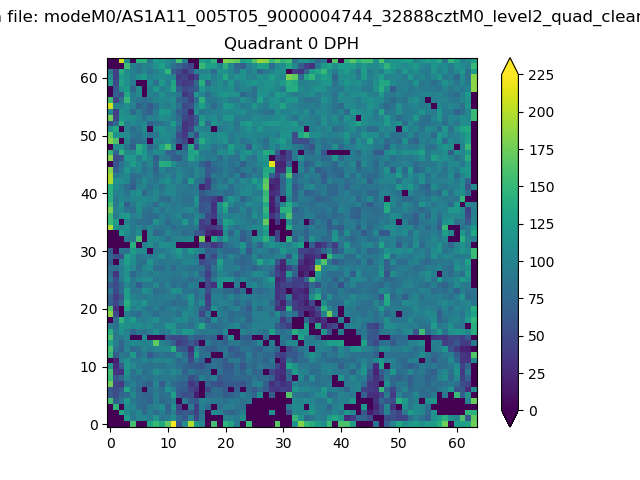 |
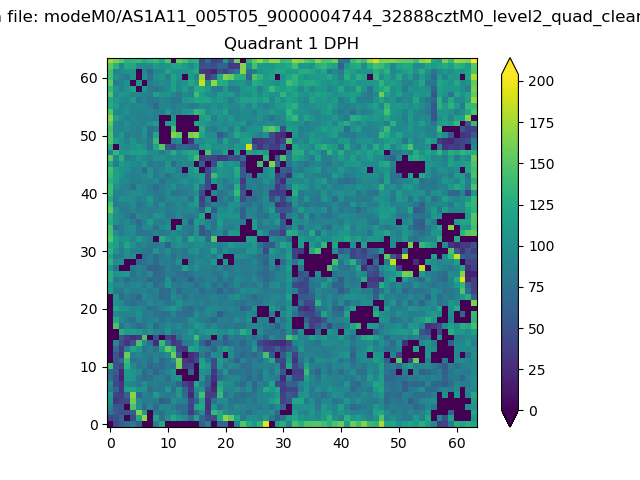 |
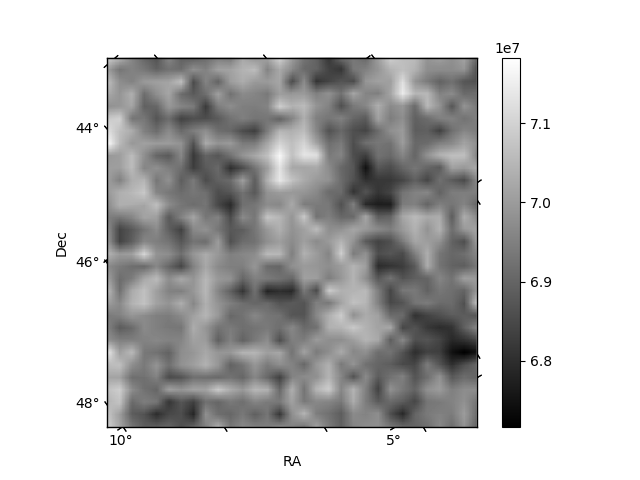
Quadrant B |
|---|---|---|---|
| Quadrant D | 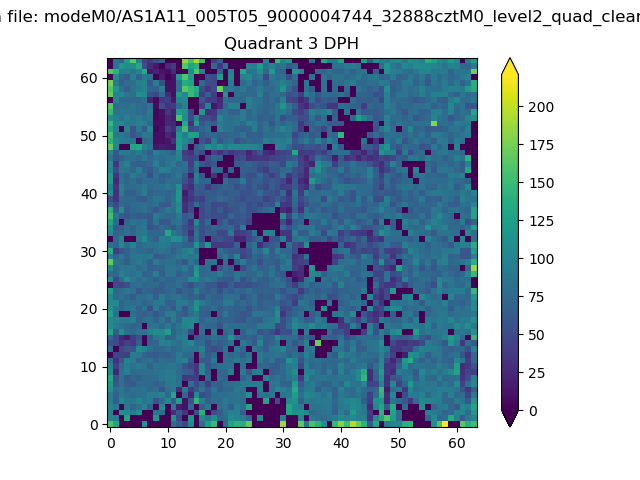 |
 |
Quadrant C |
| Plot type | Count rate plots | Images |
|---|---|---|
| Comparison with Poisson distribution Blue bars denote a histogram of data divided into 1 sec bins. Red curve is a Poisson curve with rate = median count rate of data. |
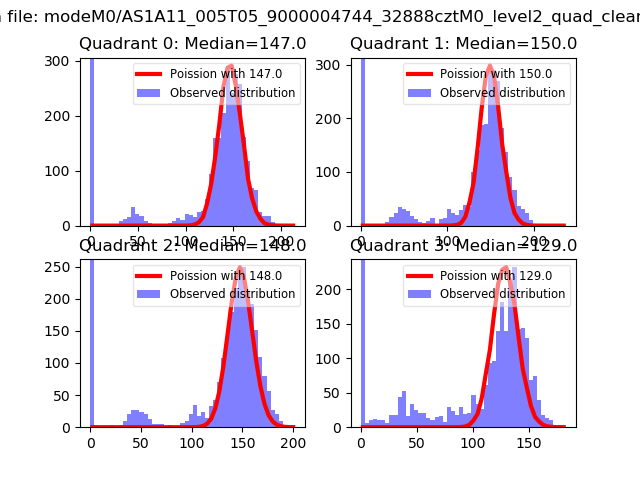 |
 |
| Quadrant-wise count rates Data is divided into 100 sec bins |
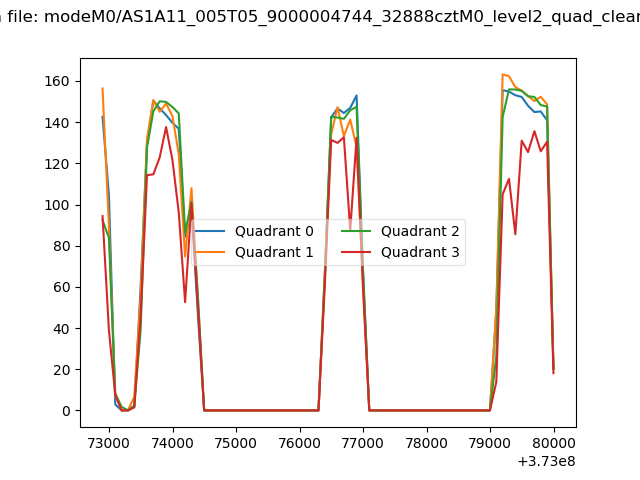 |
|
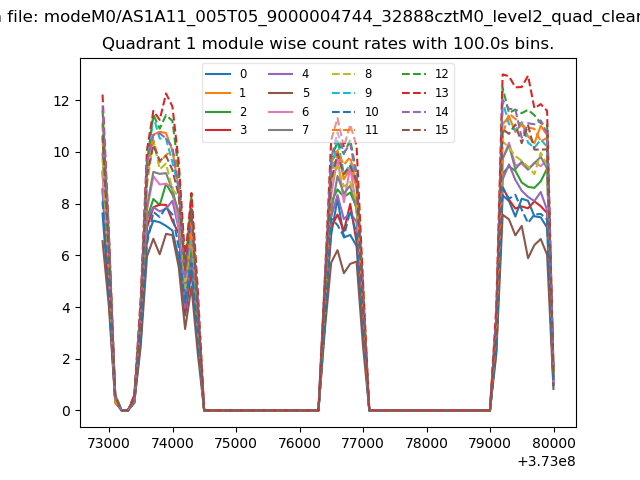
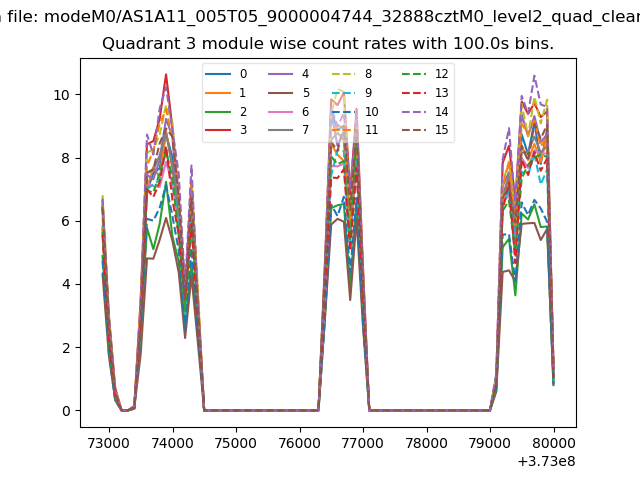
| Module-wise count rates for Quadrant A Data is divided into 100 sec bins |
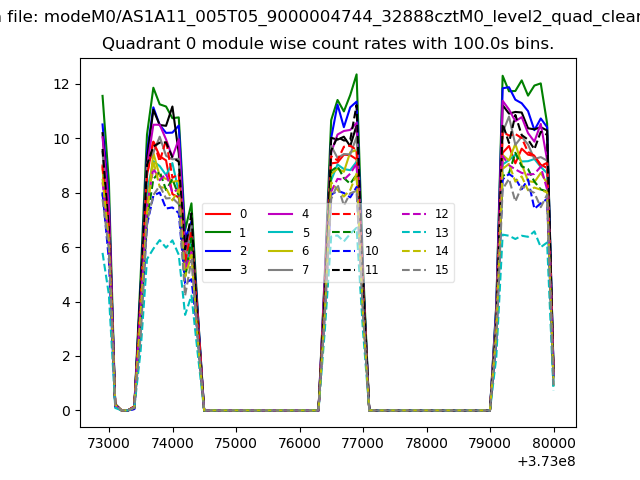 |
 |
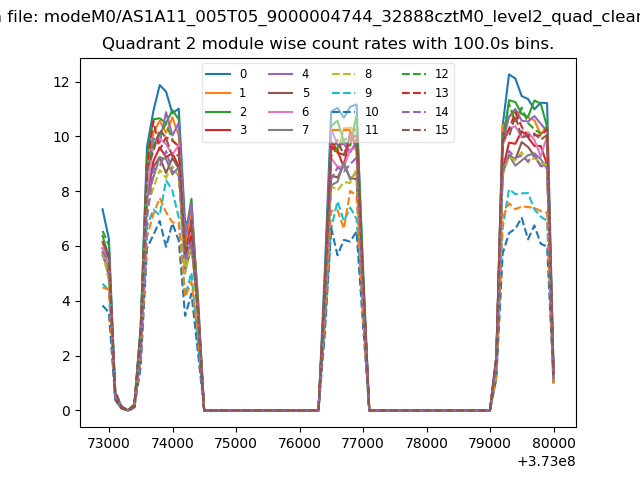
| Module-wise count rates for Quadrant B Data is divided into 100 sec bins |
 |
 |
| Module-wise count rates for Quadrant C Data is divided into 100 sec bins |
 |
 |
| Module-wise count rates for Quadrant D Data is divided into 100 sec bins |
 |
 |
| Parameter | Plot |
|---|---|
| CZT HV Monitor | 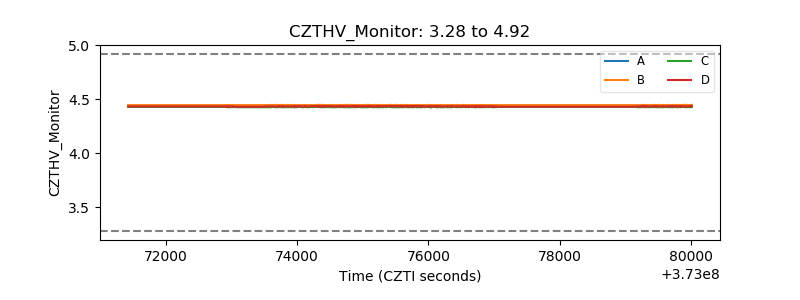 |
| D_VDD | 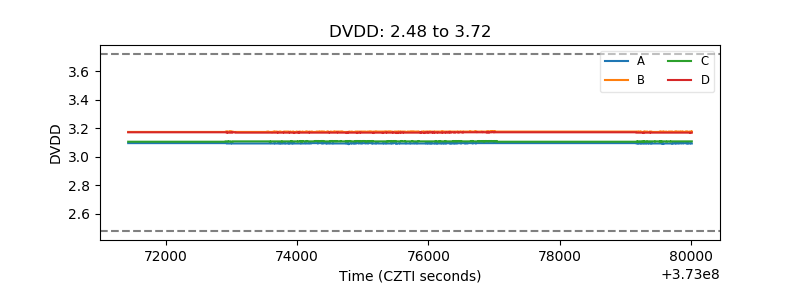 |
| Temperature 1 | 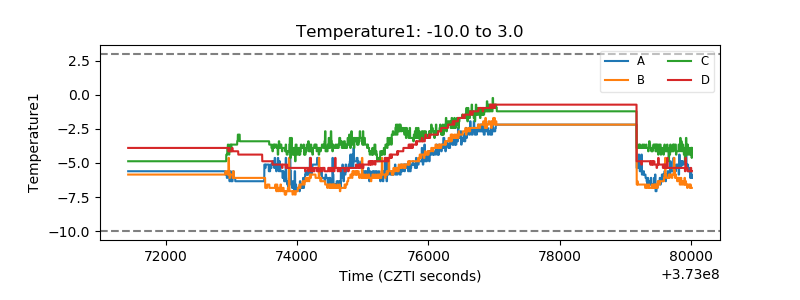 |
| Veto HV Monitor | 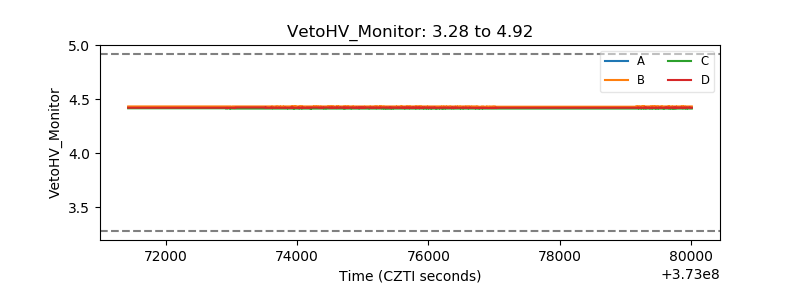 |
| Veto LLD | 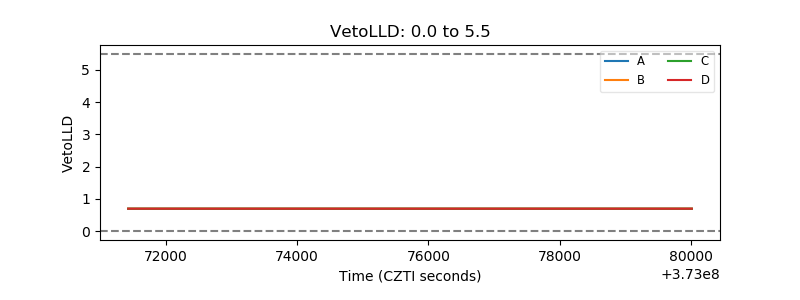 |
| Alpha Counter | 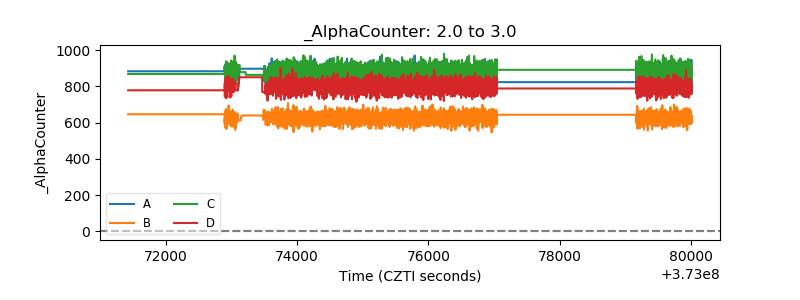 |
| _CPM_Rate | 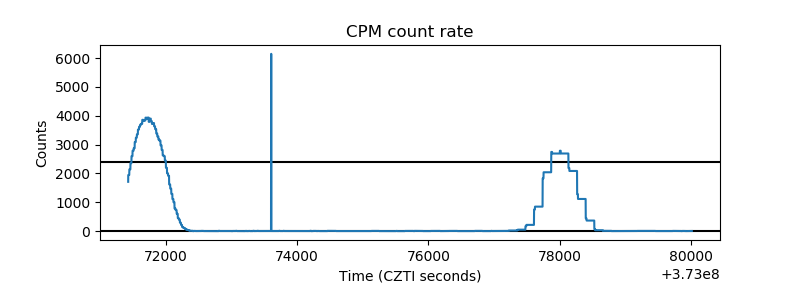 |
| CZT Counter | 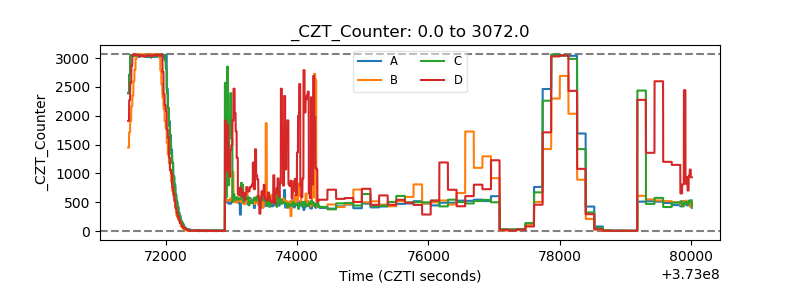 |
| +2.5 Volts monitor |  |
| +5 Volts monitor |  |
| _ROLL_ROT | 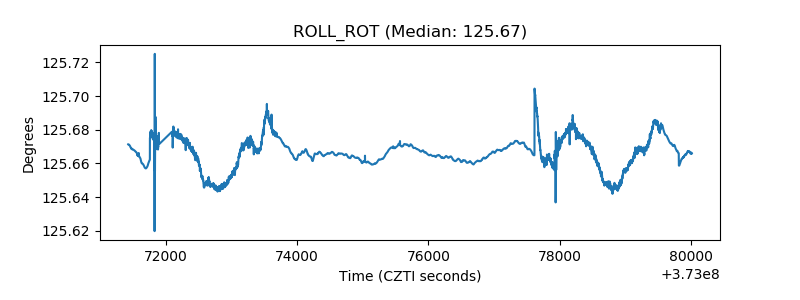 |
| _Roll_DEC |  |
| _Roll_RA | 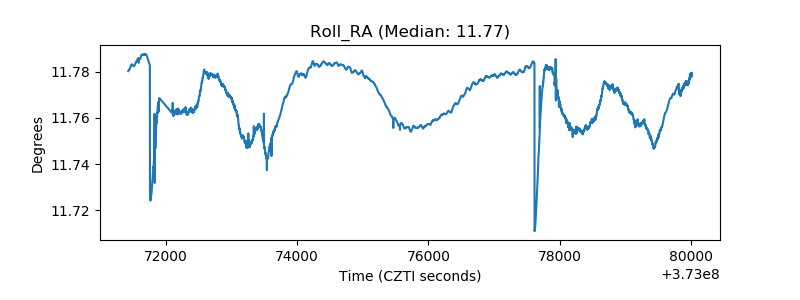 |
| Veto Counter | 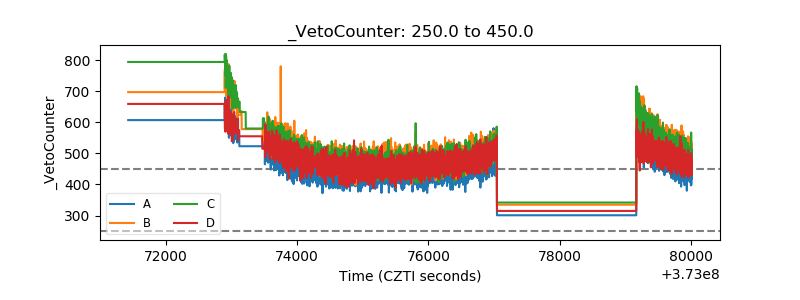 |