| Param | Original file | Final file |
|---|---|---|
| Filename | modeM0/AS1A11_005T05_9000004744_32890cztM0_level2.evt | modeM0/AS1A11_005T05_9000004744_32890cztM0_level2_quad_clean.evt |
| Size (bytes) | 1,221,877,440 | 153,472,320 |
| Size | 1.1 GB | 146.4 MB |
| Events in quadrant A | 7,107,155 | 970,514 |
| Events in quadrant B | 8,321,944 | 978,622 |
| Events in quadrant C | 6,957,224 | 975,791 |
| Events in quadrant D | 13,713,055 | 794,561 |
| Mode SS | |||
|---|---|---|---|
| Quadrant | BADHDUFLAG | Total packets | Discarded packets |
| A | 0 | 274 | 0 |
| B | 0 | 274 | 0 |
| C | 0 | 274 | 0 |
| D | 0 | 274 | 0 |
| Mode M9 | |||
|---|---|---|---|
| Quadrant | BADHDUFLAG | Total packets | Discarded packets |
| A | 0 | 68 | 0 |
| B | 0 | 68 | 0 |
| C | 0 | 68 | 0 |
| D | 0 | 69 | 0 |
| Mode M0 | |||
|---|---|---|---|
| Quadrant | BADHDUFLAG | Total packets | Discarded packets |
| A | 0 | 29570 | 5 |
| B | 0 | 33035 | 4 |
| C | 0 | 29006 | 4 |
| D | 0 | 50056 | 4 |
| Quadrant | Total seconds | Saturated seconds | Saturation percentage |
|---|---|---|---|
| A | 13428 | 33 | 0.245755% |
| B | 13428 | 495 | 3.686327% |
| C | 13428 | 134 | 0.997915% |
| D | 13428 | 1920 | 14.298481% |
Noise dominated data is calculated using 1-second bins in cleaned event files. If a bin has >2000 counts, and if more than 50% of those come from <1% of pixels, then it is considered to be noise-dominated and hence unusable.
| Quadrant | # 1 sec bins | Bins with >0 counts | Bins with >2000 counts | High rate bins dominated by noise | Noise dominated (total time) | Noise dominated (detector-on time) | Marked lightcurve |
|---|---|---|---|---|---|---|---|
| A | 19675 | 13431 | 0 | 0 | 0.00% | 0.00% | 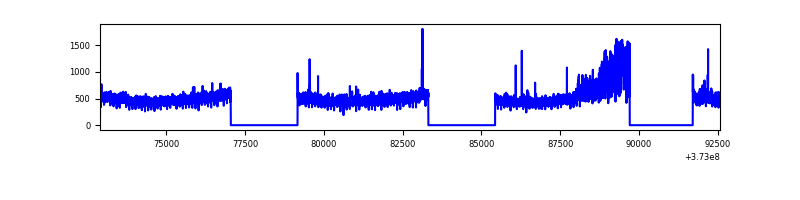 |
| B | 19675 | 13431 | 302 | 302 | 1.53% | 2.25% | 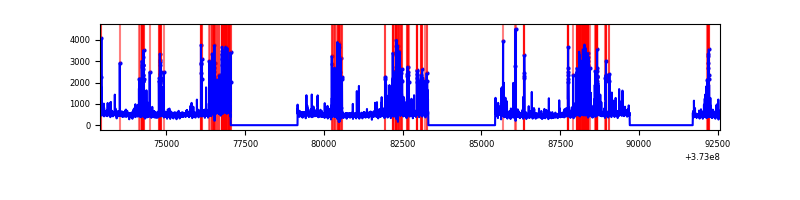 |
| C | 19675 | 13431 | 108 | 108 | 0.55% | 0.80% | 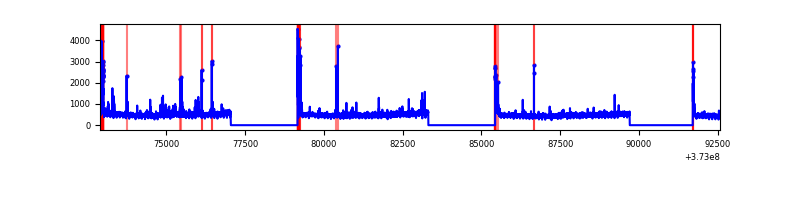 |
| D | 19675 | 13431 | 1494 | 1494 | 7.59% | 11.12% | 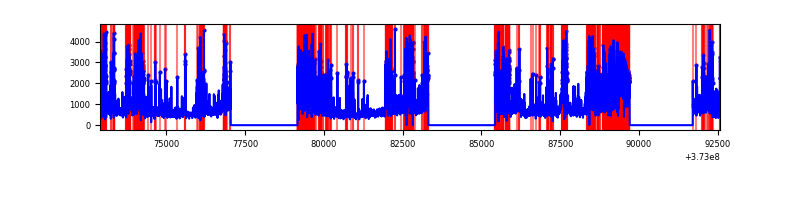 |
Top three noisy pixels from each quadrant. If the there are fewer than three noisy pixels in the level2.evt file, extra rows are filled as -1
| Pixel properties | Quadrant properties | ||||||
|---|---|---|---|---|---|---|---|
| Quadrant | DetID | PixID | Counts | Sigma | Mean | Median | Sigma |
| A | 14 | 63 | 751541 | 2325.29 | 1633 | 1603 | 322.5 |
| A | 13 | 254 | 25002 | 72.55 | 1633 | 1603 | 322.5 |
| A | 13 | 6 | 22359 | 64.36 | 1633 | 1603 | 322.5 |
| B | 5 | 172 | 1447560 | 4796.4 | 1625 | 1589 | 301.5 |
| B | 0 | 219 | 130677 | 428.19 | 1625 | 1589 | 301.5 |
| B | 0 | 230 | 62809 | 203.07 | 1625 | 1589 | 301.5 |
| C | 0 | 10 | 483279 | 1339.1 | 1582 | 1598 | 359.7 |
| C | 14 | 67 | 146978 | 404.16 | 1582 | 1598 | 359.7 |
| C | 1 | 241 | 88582 | 241.82 | 1582 | 1598 | 359.7 |
| D | 2 | 250 | 2352332 | 6408.68 | 1453 | 1420 | 366.8 |
| D | 12 | 218 | 2260443 | 6158.18 | 1453 | 1420 | 366.8 |
| D | 8 | 195 | 2191485 | 5970.2 | 1453 | 1420 | 366.8 |
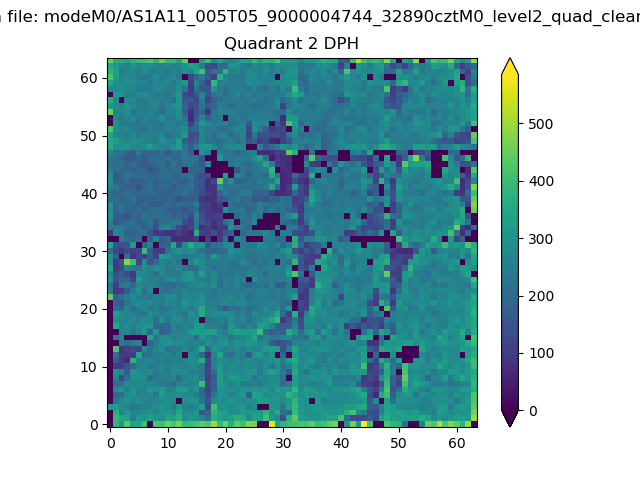
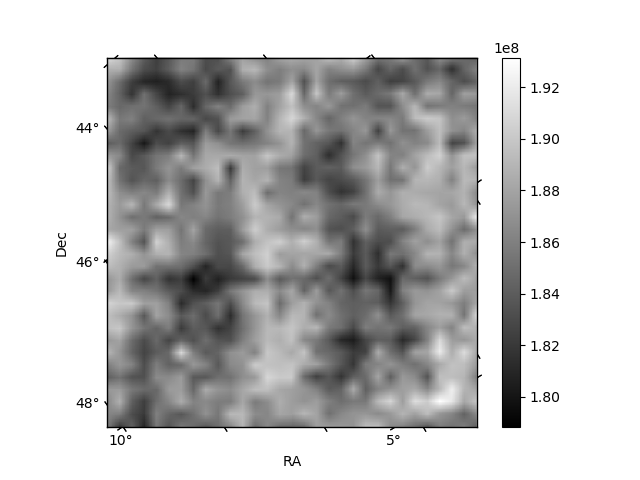
Histogram calculated using DETX and DETY for each event in the final _common_clean file
| Quadrant A | 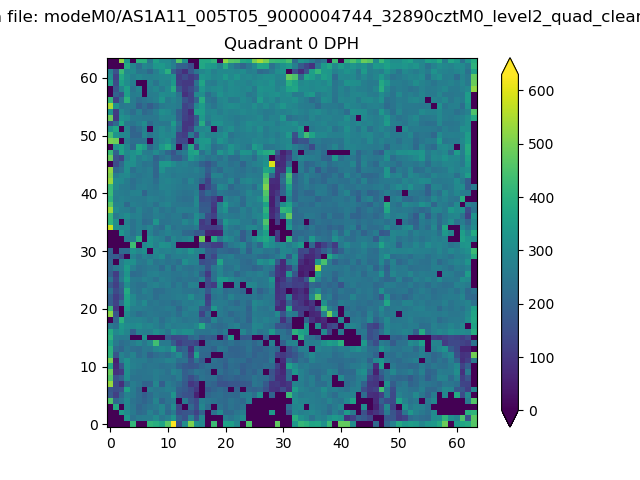 |
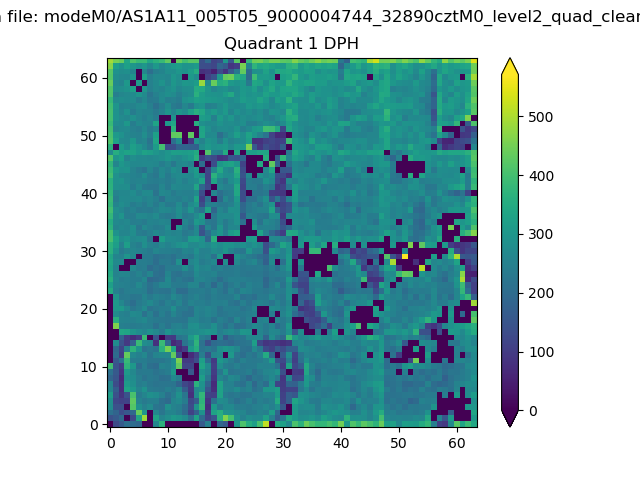 |
Quadrant B |
|---|---|---|---|
| Quadrant D | 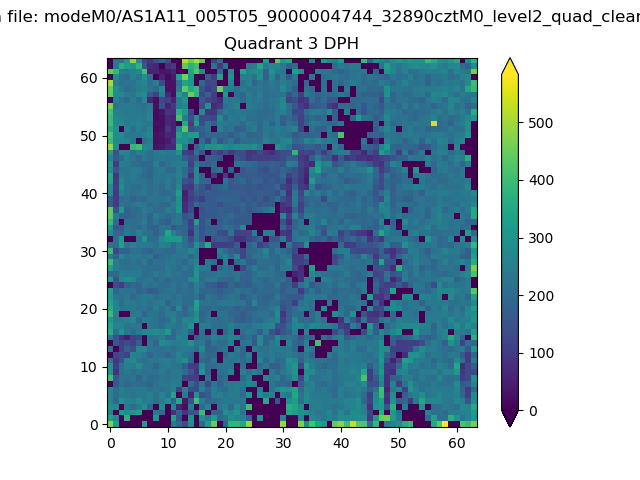 |
 |
Quadrant C |
| Plot type | Count rate plots | Images |
|---|---|---|
| Comparison with Poisson distribution Blue bars denote a histogram of data divided into 1 sec bins. Red curve is a Poisson curve with rate = median count rate of data. |
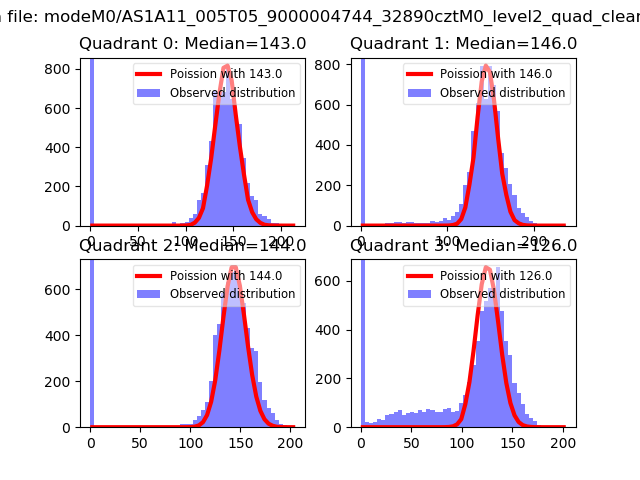 |
 |
| Quadrant-wise count rates Data is divided into 100 sec bins |
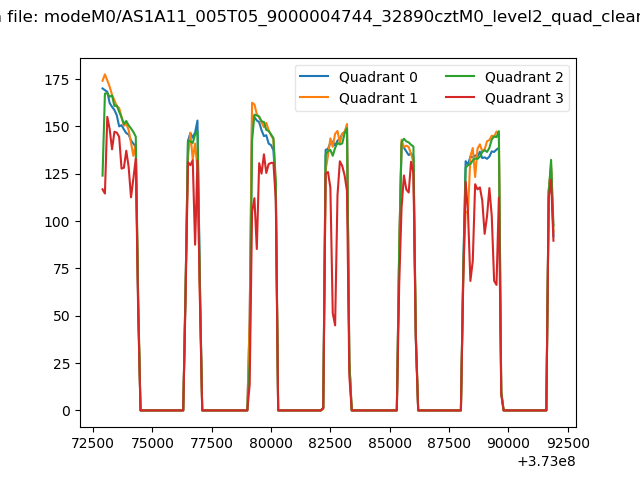 |
|
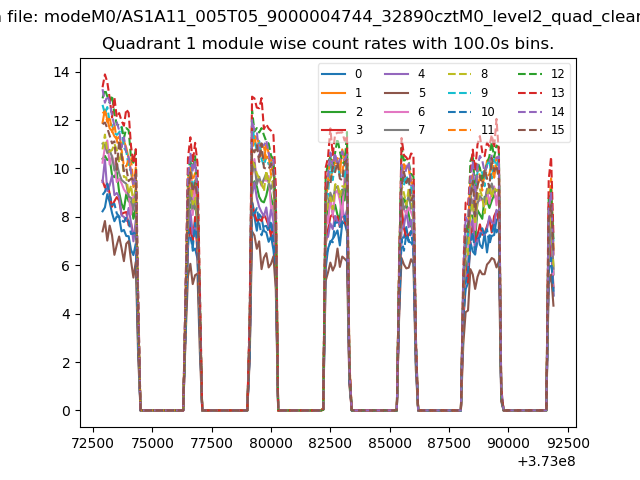
| Module-wise count rates for Quadrant A Data is divided into 100 sec bins |
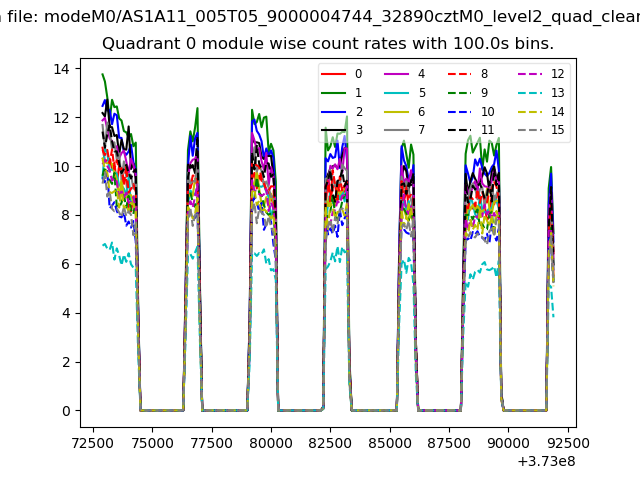 |
 |
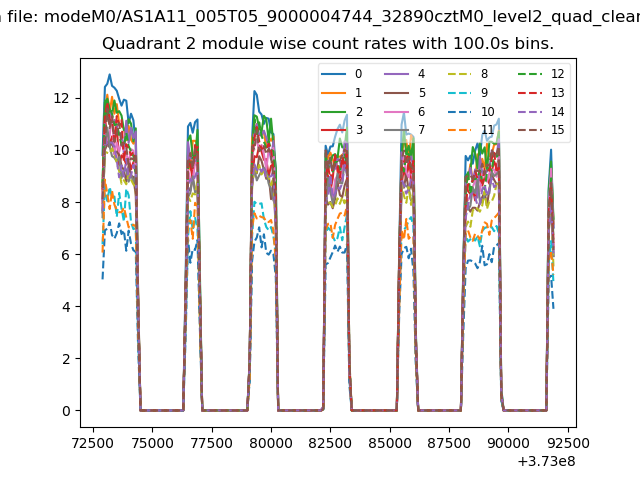
| Module-wise count rates for Quadrant B Data is divided into 100 sec bins |
 |
 |
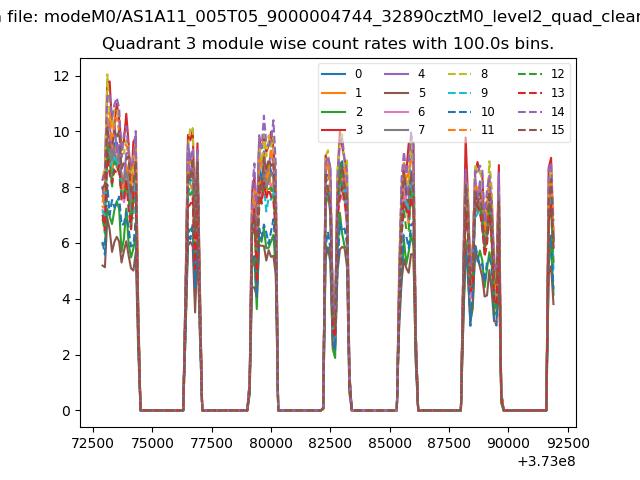
| Module-wise count rates for Quadrant C Data is divided into 100 sec bins |
 |
 |
| Module-wise count rates for Quadrant D Data is divided into 100 sec bins |
 |
 |
| Parameter | Plot |
|---|---|
| CZT HV Monitor | 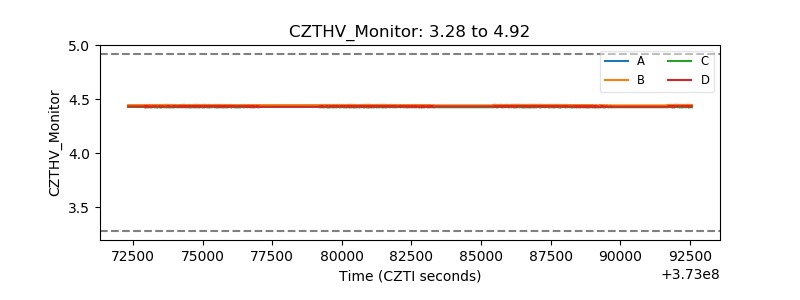 |
| D_VDD |  |
| Temperature 1 | 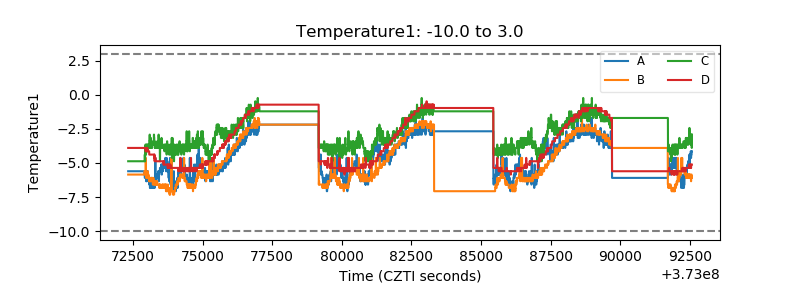 |
| Veto HV Monitor | 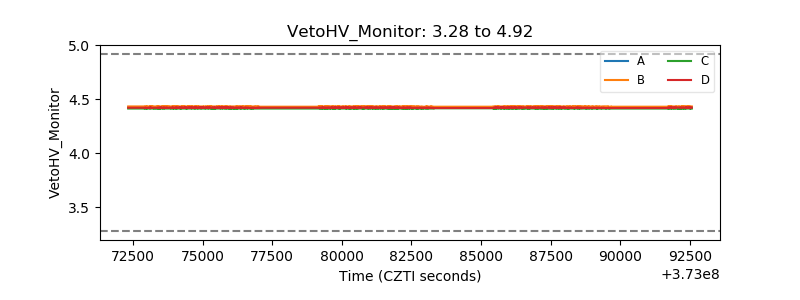 |
| Veto LLD | 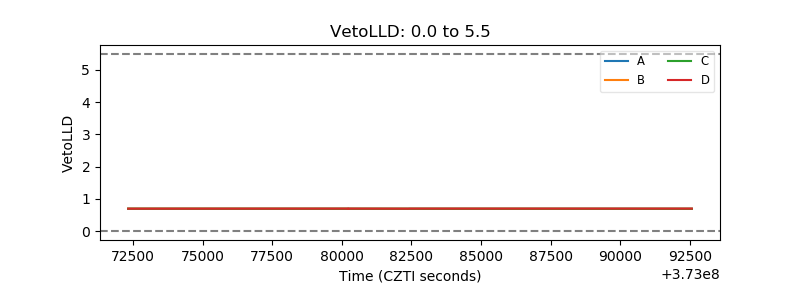 |
| Alpha Counter | 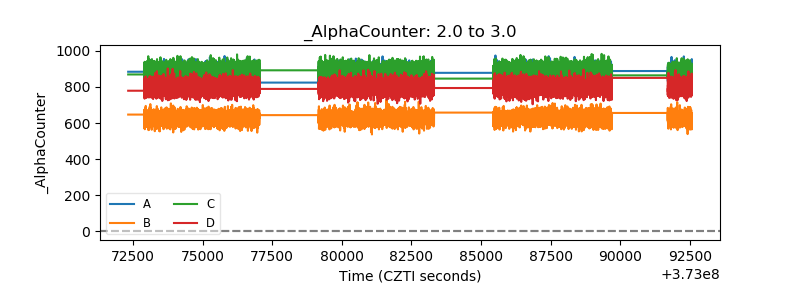 |
| _CPM_Rate | 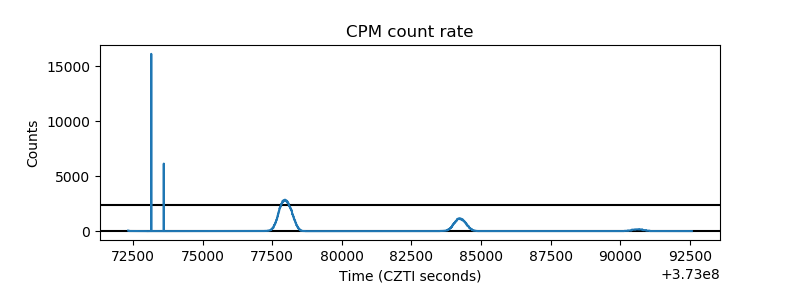 |
| CZT Counter | 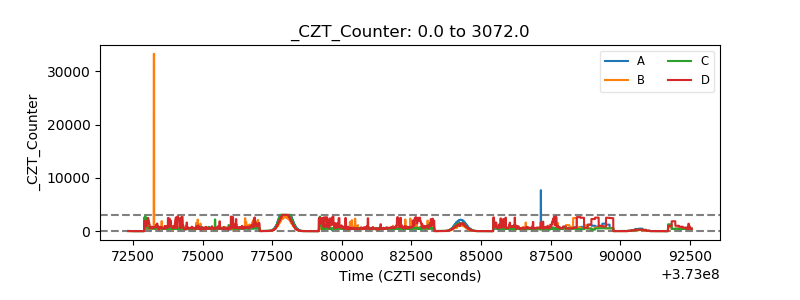 |
| +2.5 Volts monitor |  |
| +5 Volts monitor |  |
| _ROLL_ROT | 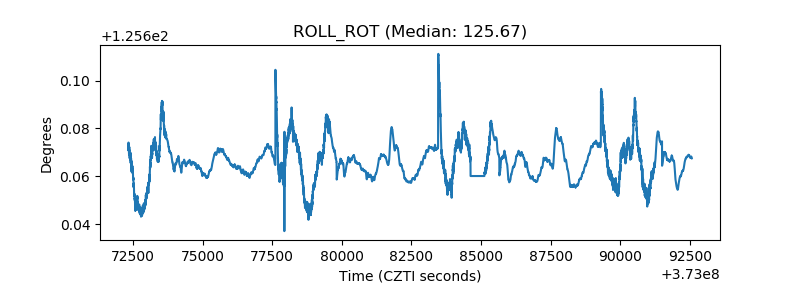 |
| _Roll_DEC | 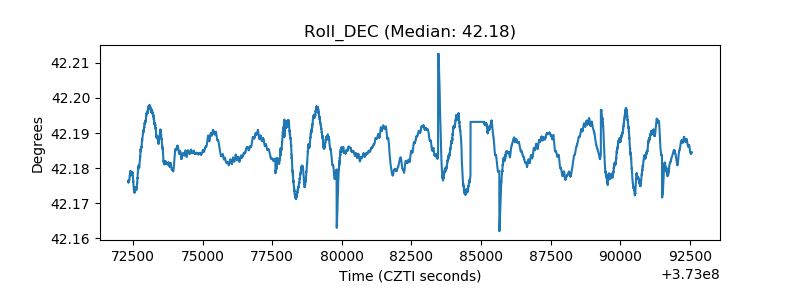 |
| _Roll_RA |  |
| Veto Counter | 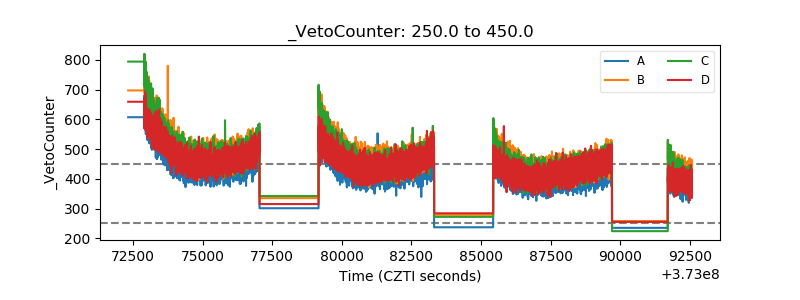 |