| Param | Original file | Final file |
|---|---|---|
| Filename | modeM0/AS1A11_005T05_9000004744_32891cztM0_level2.evt | modeM0/AS1A11_005T05_9000004744_32891cztM0_level2_quad_clean.evt |
| Size (bytes) | 572,195,520 | 63,348,480 |
| Size | 545.7 MB | 60.4 MB |
| Events in quadrant A | 3,926,921 | 389,230 |
| Events in quadrant B | 3,347,781 | 400,774 |
| Events in quadrant C | 2,897,592 | 397,716 |
| Events in quadrant D | 6,765,931 | 326,014 |
| Mode SS | |||
|---|---|---|---|
| Quadrant | BADHDUFLAG | Total packets | Discarded packets |
| A | 0 | 120 | 0 |
| B | 0 | 120 | 0 |
| C | 0 | 120 | 0 |
| D | 0 | 120 | 0 |
| Mode M9 | |||
|---|---|---|---|
| Quadrant | BADHDUFLAG | Total packets | Discarded packets |
| A | 0 | 37 | 0 |
| B | 0 | 37 | 0 |
| C | 0 | 37 | 0 |
| D | 0 | 37 | 0 |
| Mode M0 | |||
|---|---|---|---|
| Quadrant | BADHDUFLAG | Total packets | Discarded packets |
| A | 0 | 15384 | 3 |
| B | 0 | 13558 | 2 |
| C | 0 | 12194 | 2 |
| D | 0 | 24079 | 2 |
| Quadrant | Total seconds | Saturated seconds | Saturation percentage |
|---|---|---|---|
| A | 5775 | 25 | 0.432900% |
| B | 5775 | 177 | 3.064935% |
| C | 5775 | 36 | 0.623377% |
| D | 5775 | 837 | 14.493506% |
Noise dominated data is calculated using 1-second bins in cleaned event files. If a bin has >2000 counts, and if more than 50% of those come from <1% of pixels, then it is considered to be noise-dominated and hence unusable.
| Quadrant | # 1 sec bins | Bins with >0 counts | Bins with >2000 counts | High rate bins dominated by noise | Noise dominated (total time) | Noise dominated (detector-on time) | Marked lightcurve |
|---|---|---|---|---|---|---|---|
| A | 9451 | 5777 | 0 | 0 | 0.00% | 0.00% | 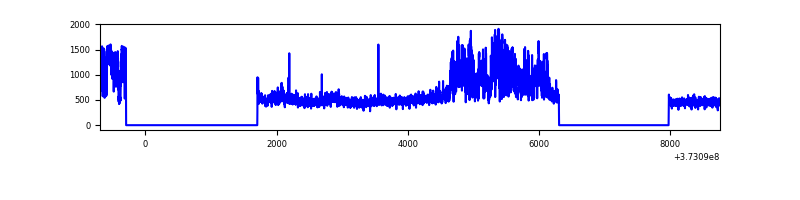 |
| B | 9451 | 5777 | 104 | 104 | 1.10% | 1.80% |  |
| C | 9451 | 5777 | 21 | 21 | 0.22% | 0.36% |  |
| D | 9451 | 5777 | 643 | 643 | 6.80% | 11.13% | 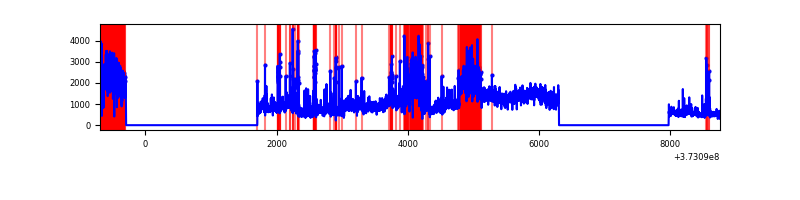 |
Top three noisy pixels from each quadrant. If the there are fewer than three noisy pixels in the level2.evt file, extra rows are filled as -1
| Pixel properties | Quadrant properties | ||||||
|---|---|---|---|---|---|---|---|
| Quadrant | DetID | PixID | Counts | Sigma | Mean | Median | Sigma |
| A | 14 | 63 | 1268910 | 9226.19 | 681 | 667 | 137.5 |
| A | 13 | 6 | 14282 | 99.05 | 681 | 667 | 137.5 |
| A | 13 | 254 | 10754 | 73.38 | 681 | 667 | 137.5 |
| B | 5 | 172 | 585286 | 4514.78 | 678 | 663 | 129.5 |
| B | 5 | 255 | 24157 | 181.43 | 678 | 663 | 129.5 |
| B | 0 | 219 | 18306 | 136.25 | 678 | 663 | 129.5 |
| C | 0 | 10 | 171882 | 1116.22 | 664 | 669 | 153.4 |
| C | 14 | 67 | 80571 | 520.92 | 664 | 669 | 153.4 |
| C | 7 | 247 | 11458 | 70.34 | 664 | 669 | 153.4 |
| D | 8 | 195 | 2283537 | 14303.32 | 618 | 602 | 159.6 |
| D | 12 | 218 | 895025 | 5603.85 | 618 | 602 | 159.6 |
| D | 12 | 33 | 230928 | 1443.07 | 618 | 602 | 159.6 |
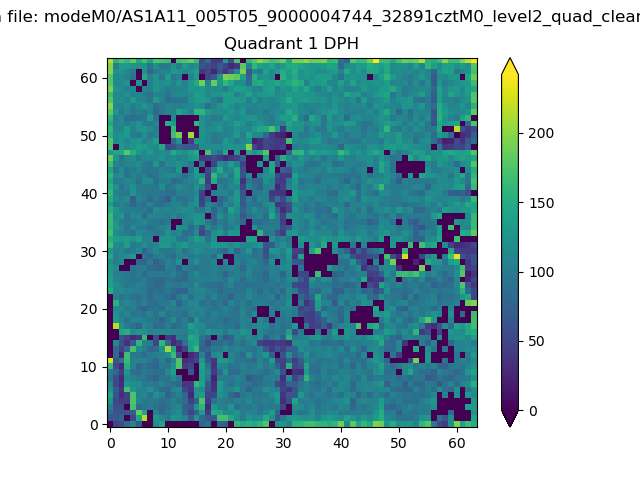
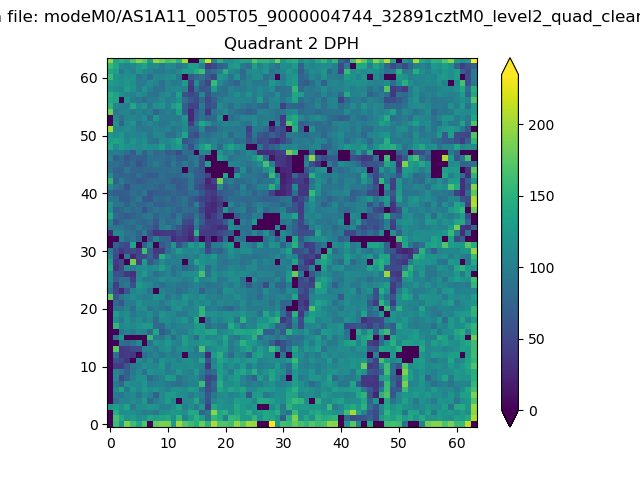
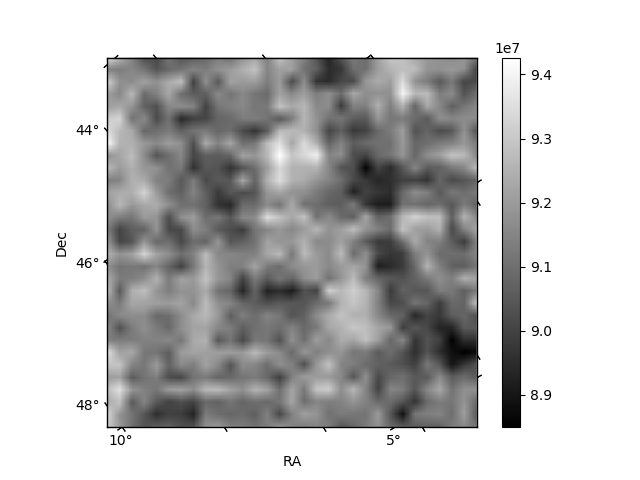
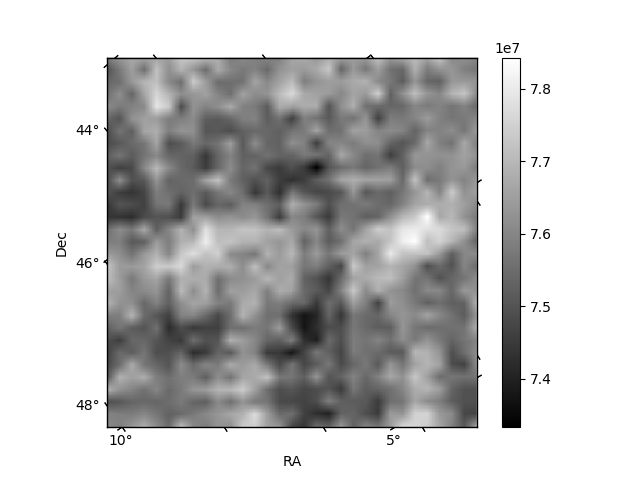
Histogram calculated using DETX and DETY for each event in the final _common_clean file
| Quadrant A |  |
 |
Quadrant B |
|---|---|---|---|
| Quadrant D | 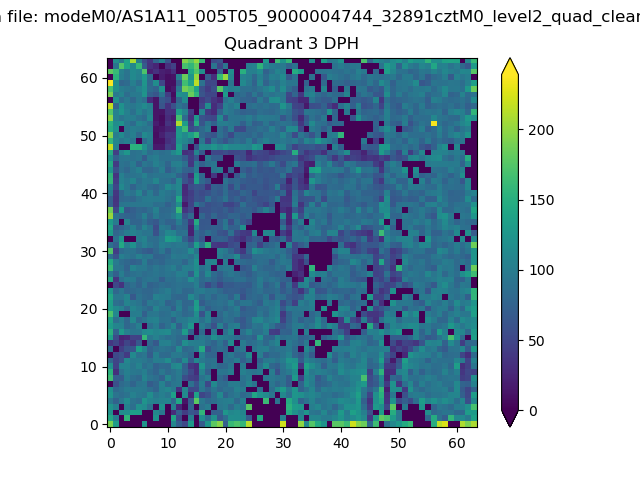 |
 |
Quadrant C |
| Plot type | Count rate plots | Images |
|---|---|---|
| Comparison with Poisson distribution Blue bars denote a histogram of data divided into 1 sec bins. Red curve is a Poisson curve with rate = median count rate of data. |
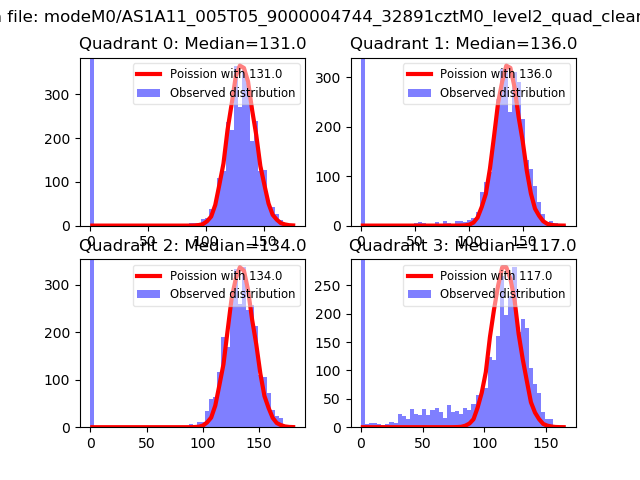 |
 |
| Quadrant-wise count rates Data is divided into 100 sec bins |
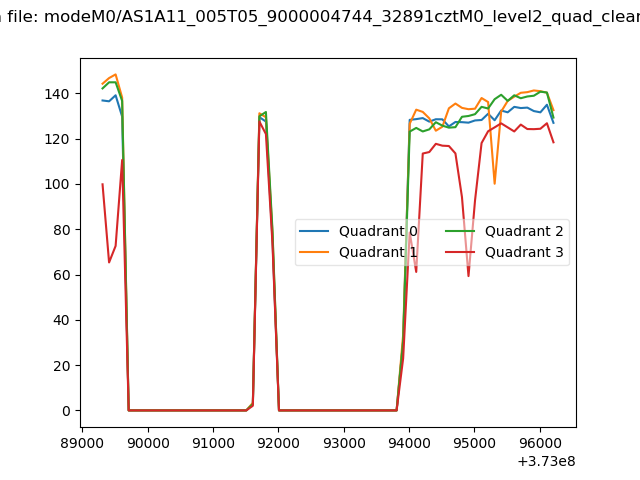 |
|
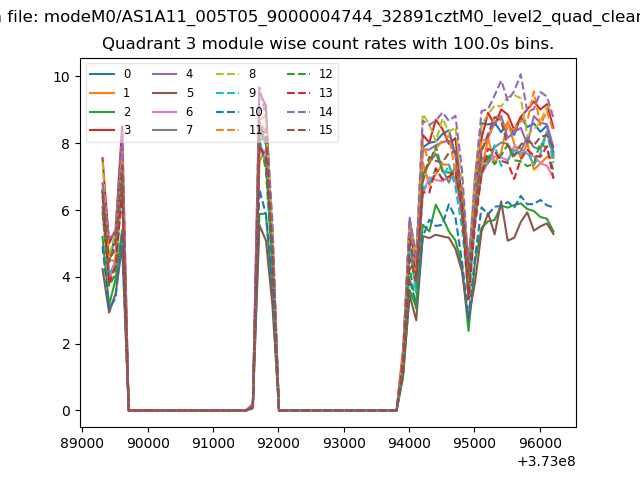
| Module-wise count rates for Quadrant A Data is divided into 100 sec bins |
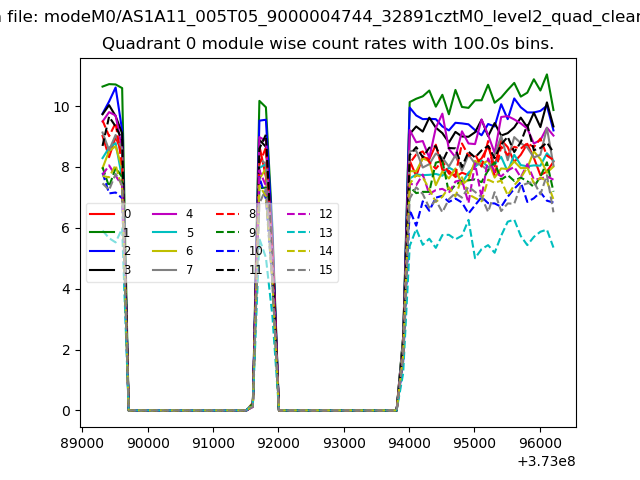 |
 |
| Module-wise count rates for Quadrant B Data is divided into 100 sec bins |
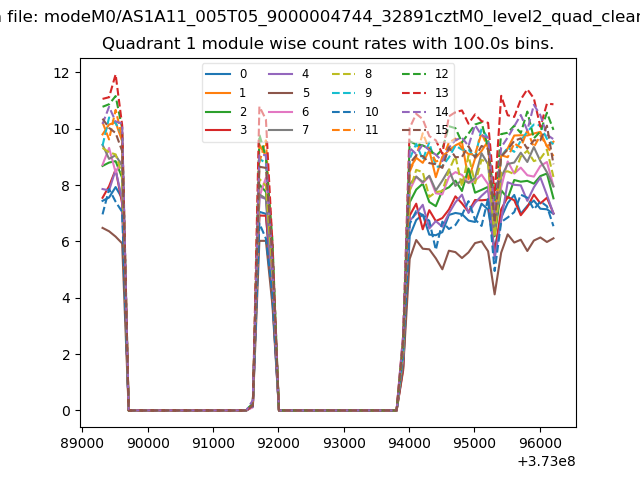 |
 |
| Module-wise count rates for Quadrant C Data is divided into 100 sec bins |
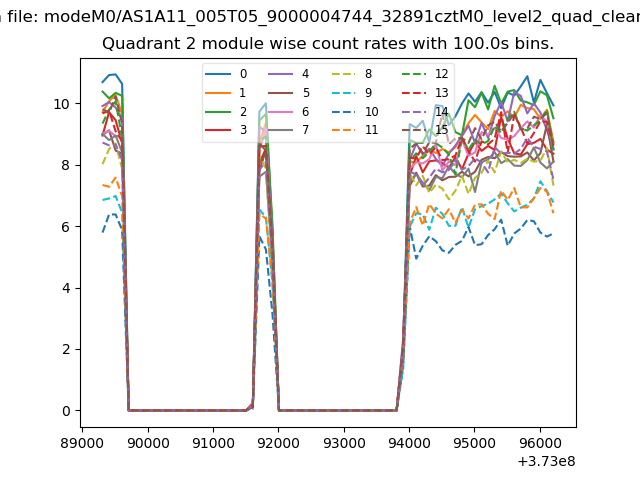 |
 |
| Module-wise count rates for Quadrant D Data is divided into 100 sec bins |
 |
 |
| Parameter | Plot |
|---|---|
| CZT HV Monitor | 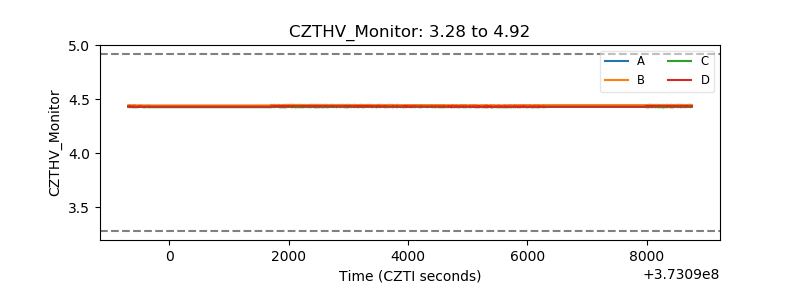 |
| D_VDD | 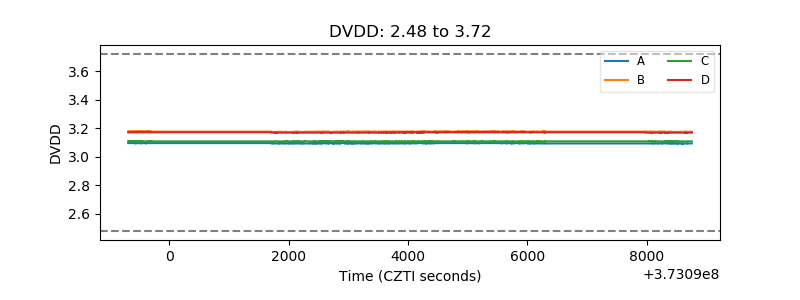 |
| Temperature 1 | 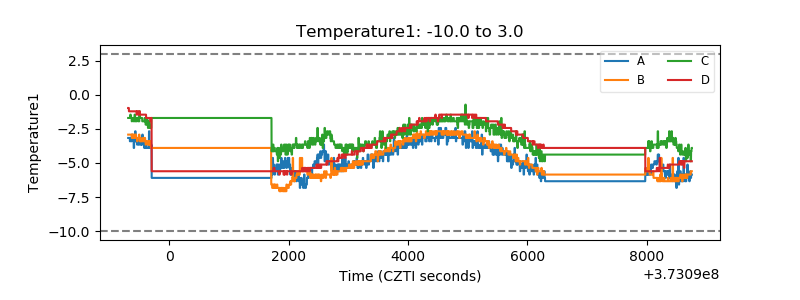 |
| Veto HV Monitor | 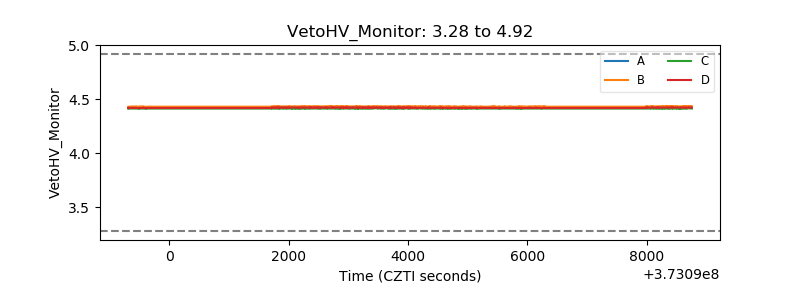 |
| Veto LLD | 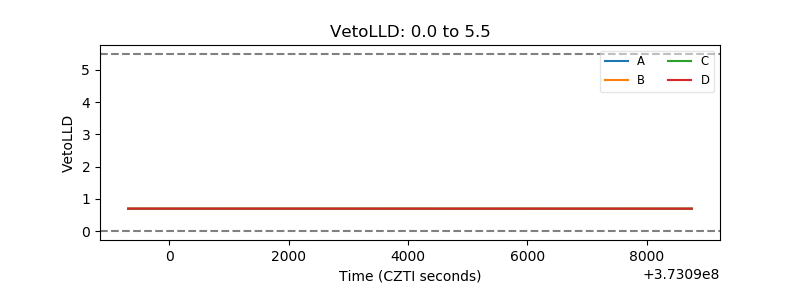 |
| Alpha Counter | 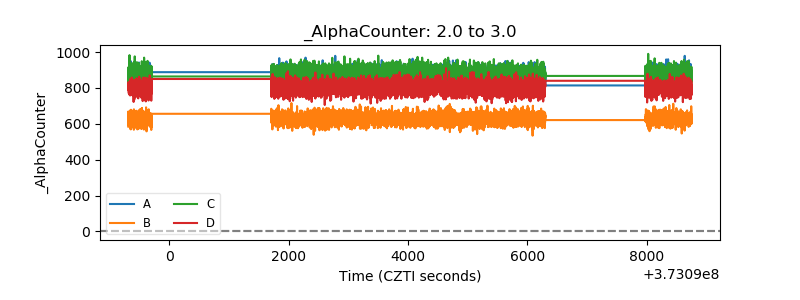 |
| _CPM_Rate | 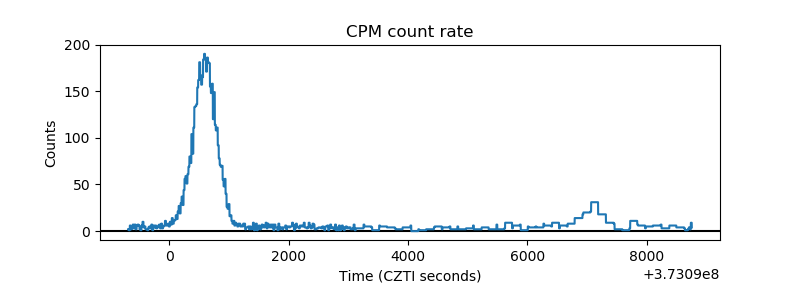 |
| CZT Counter | 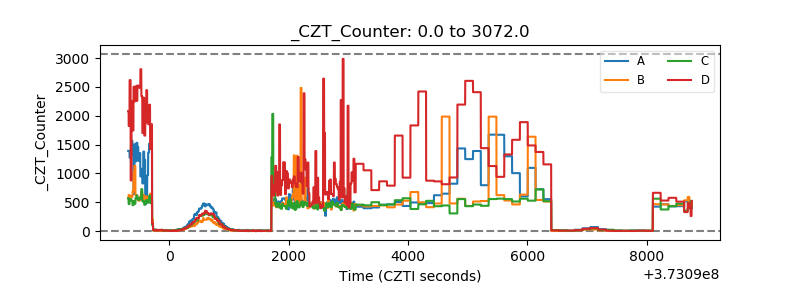 |
| +2.5 Volts monitor |  |
| +5 Volts monitor |  |
| _ROLL_ROT | 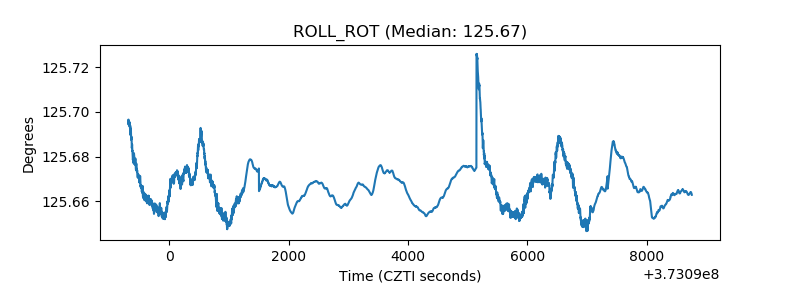 |
| _Roll_DEC | 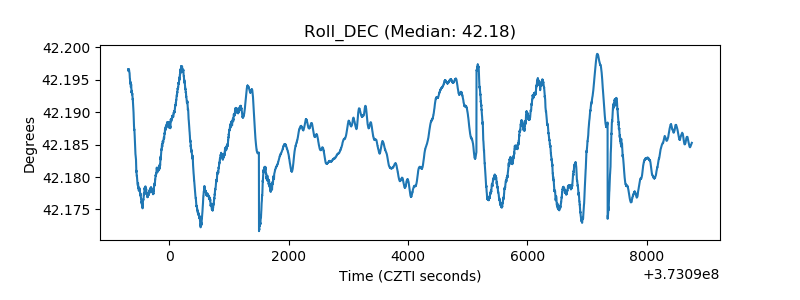 |
| _Roll_RA | 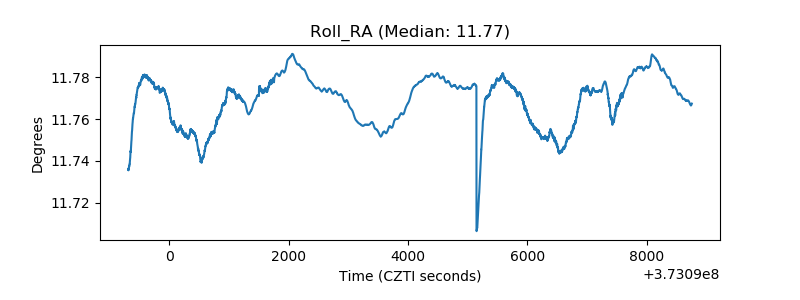 |
| Veto Counter | 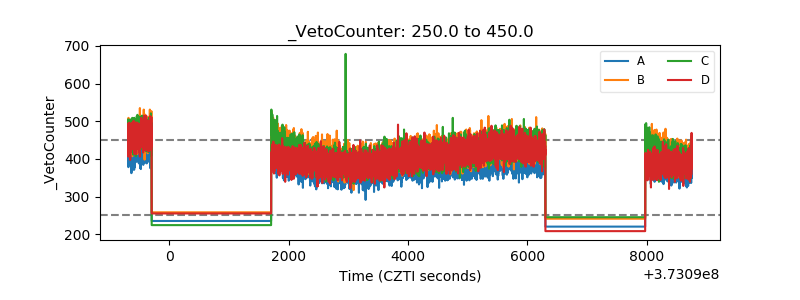 |