| Param | Original file | Final file |
|---|---|---|
| Filename | modeM0/AS1A11_005T05_9000004744_32892cztM0_level2.evt | modeM0/AS1A11_005T05_9000004744_32892cztM0_level2_quad_clean.evt |
| Size (bytes) | 491,065,920 | 66,968,640 |
| Size | 468.3 MB | 63.9 MB |
| Events in quadrant A | 3,081,071 | 410,540 |
| Events in quadrant B | 3,285,909 | 414,134 |
| Events in quadrant C | 3,028,971 | 414,516 |
| Events in quadrant D | 5,077,823 | 377,965 |
| Mode SS | |||
|---|---|---|---|
| Quadrant | BADHDUFLAG | Total packets | Discarded packets |
| A | 0 | 120 | 0 |
| B | 0 | 120 | 0 |
| C | 0 | 120 | 0 |
| D | 0 | 120 | 0 |
| Mode M9 | |||
|---|---|---|---|
| Quadrant | BADHDUFLAG | Total packets | Discarded packets |
| A | 0 | 31 | 0 |
| B | 0 | 31 | 0 |
| C | 0 | 31 | 0 |
| D | 0 | 31 | 0 |
| Mode M0 | |||
|---|---|---|---|
| Quadrant | BADHDUFLAG | Total packets | Discarded packets |
| A | 0 | 12836 | 3 |
| B | 0 | 13370 | 2 |
| C | 0 | 12628 | 2 |
| D | 0 | 19134 | 2 |
| Quadrant | Total seconds | Saturated seconds | Saturation percentage |
|---|---|---|---|
| A | 5878 | 6 | 0.102076% |
| B | 5878 | 137 | 2.330725% |
| C | 5878 | 58 | 0.986730% |
| D | 5878 | 179 | 3.045253% |
Noise dominated data is calculated using 1-second bins in cleaned event files. If a bin has >2000 counts, and if more than 50% of those come from <1% of pixels, then it is considered to be noise-dominated and hence unusable.
| Quadrant | # 1 sec bins | Bins with >0 counts | Bins with >2000 counts | High rate bins dominated by noise | Noise dominated (total time) | Noise dominated (detector-on time) | Marked lightcurve |
|---|---|---|---|---|---|---|---|
| A | 8954 | 5880 | 0 | 0 | 0.00% | 0.00% | 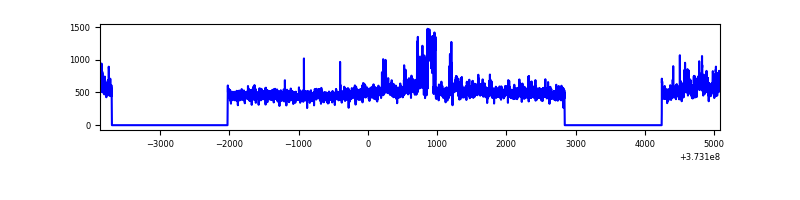 |
| B | 8954 | 5880 | 85 | 85 | 0.95% | 1.45% | 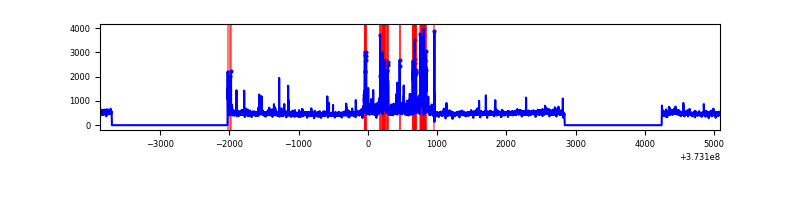 |
| C | 8954 | 5880 | 48 | 48 | 0.54% | 0.82% |  |
| D | 8954 | 5880 | 111 | 111 | 1.24% | 1.89% | 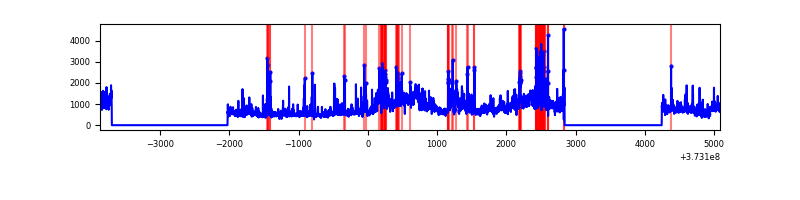 |
Top three noisy pixels from each quadrant. If the there are fewer than three noisy pixels in the level2.evt file, extra rows are filled as -1
| Pixel properties | Quadrant properties | ||||||
|---|---|---|---|---|---|---|---|
| Quadrant | DetID | PixID | Counts | Sigma | Mean | Median | Sigma |
| A | 14 | 63 | 400035 | 2897.77 | 687 | 672 | 137.8 |
| A | 13 | 6 | 13289 | 91.55 | 687 | 672 | 137.8 |
| A | 13 | 254 | 11871 | 81.26 | 687 | 672 | 137.8 |
| B | 5 | 172 | 440938 | 3406.2 | 683 | 666 | 129.3 |
| B | 0 | 219 | 59326 | 453.83 | 683 | 666 | 129.3 |
| B | 0 | 197 | 39312 | 298.99 | 683 | 666 | 129.3 |
| C | 0 | 10 | 219875 | 1414.03 | 668 | 673 | 155.0 |
| C | 14 | 67 | 145076 | 931.51 | 668 | 673 | 155.0 |
| C | 7 | 221 | 17453 | 108.24 | 668 | 673 | 155.0 |
| D | 8 | 195 | 1708993 | 9994.99 | 657 | 643 | 170.9 |
| D | 2 | 250 | 271622 | 1585.41 | 657 | 643 | 170.9 |
| D | 2 | 120 | 157994 | 920.61 | 657 | 643 | 170.9 |
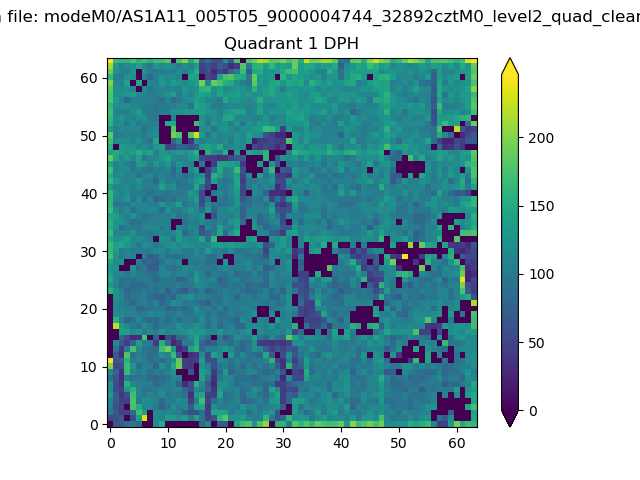
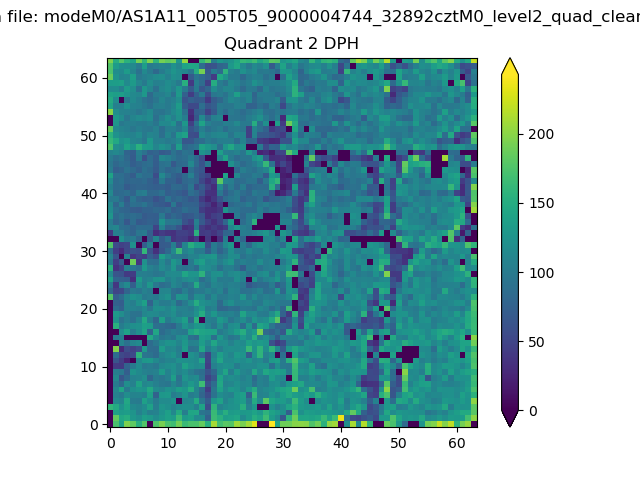
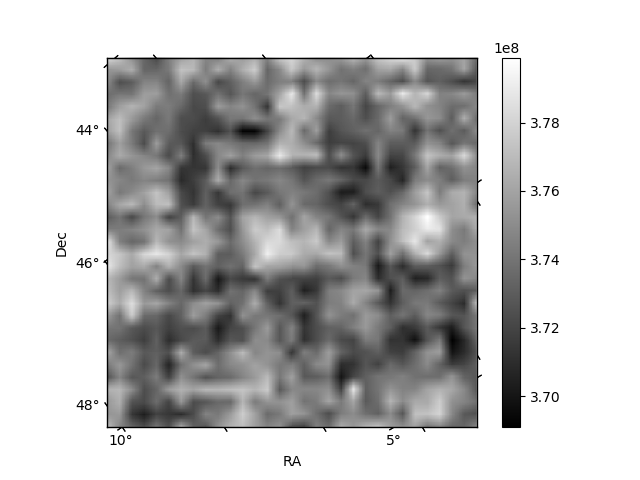
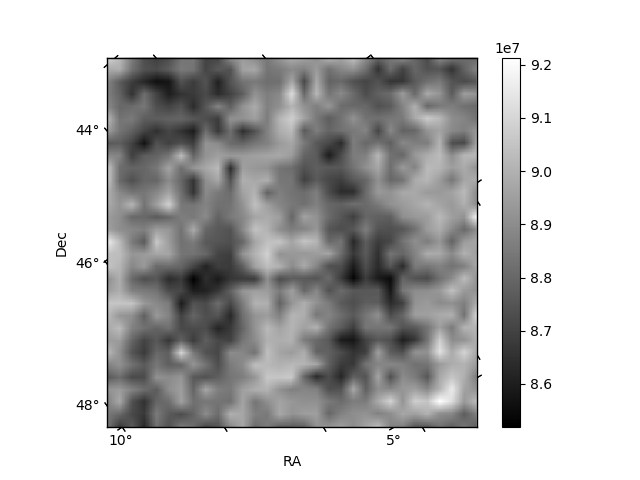
Histogram calculated using DETX and DETY for each event in the final _common_clean file
| Quadrant A | 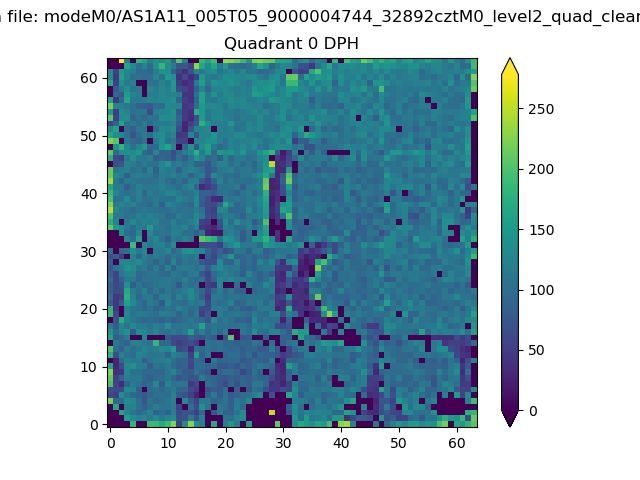 |
 |
Quadrant B |
|---|---|---|---|
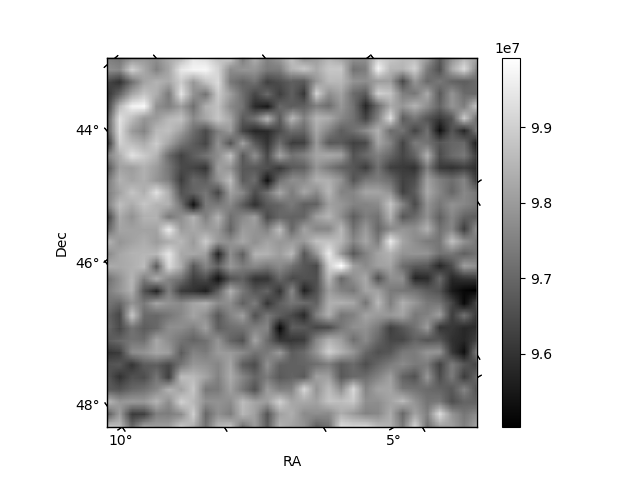
| Quadrant D | 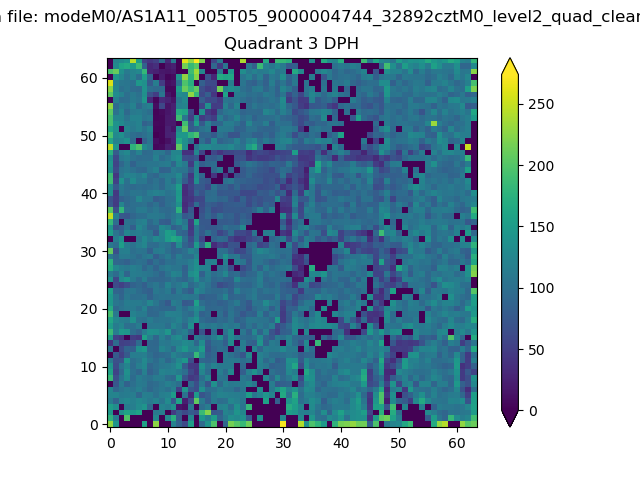 |
 |
Quadrant C |
| Plot type | Count rate plots | Images |
|---|---|---|
| Comparison with Poisson distribution Blue bars denote a histogram of data divided into 1 sec bins. Red curve is a Poisson curve with rate = median count rate of data. |
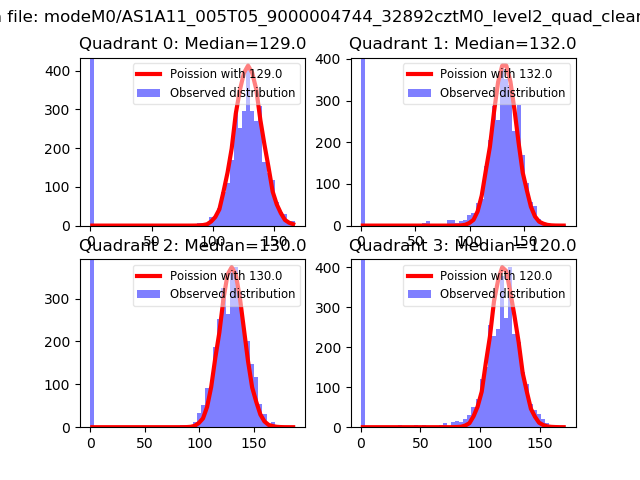 |
 |
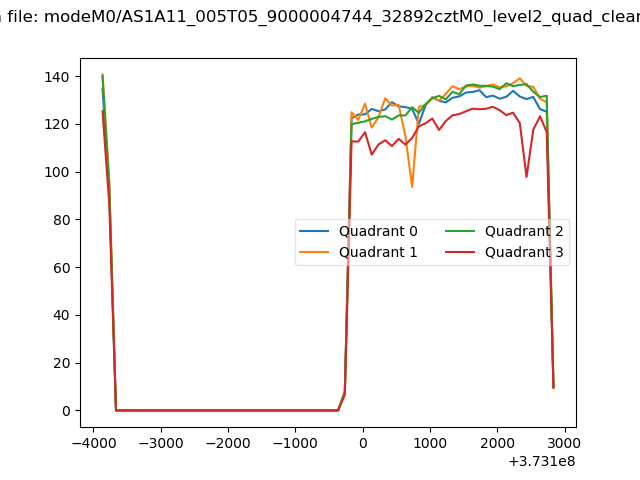
| Quadrant-wise count rates Data is divided into 100 sec bins |
 |
|
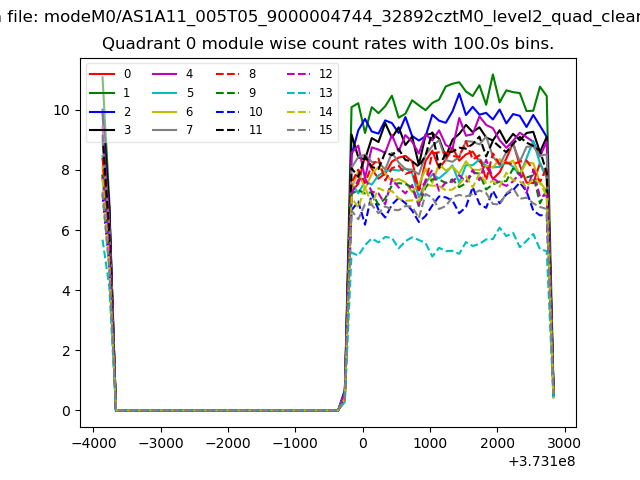
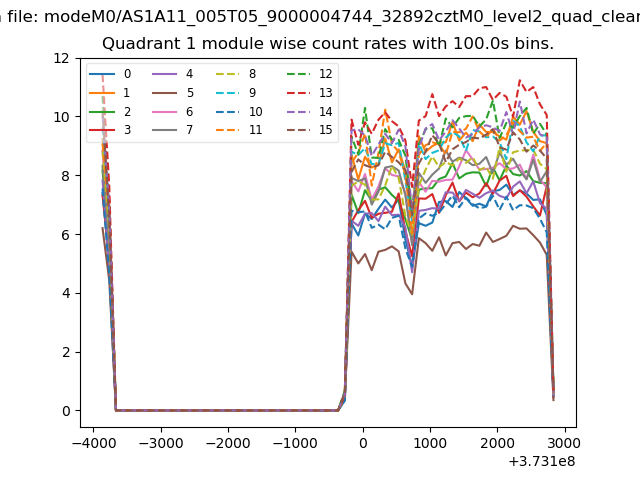
| Module-wise count rates for Quadrant A Data is divided into 100 sec bins |
 |
 |
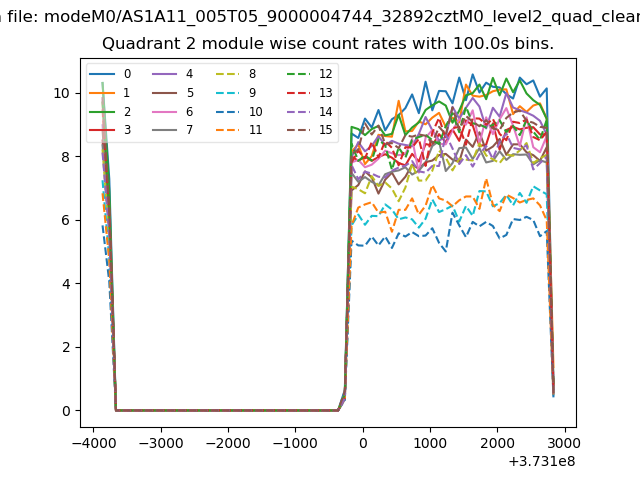
| Module-wise count rates for Quadrant B Data is divided into 100 sec bins |
 |
 |
| Module-wise count rates for Quadrant C Data is divided into 100 sec bins |
 |
 |
| Module-wise count rates for Quadrant D Data is divided into 100 sec bins |
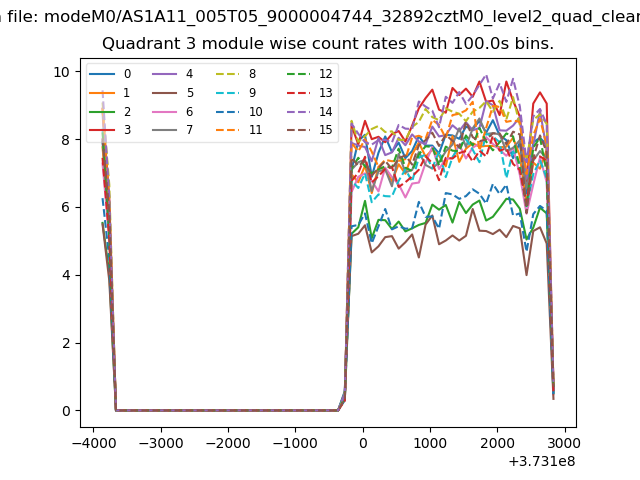 |
 |
| Parameter | Plot |
|---|---|
| CZT HV Monitor | 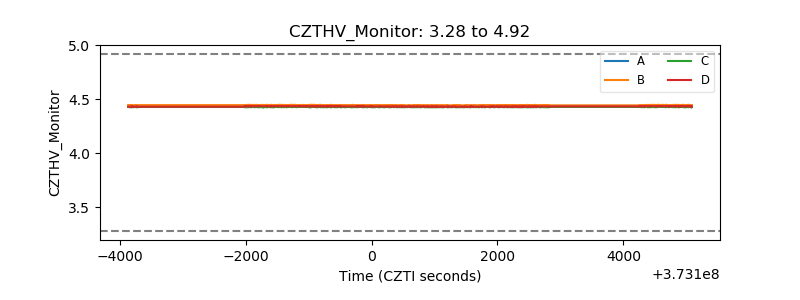 |
| D_VDD | 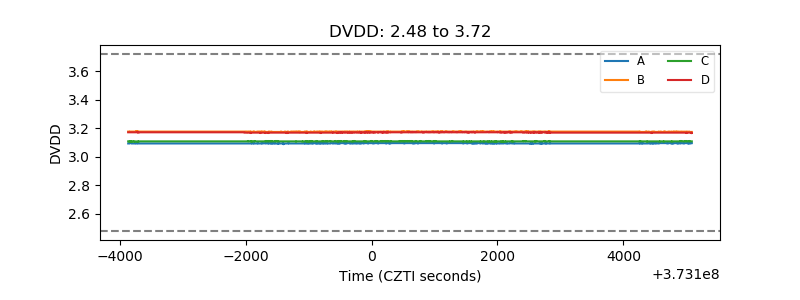 |
| Temperature 1 | 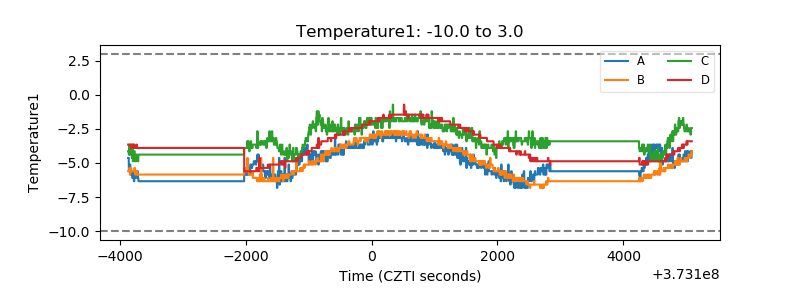 |
| Veto HV Monitor | 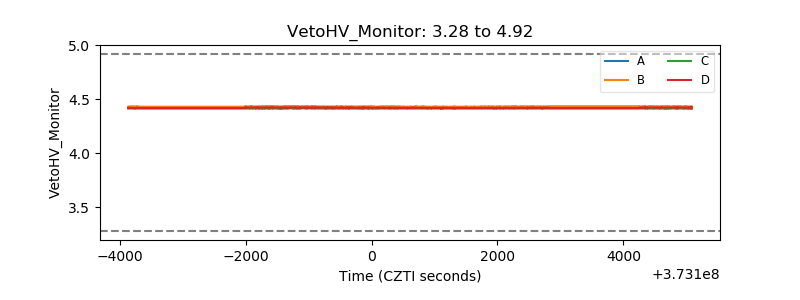 |
| Veto LLD | 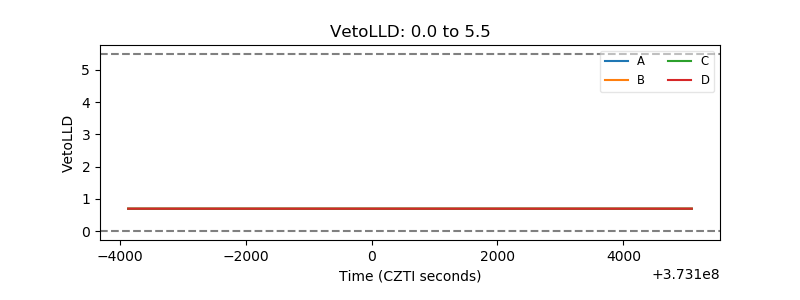 |
| Alpha Counter | 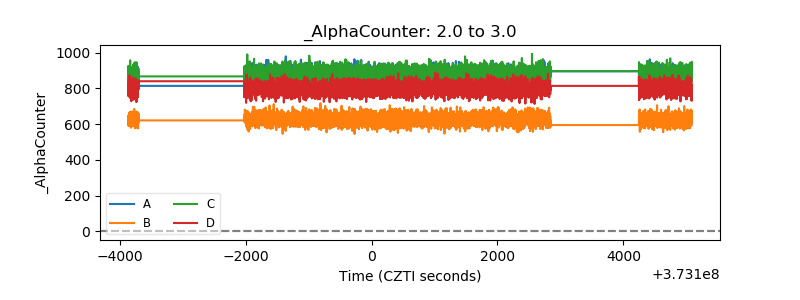 |
| _CPM_Rate | 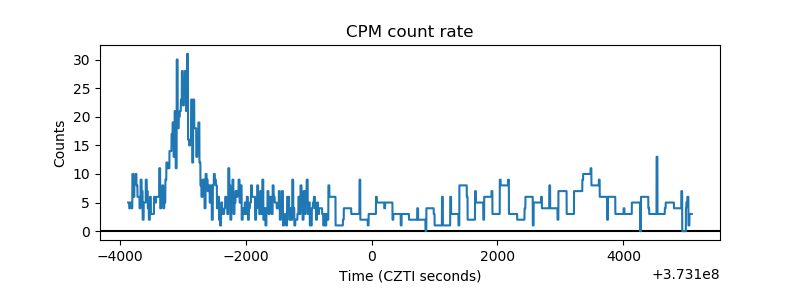 |
| CZT Counter | 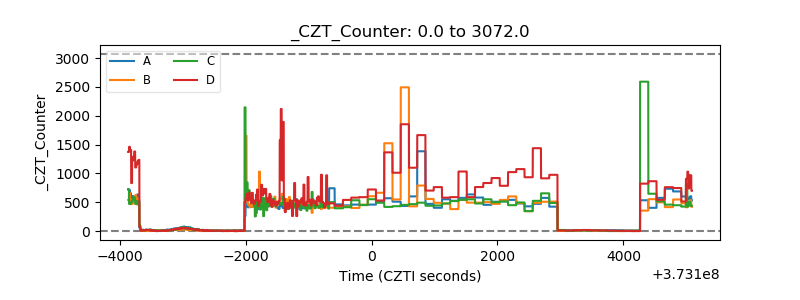 |
| +2.5 Volts monitor |  |
| +5 Volts monitor |  |
| _ROLL_ROT | 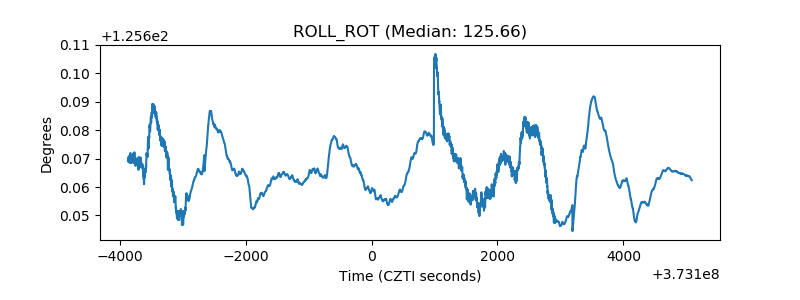 |
| _Roll_DEC | 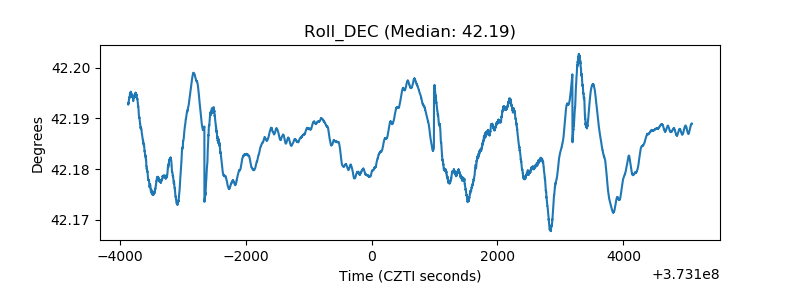 |
| _Roll_RA | 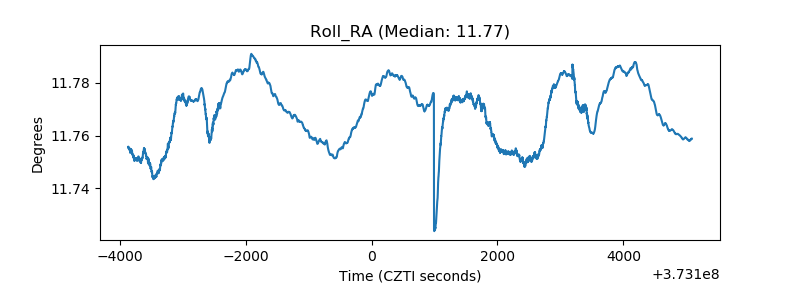 |
| Veto Counter | 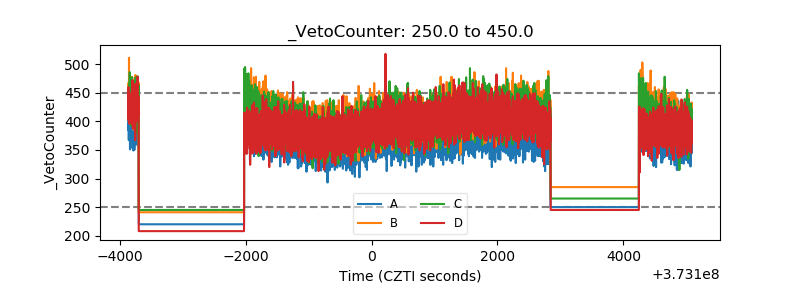 |