| Param | Original file | Final file |
|---|---|---|
| Filename | modeM0/AS1A11_005T05_9000004744_32899cztM0_level2.evt | modeM0/AS1A11_005T05_9000004744_32899cztM0_level2_quad_clean.evt |
| Size (bytes) | 447,367,680 | 75,096,000 |
| Size | 426.6 MB | 71.6 MB |
| Events in quadrant A | 2,383,376 | 491,850 |
| Events in quadrant B | 2,752,712 | 493,842 |
| Events in quadrant C | 2,653,881 | 496,011 |
| Events in quadrant D | 5,420,966 | 443,232 |
| Mode SS | |||
|---|---|---|---|
| Quadrant | BADHDUFLAG | Total packets | Discarded packets |
| A | 0 | 102 | 0 |
| B | 0 | 102 | 0 |
| C | 0 | 102 | 0 |
| D | 0 | 102 | 0 |
| Mode M9 | |||
|---|---|---|---|
| Quadrant | BADHDUFLAG | Total packets | Discarded packets |
| A | 0 | 23 | 0 |
| B | 0 | 23 | 0 |
| C | 0 | 23 | 0 |
| D | 0 | 24 | 0 |
| Mode M0 | |||
|---|---|---|---|
| Quadrant | BADHDUFLAG | Total packets | Discarded packets |
| A | 0 | 10437 | 2 |
| B | 0 | 11483 | 2 |
| C | 0 | 11134 | 2 |
| D | 0 | 19769 | 2 |
| Quadrant | Total seconds | Saturated seconds | Saturation percentage |
|---|---|---|---|
| A | 4974 | 14 | 0.281464% |
| B | 4974 | 72 | 1.447527% |
| C | 4974 | 61 | 1.226377% |
| D | 4974 | 448 | 9.006836% |
Noise dominated data is calculated using 1-second bins in cleaned event files. If a bin has >2000 counts, and if more than 50% of those come from <1% of pixels, then it is considered to be noise-dominated and hence unusable.
| Quadrant | # 1 sec bins | Bins with >0 counts | Bins with >2000 counts | High rate bins dominated by noise | Noise dominated (total time) | Noise dominated (detector-on time) | Marked lightcurve |
|---|---|---|---|---|---|---|---|
| A | 6767 | 4975 | 4 | 4 | 0.06% | 0.08% | 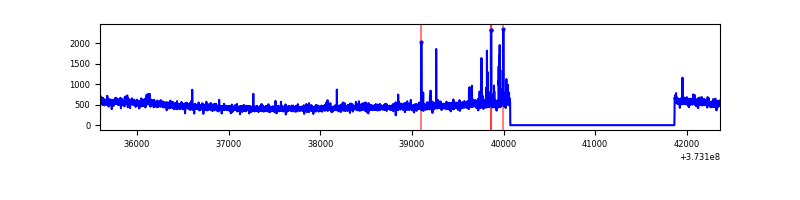 |
| B | 6767 | 4975 | 46 | 46 | 0.68% | 0.92% | 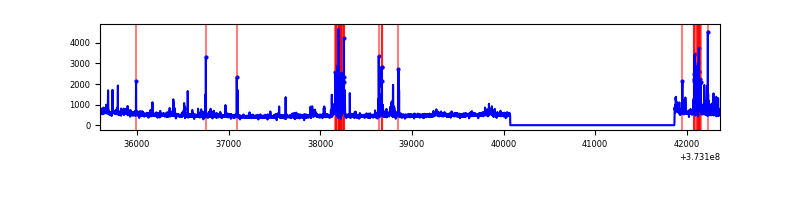 |
| C | 6767 | 4975 | 48 | 48 | 0.71% | 0.96% | 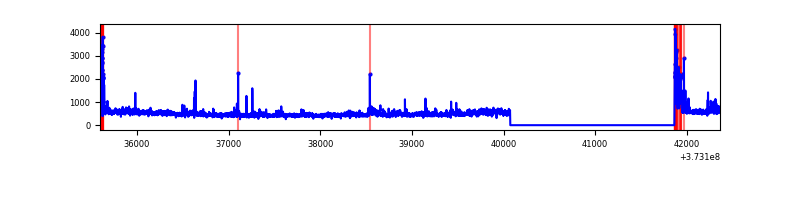 |
| D | 6767 | 4975 | 364 | 364 | 5.38% | 7.32% | 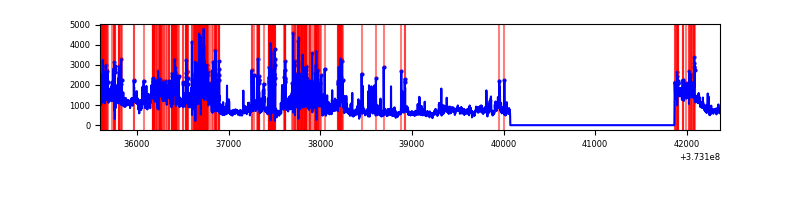 |
Top three noisy pixels from each quadrant. If the there are fewer than three noisy pixels in the level2.evt file, extra rows are filled as -1
| Pixel properties | Quadrant properties | ||||||
|---|---|---|---|---|---|---|---|
| Quadrant | DetID | PixID | Counts | Sigma | Mean | Median | Sigma |
| A | 7 | 16 | 35707 | 300.13 | 589 | 578 | 117.0 |
| A | 14 | 63 | 30266 | 253.64 | 589 | 578 | 117.0 |
| A | 9 | 143 | 22027 | 183.25 | 589 | 578 | 117.0 |
| B | 5 | 172 | 242480 | 2176.89 | 588 | 573 | 111.1 |
| B | 0 | 199 | 43171 | 383.33 | 588 | 573 | 111.1 |
| B | 0 | 230 | 40067 | 355.4 | 588 | 573 | 111.1 |
| C | 0 | 10 | 223346 | 1667.53 | 579 | 583 | 133.6 |
| C | 14 | 67 | 106107 | 789.92 | 579 | 583 | 133.6 |
| C | 0 | 207 | 21595 | 157.29 | 579 | 583 | 133.6 |
| D | 8 | 195 | 1166836 | 8344.17 | 558 | 544 | 139.8 |
| D | 2 | 250 | 803504 | 5744.73 | 558 | 544 | 139.8 |
| D | 10 | 203 | 533792 | 3815.09 | 558 | 544 | 139.8 |
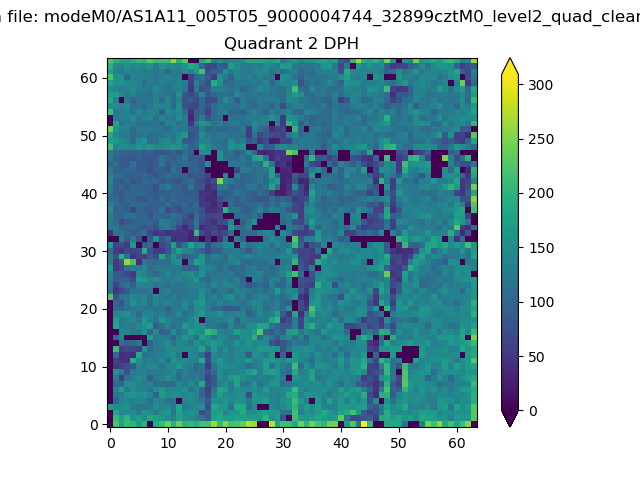
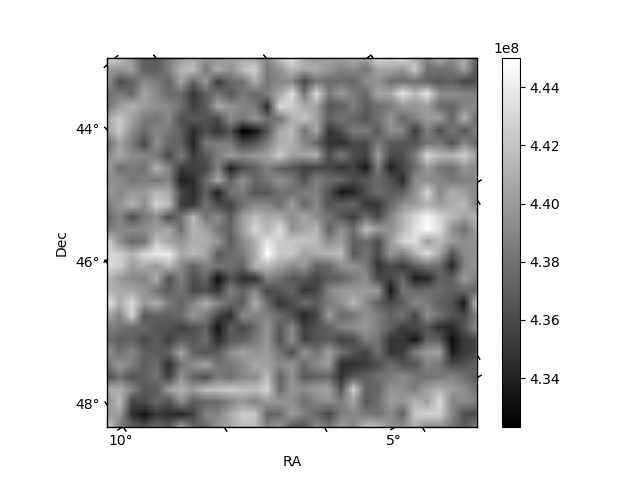
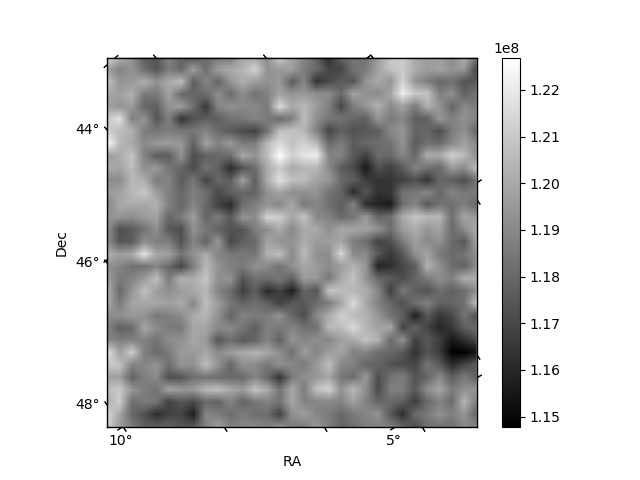
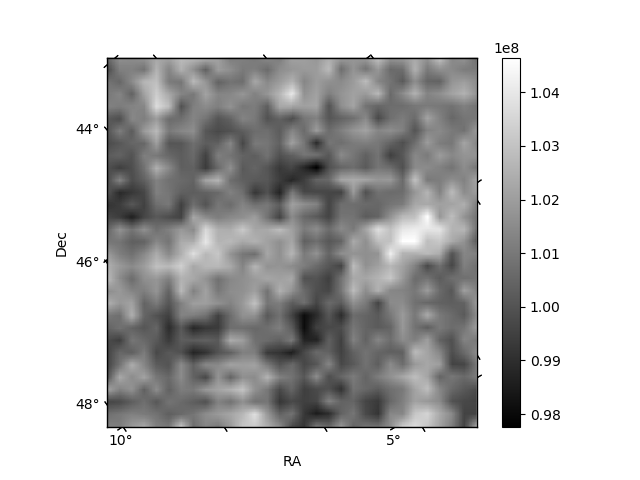
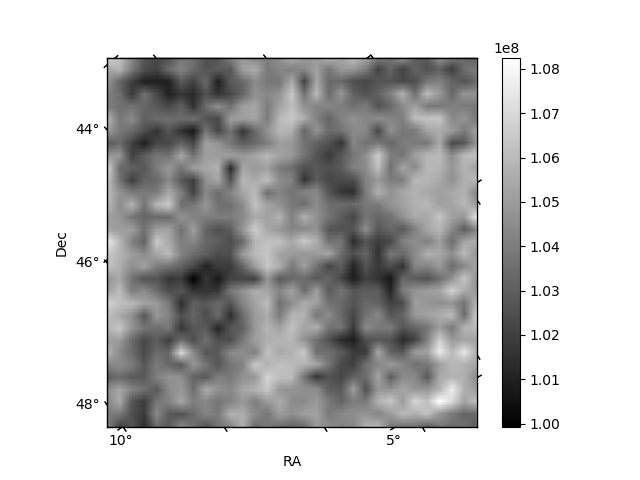
Histogram calculated using DETX and DETY for each event in the final _common_clean file
| Quadrant A | 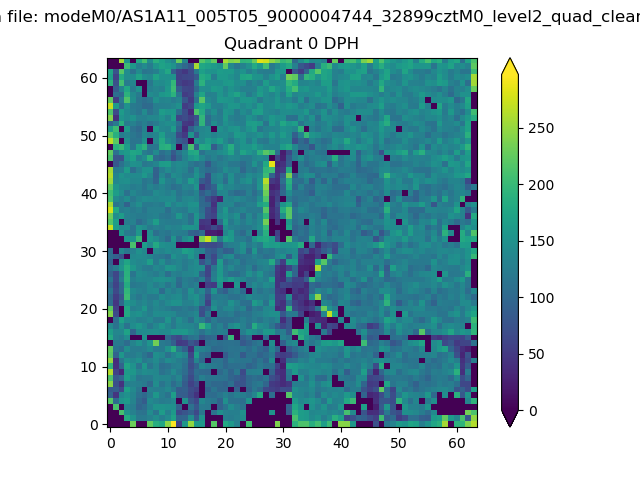 |
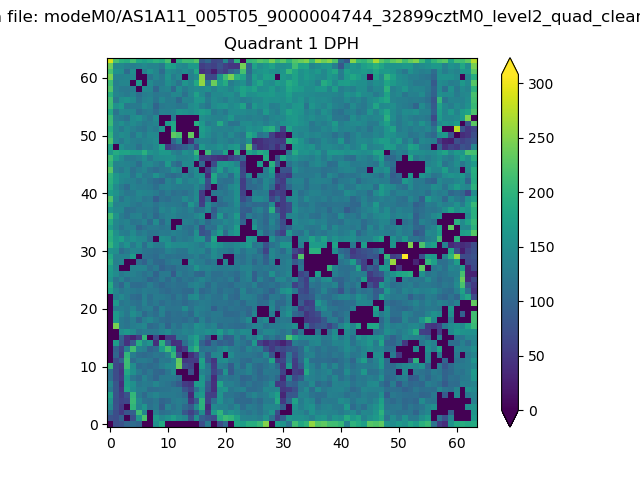 |
Quadrant B |
|---|---|---|---|
| Quadrant D | 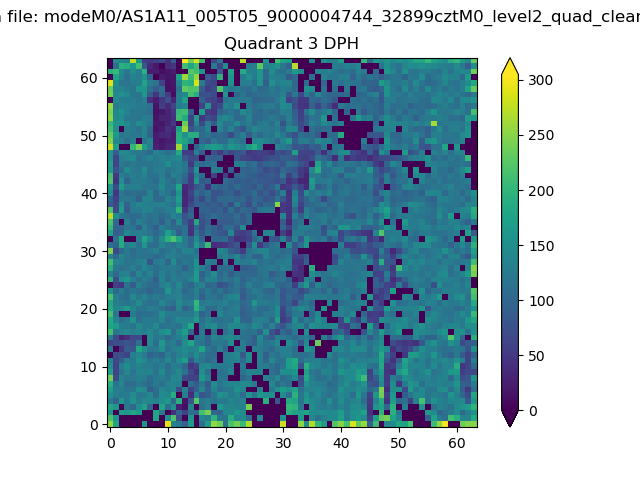 |
 |
Quadrant C |
| Plot type | Count rate plots | Images |
|---|---|---|
| Comparison with Poisson distribution Blue bars denote a histogram of data divided into 1 sec bins. Red curve is a Poisson curve with rate = median count rate of data. |
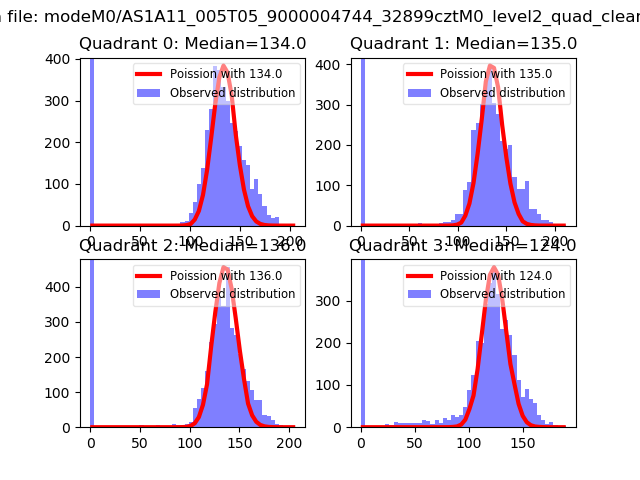 |
 |
| Quadrant-wise count rates Data is divided into 100 sec bins |
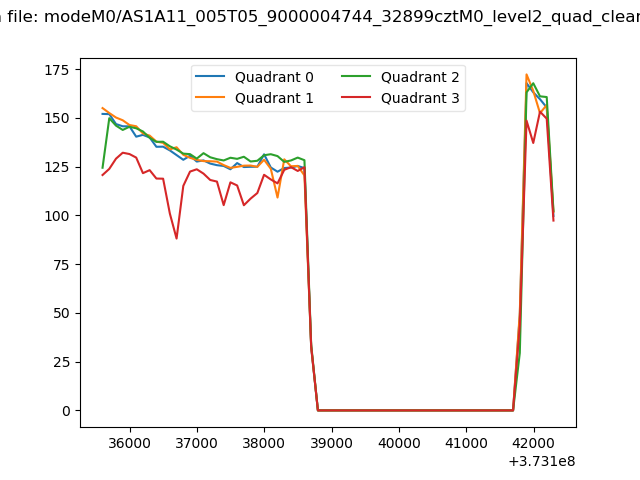 |
|
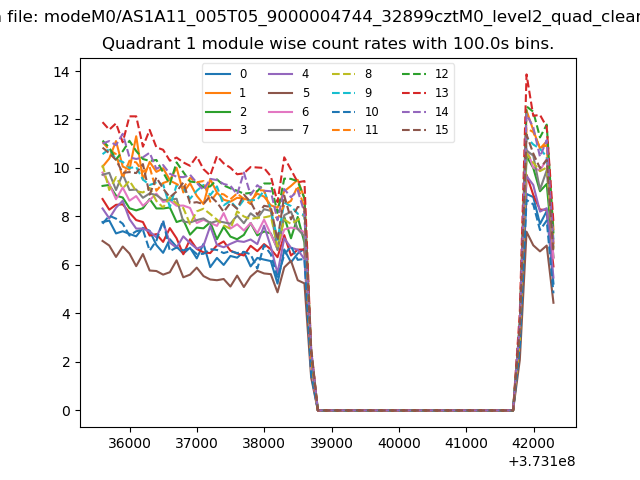
| Module-wise count rates for Quadrant A Data is divided into 100 sec bins |
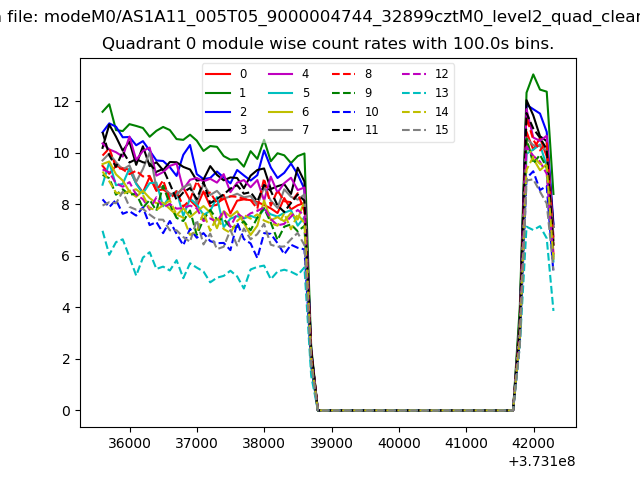 |
 |
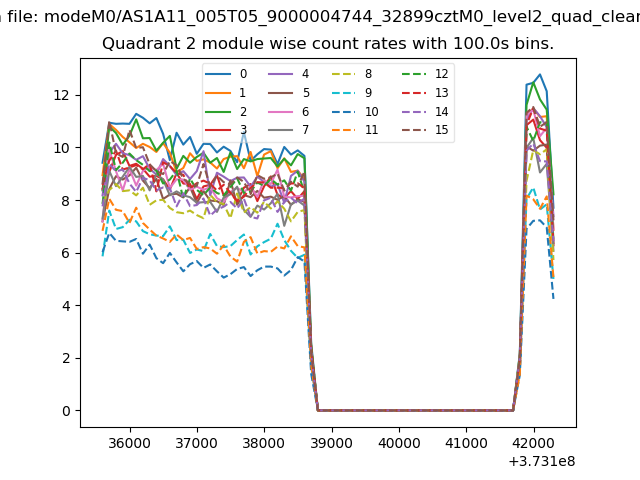
| Module-wise count rates for Quadrant B Data is divided into 100 sec bins |
 |
 |
| Module-wise count rates for Quadrant C Data is divided into 100 sec bins |
 |
 |
| Module-wise count rates for Quadrant D Data is divided into 100 sec bins |
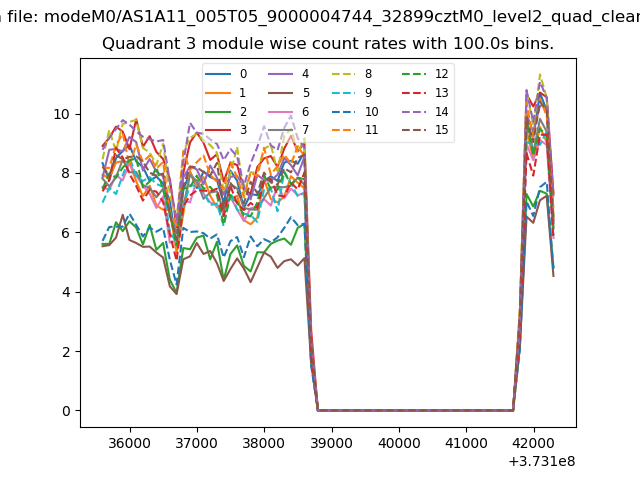 |
 |
| Parameter | Plot |
|---|---|
| CZT HV Monitor | 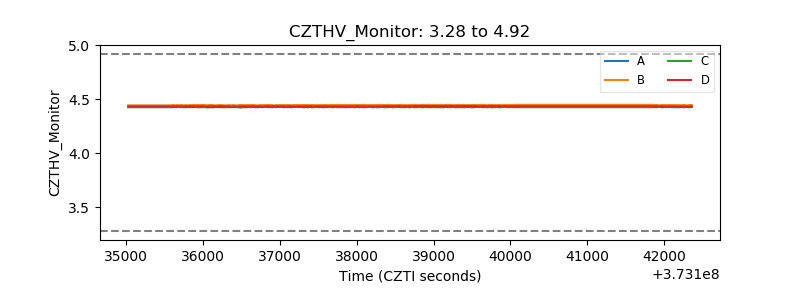 |
| D_VDD | 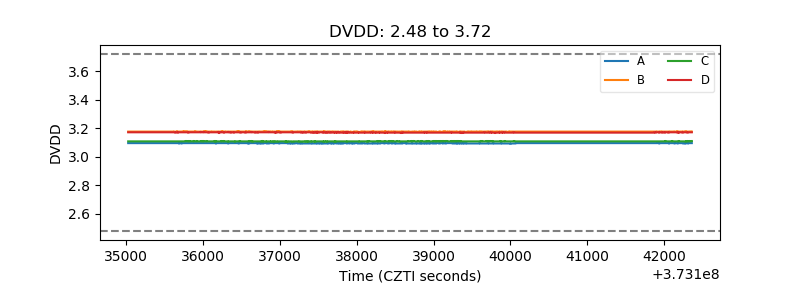 |
| Temperature 1 | 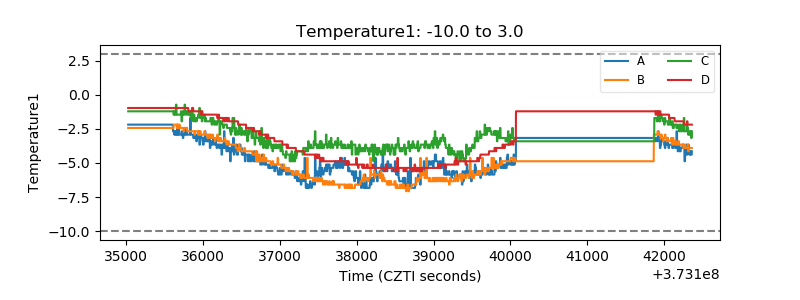 |
| Veto HV Monitor | 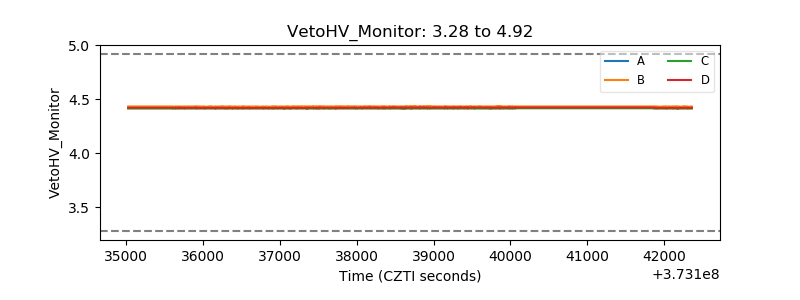 |
| Veto LLD | 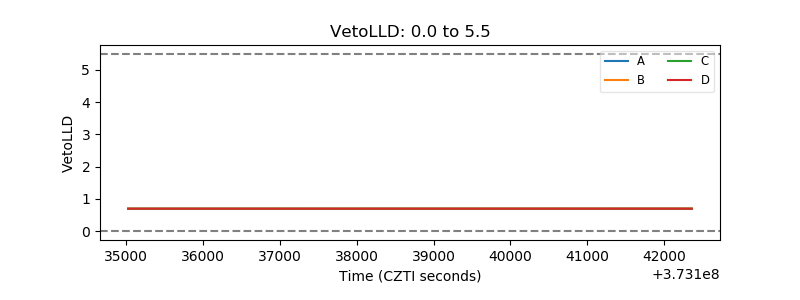 |
| Alpha Counter | 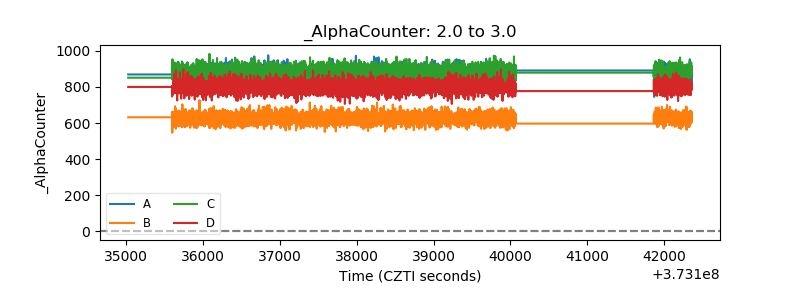 |
| _CPM_Rate | 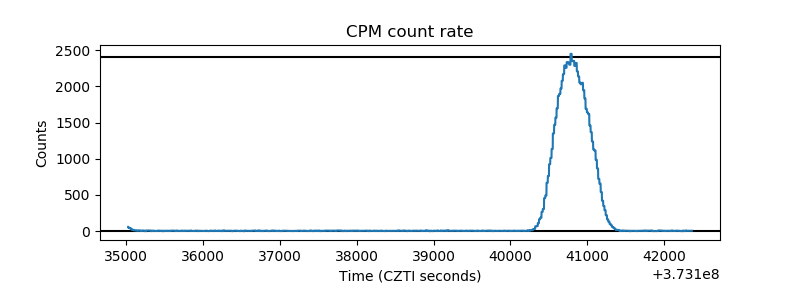 |
| CZT Counter | 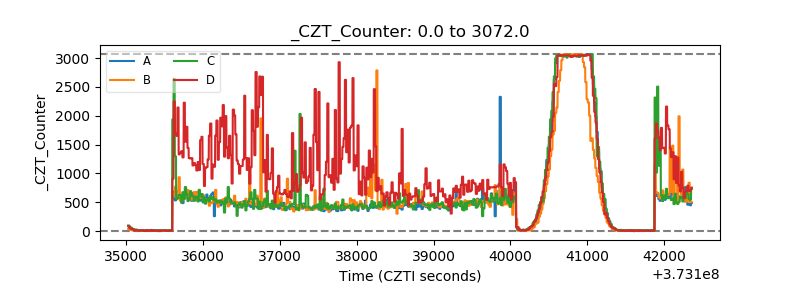 |
| +2.5 Volts monitor |  |
| +5 Volts monitor |  |
| _ROLL_ROT | 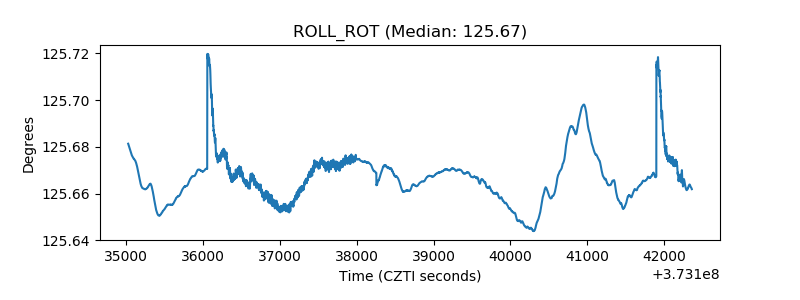 |
| _Roll_DEC |  |
| _Roll_RA | 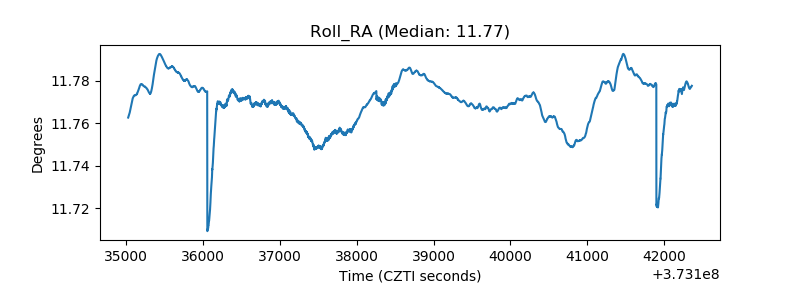 |
| Veto Counter | 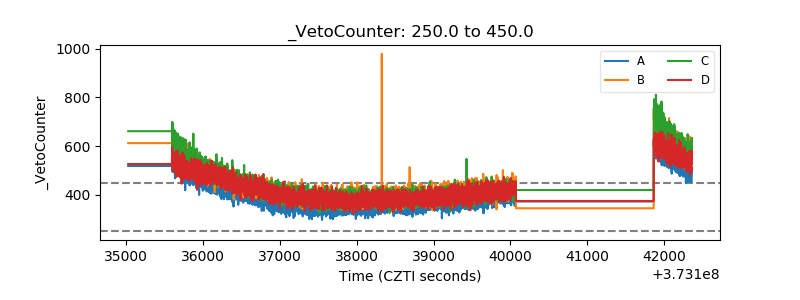 |